This document discusses non-parametric tests, which are statistical tests that make fewer assumptions about the population distribution compared to parametric tests. Some key points:
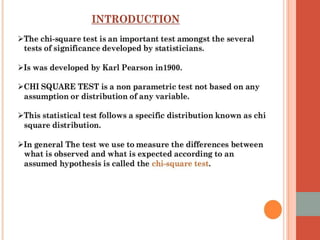
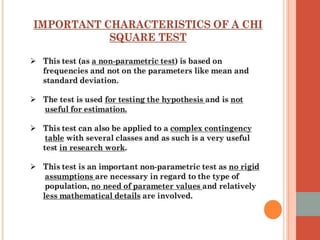
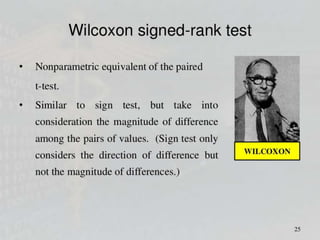
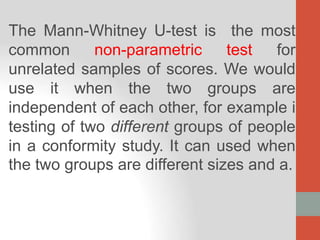
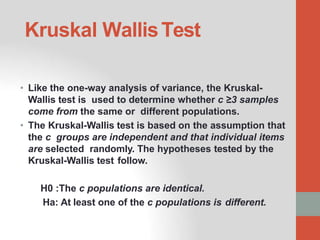
1) Non-parametric tests like the chi-square test, sign test, Wilcoxon signed-rank test, Mann-Whitney U-test, and Kruskal-Wallis test are used when the population is not normally distributed or sample sizes are small.
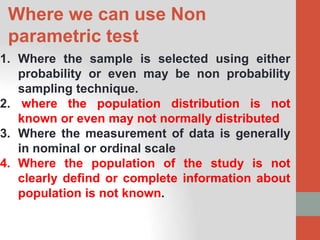
2) They are applied in situations where data is on an ordinal scale rather than a continuous scale, the population is not well defined, or the distribution is unknown.
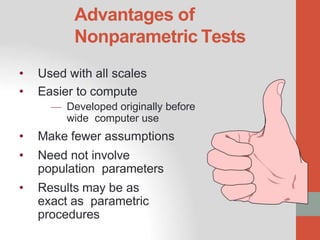
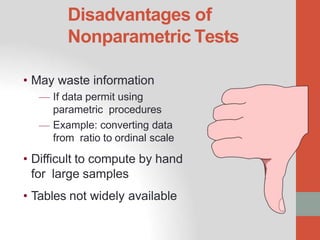
3) Advantages are that they are easier to compute and make fewer assumptions than parametric tests,


![Non_parametric_test-4[1].pptx -[1] 2.pptx](https://cdn.slidesharecdn.com/ss_thumbnails/nonparametrictest-41-260115135338-f2d1eaa3-thumbnail.jpg?width=640&height=640&fit=bounds)


![[DSC Europe 25] Slobodan Dolinic - Smart and Intelligent Green Region.pptx](https://cdn.slidesharecdn.com/ss_thumbnails/0bribinjsp6ghwtvsvor-2-sigre-slobodan-dolinic-260115093812-c9c10e90-thumbnail.jpg?width=640&height=640&fit=bounds)


