1) The document discusses parametric tests and the t-test/Student's t-test. It provides examples of different types of parametric tests and explains what assumptions are made.
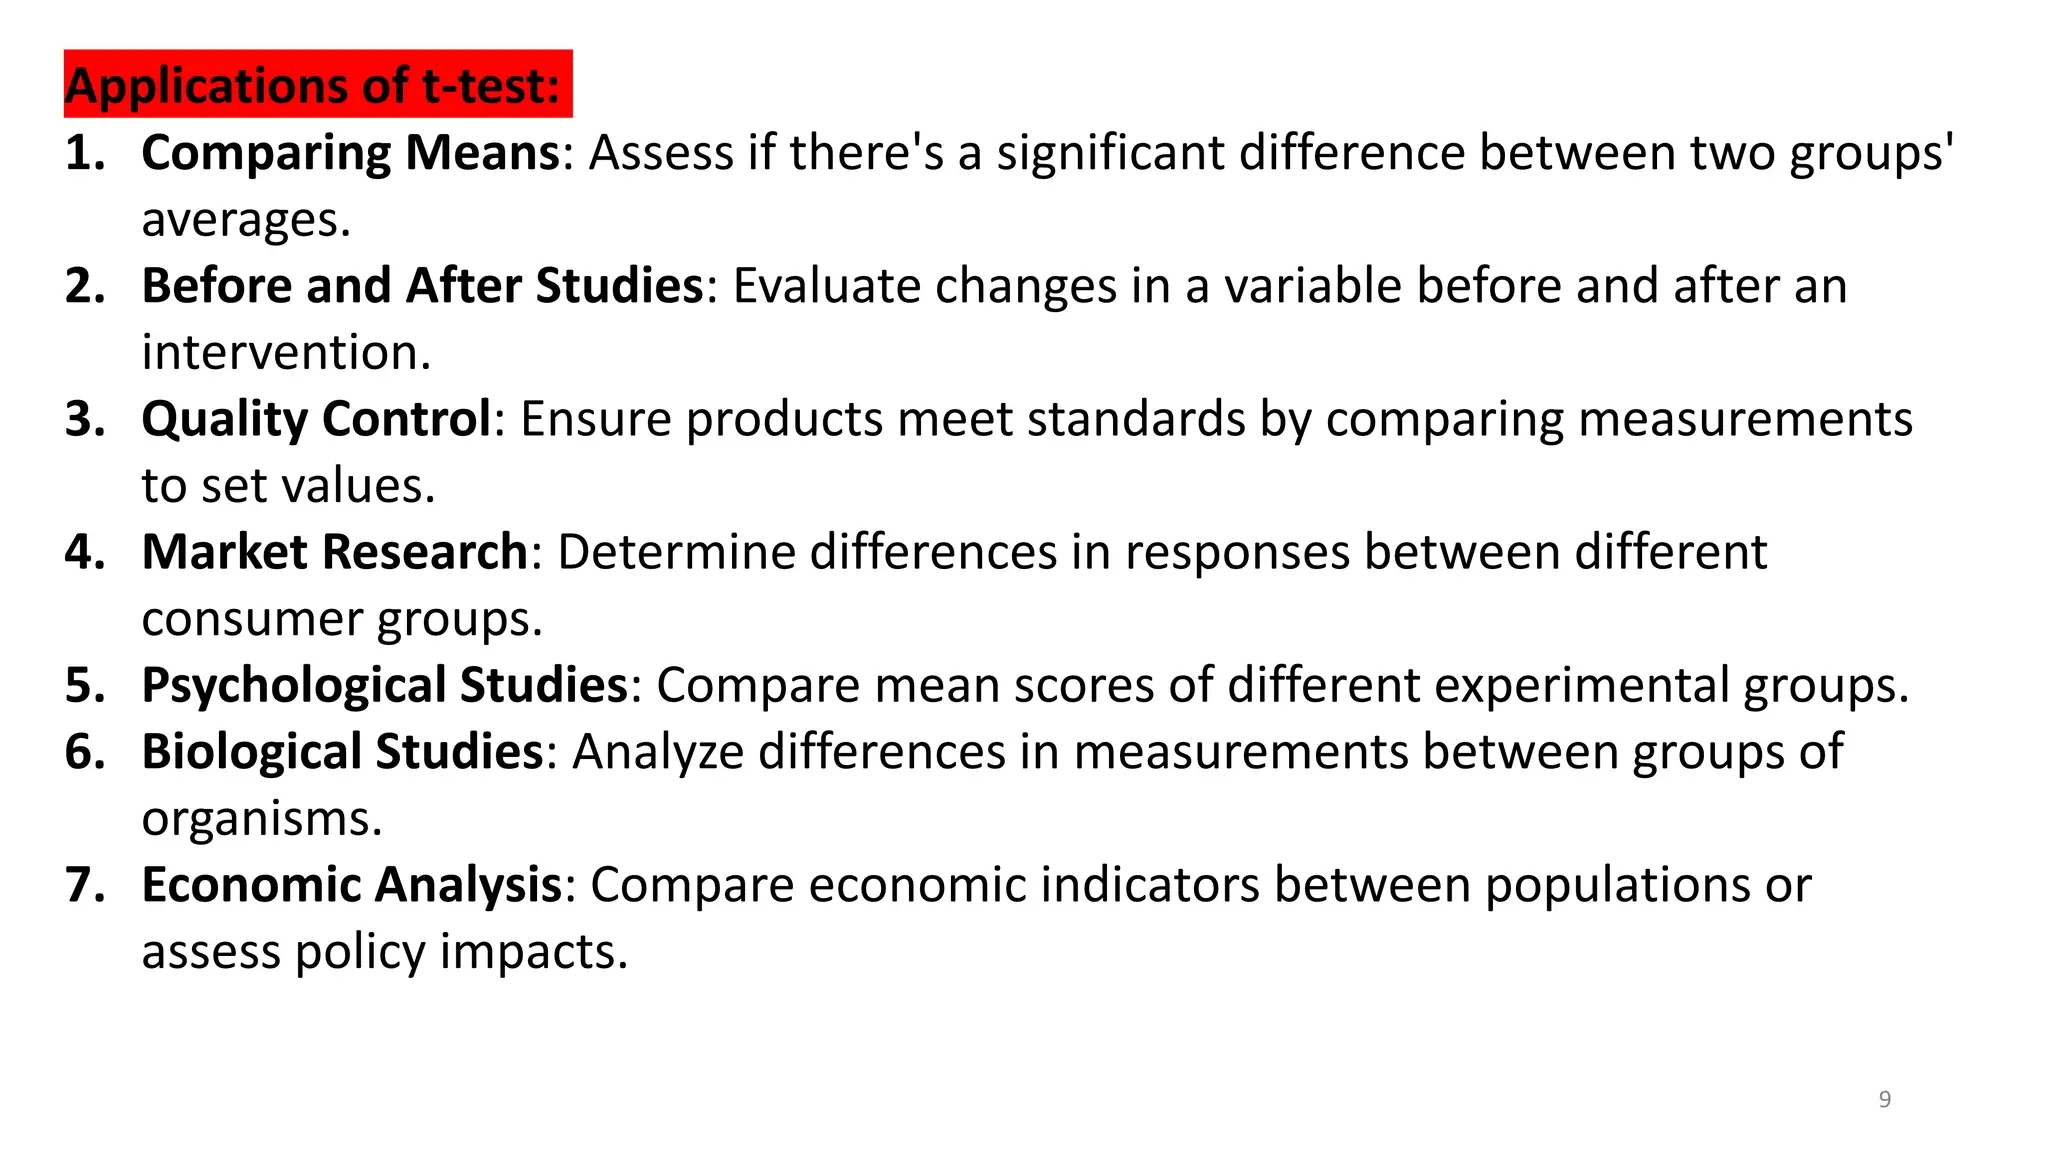
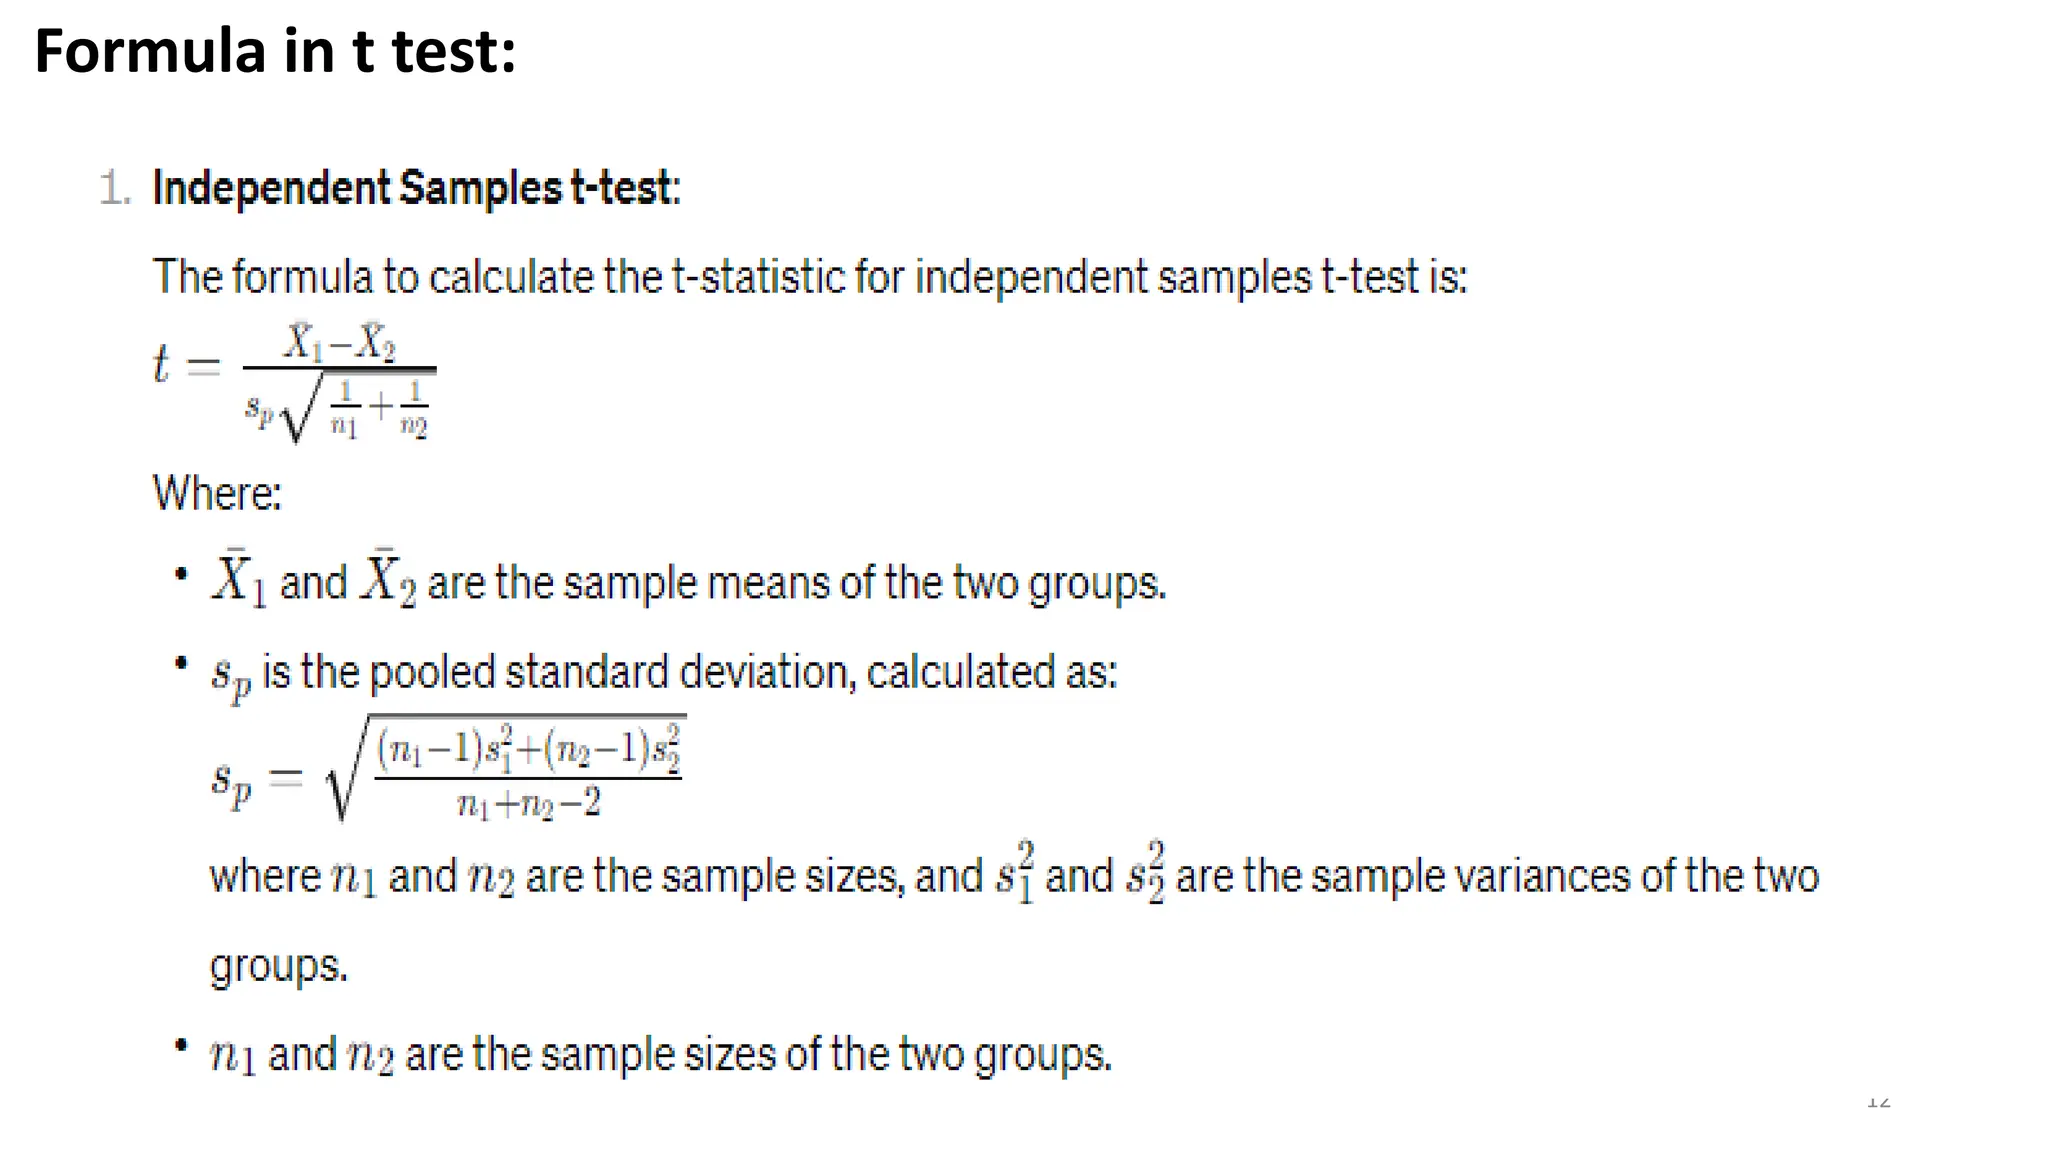
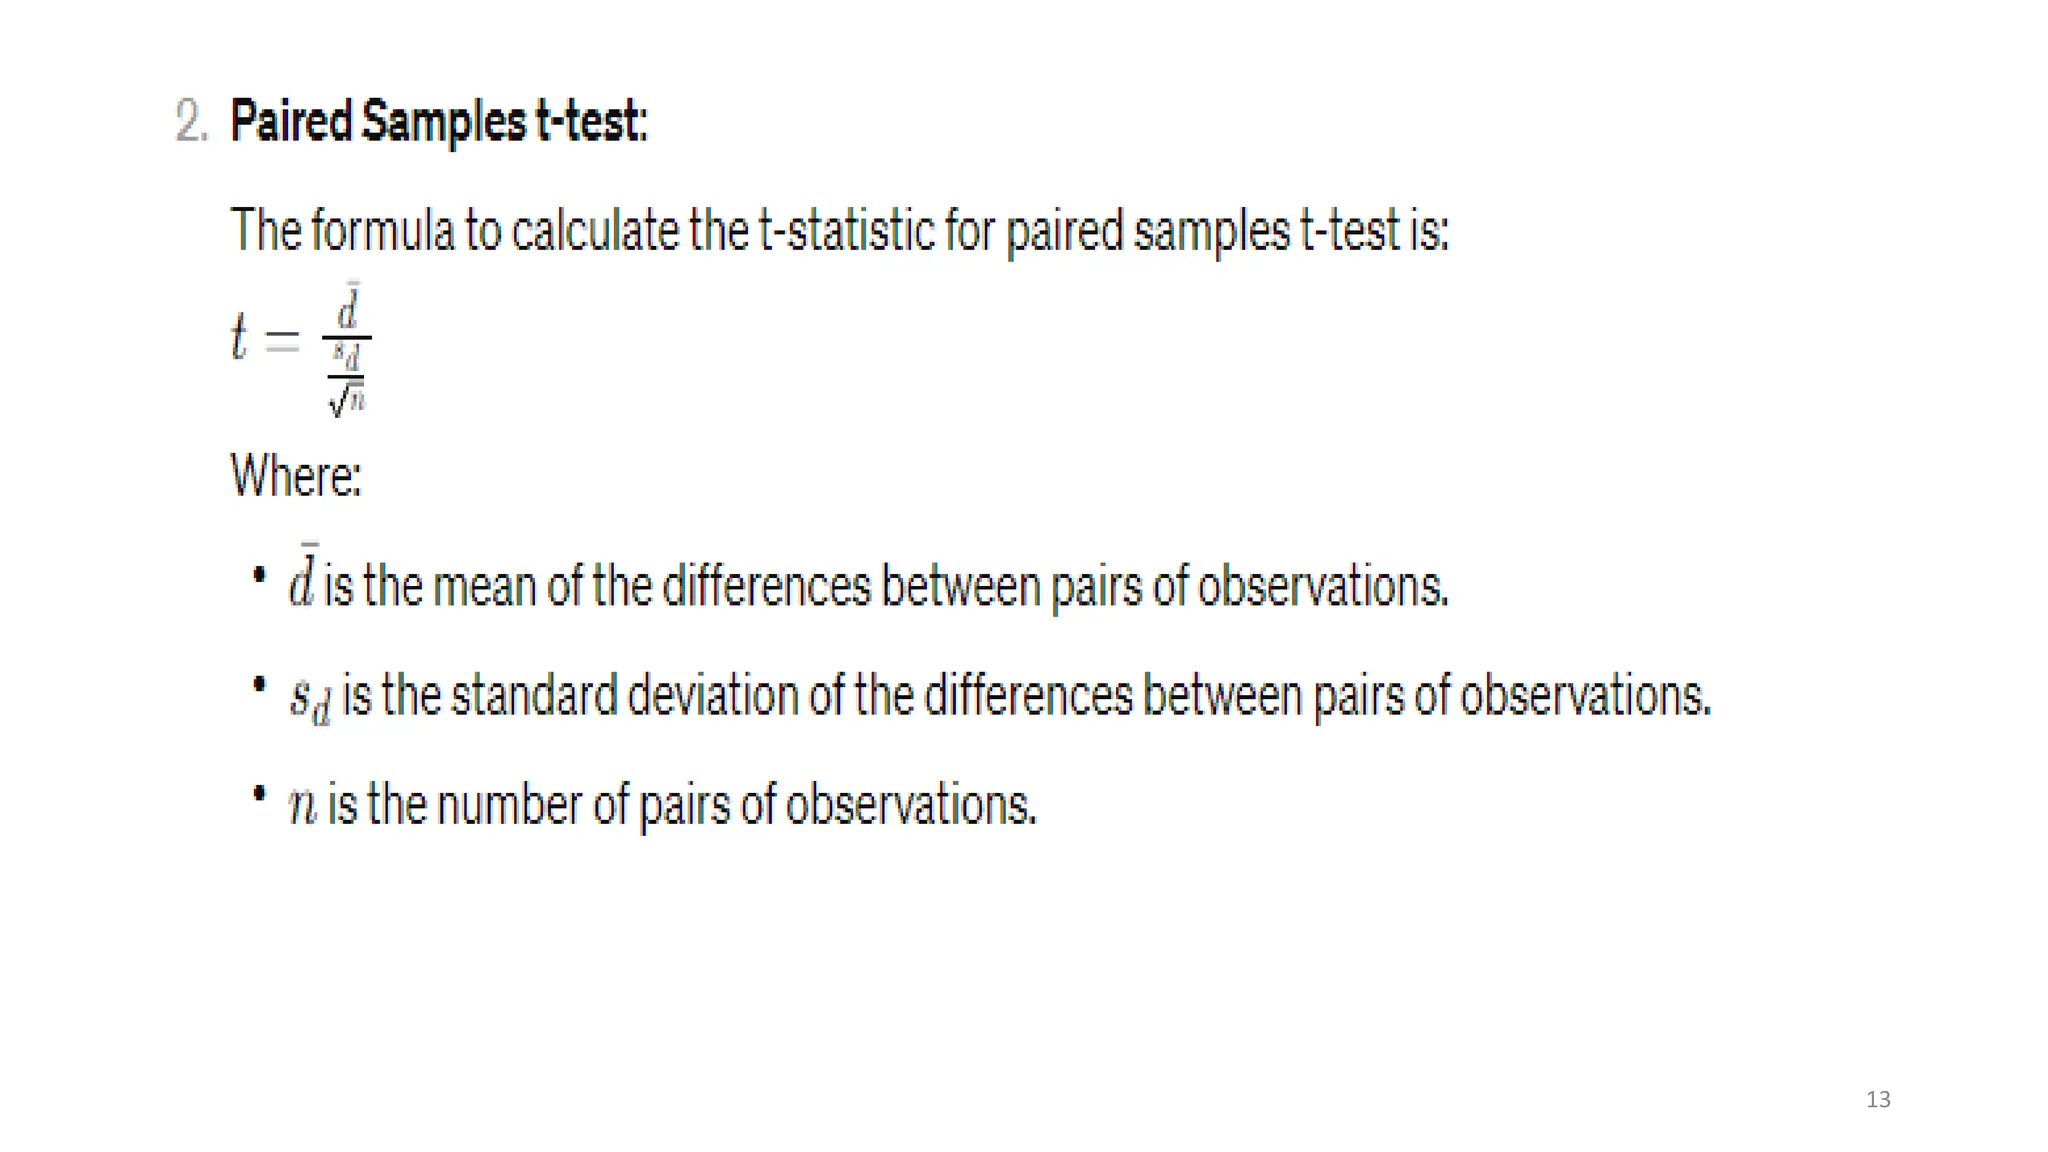
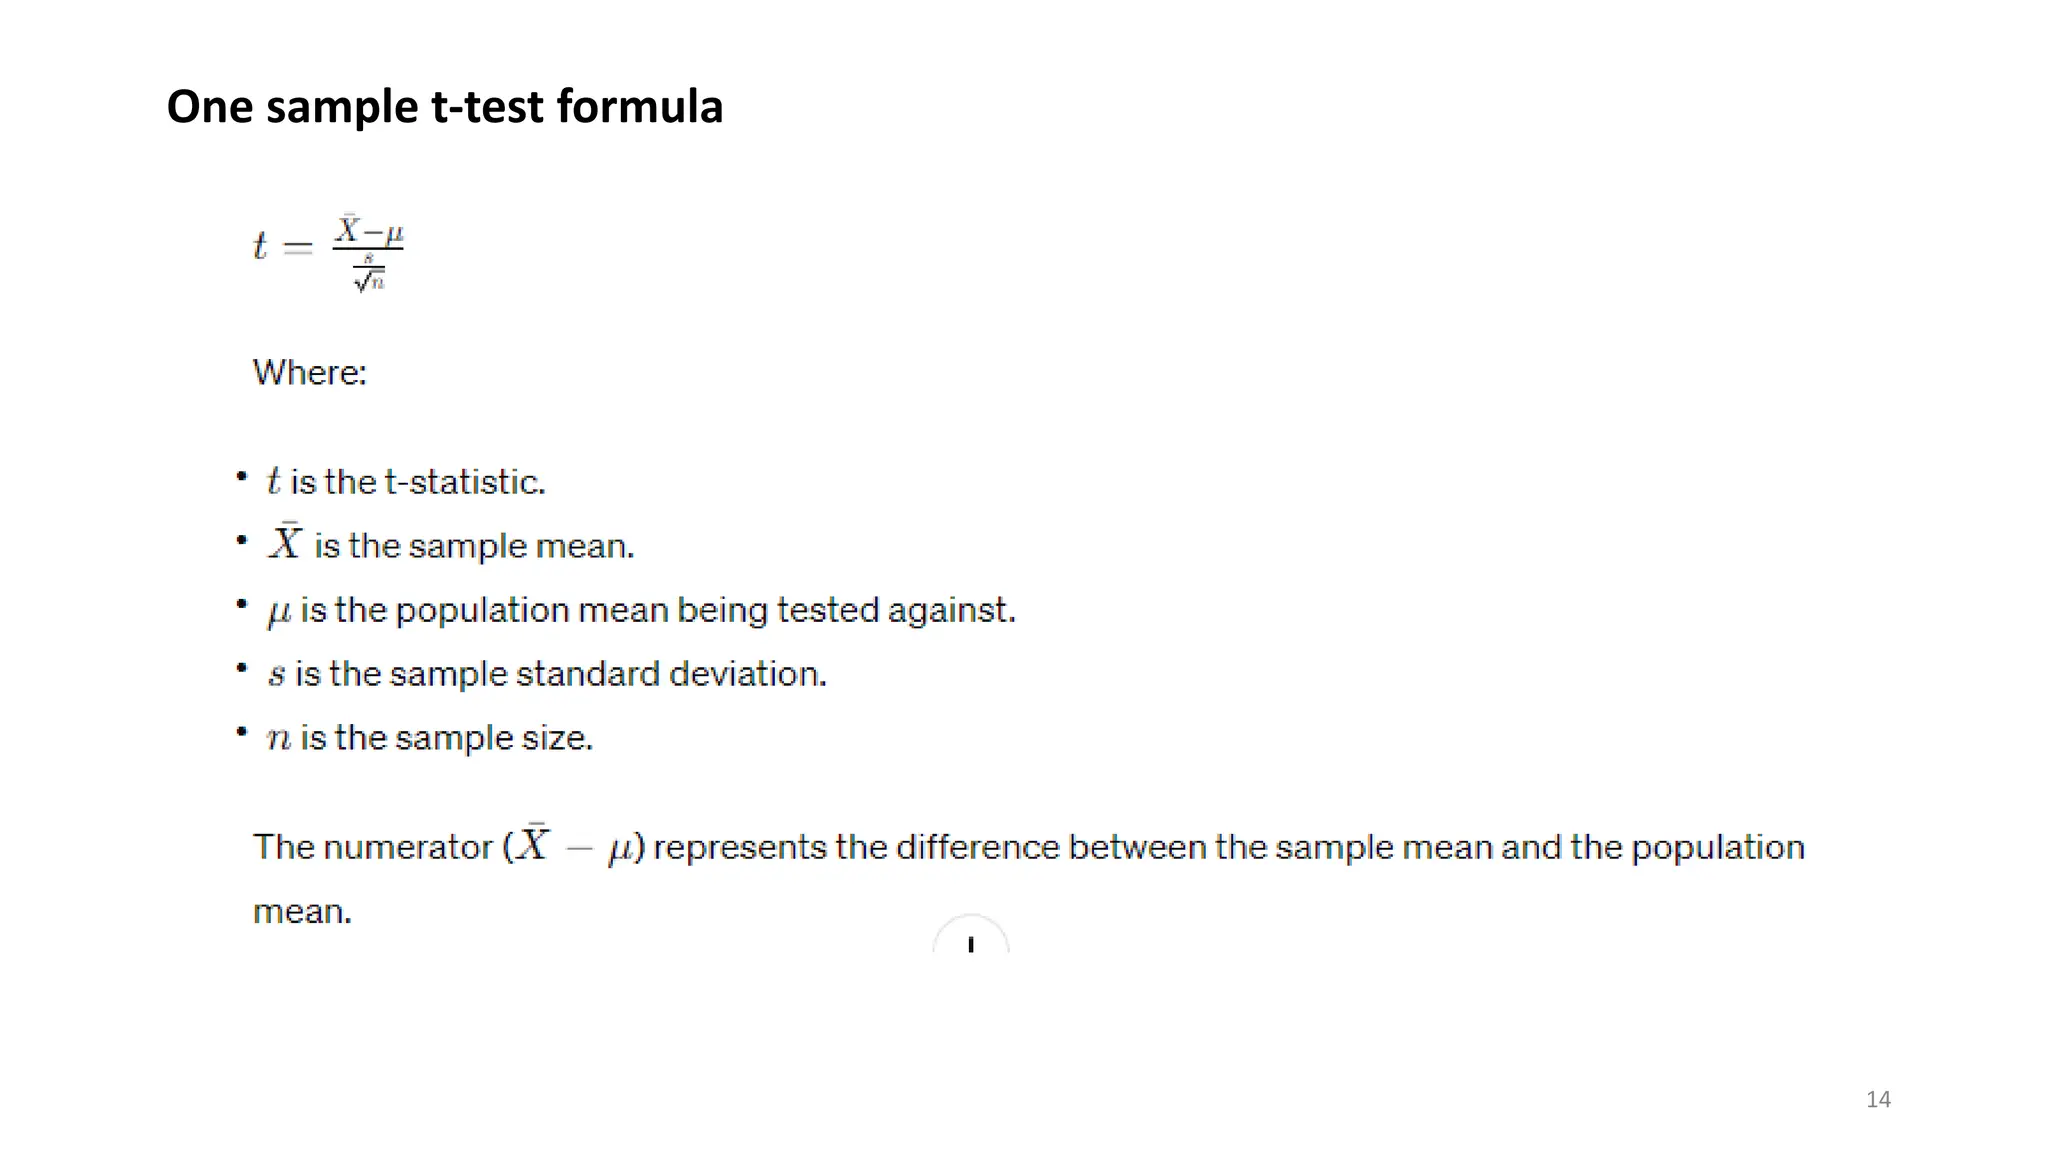
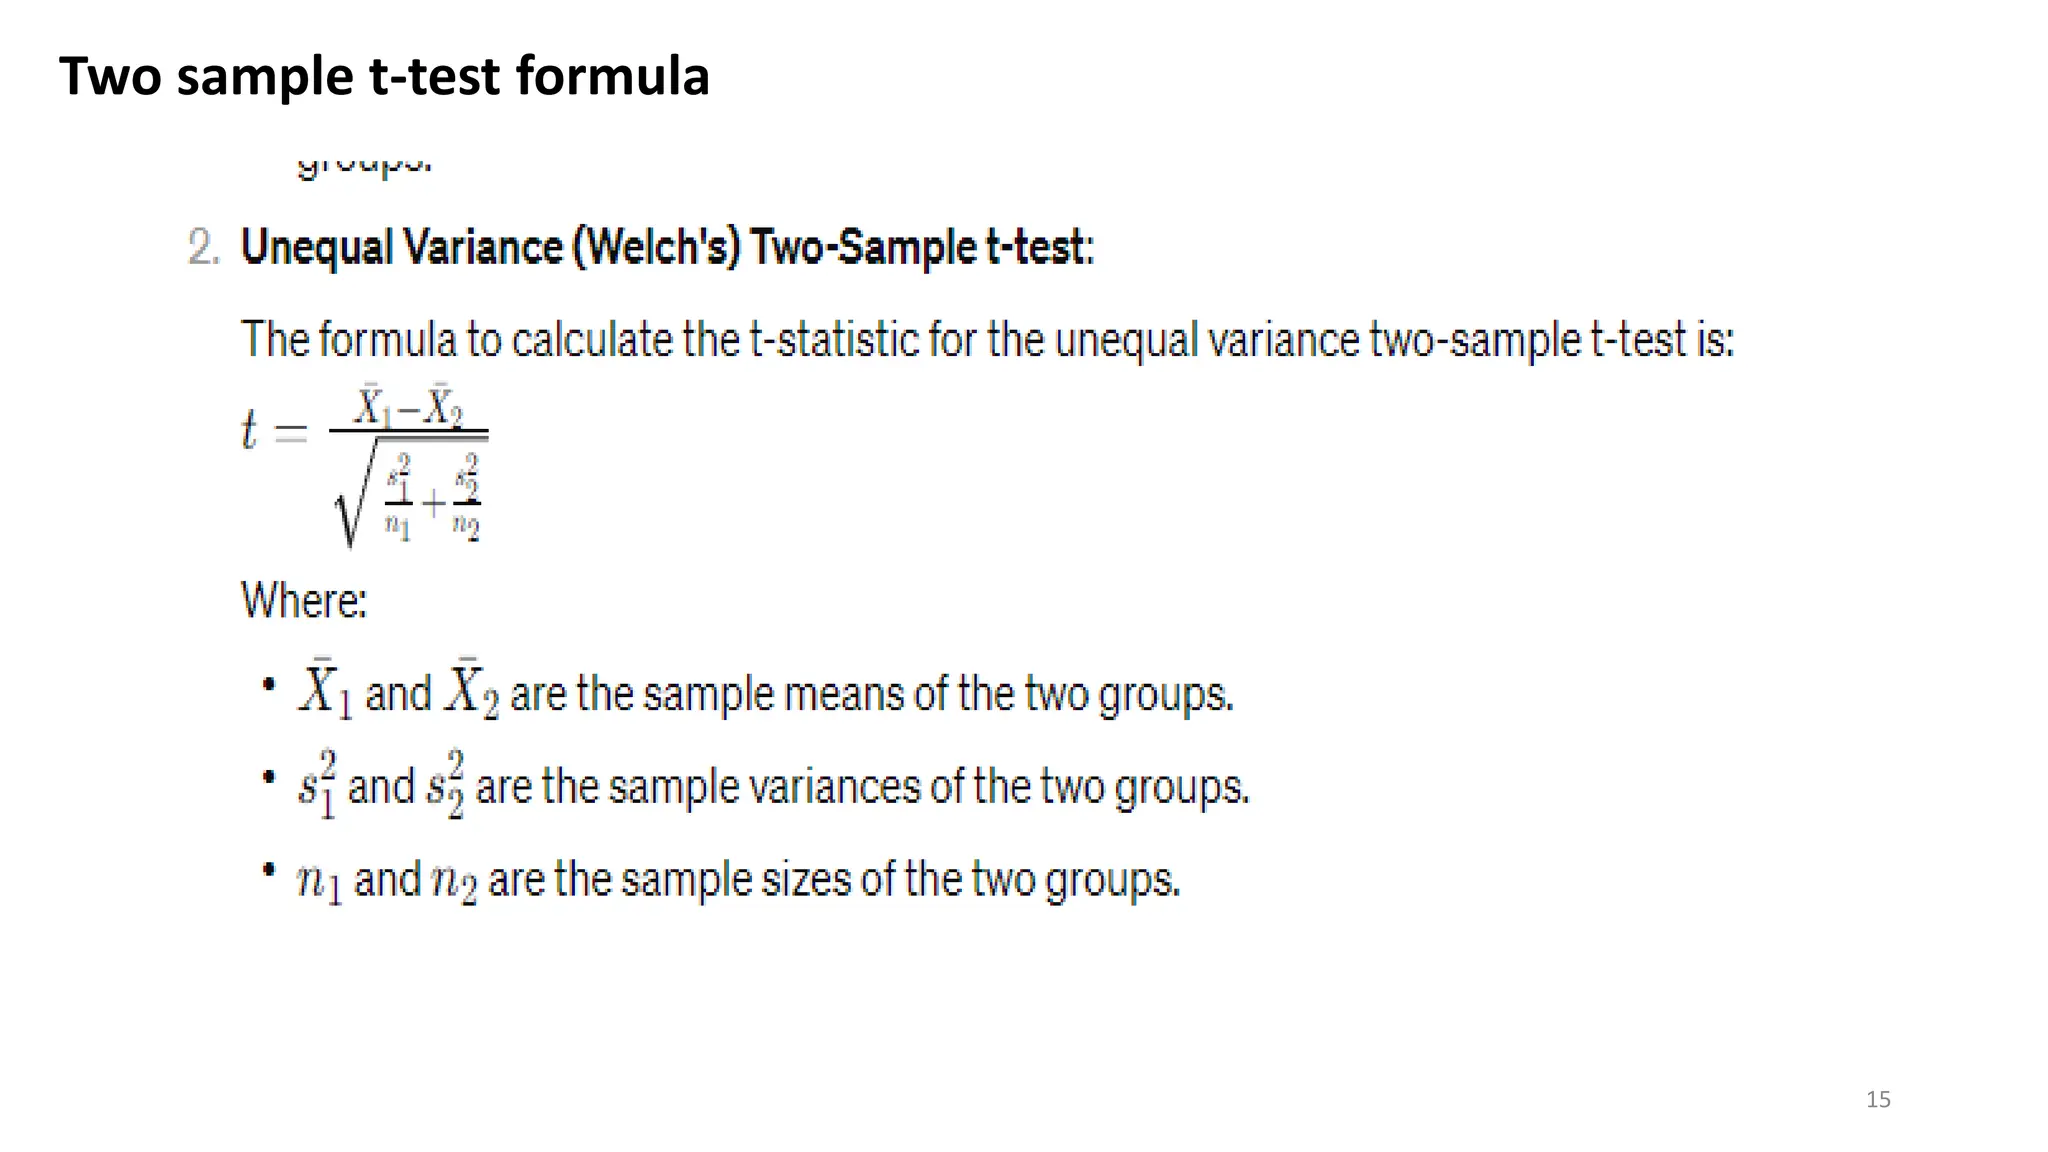
2) There are several types of t-tests that are used to compare means, including independent samples t-tests, paired samples t-tests, and one-sample t-tests. The t-test calculates a t-value to determine if there is a significant difference between group means.
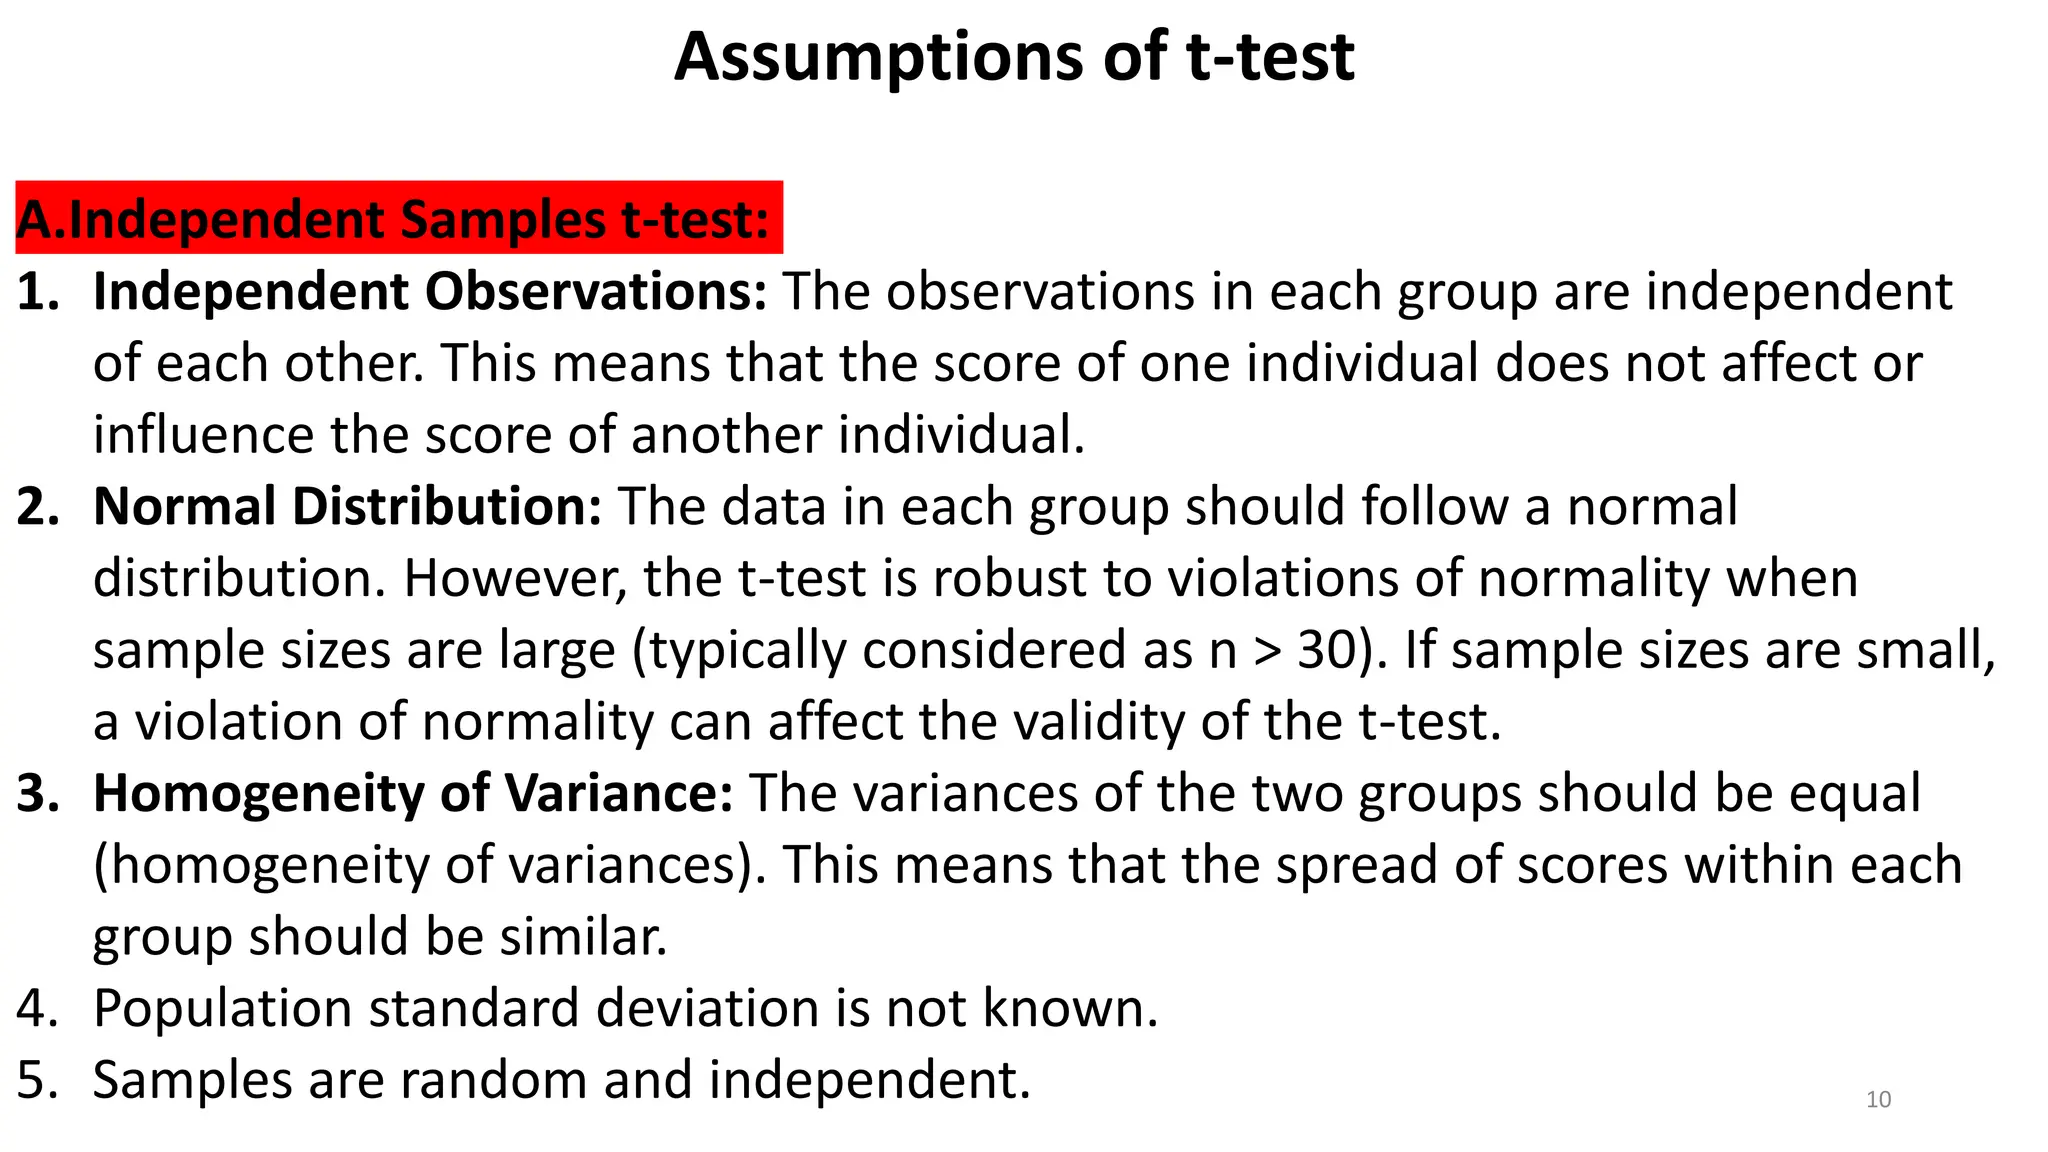
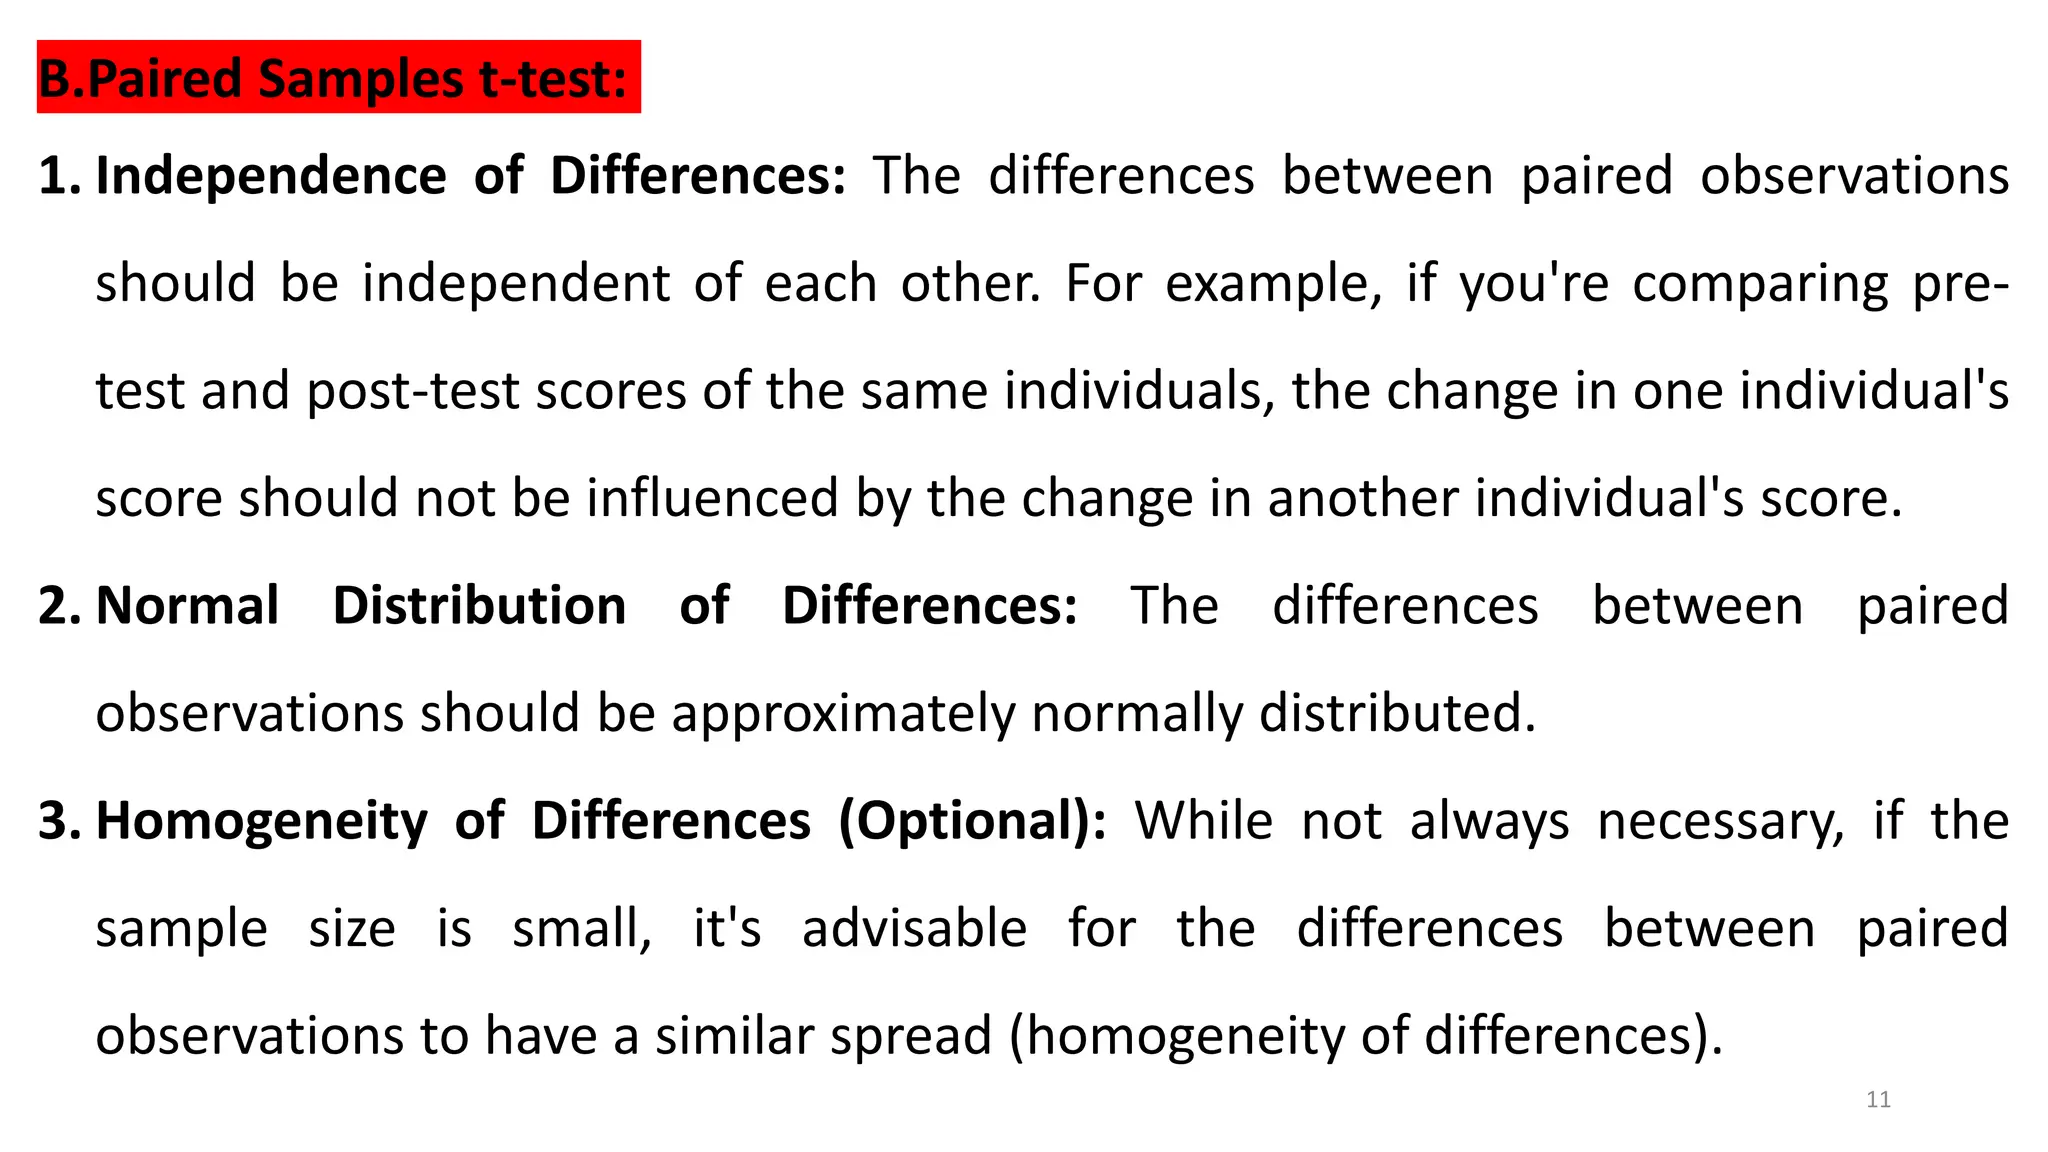
3) The assumptions of the independent samples t-test include independent observations, normally distributed data, equal variances between groups, and random sampling. The paired t-test assumes independence of differences and a normal distribution of differences.