Download to read offline

![Introduction
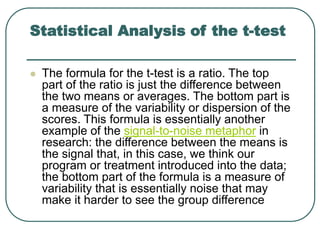
"Student" (real name: W. S. Gossett [1876-1937])
developed statistical methods to solve problems
stemming from his employment in a brewery.
Student's t-test deals with the problems associated
with inference based on "small" samples: the
calculated mean and standard deviation may by
chance deviate from the "real" mean and standard
deviation (i.e., what you'd measure if you had many
more data items: a "large" sample).](https://image.slidesharecdn.com/studentsttest-230103081647-c51d442e/85/students_t_test-ppt-3-320.jpg)
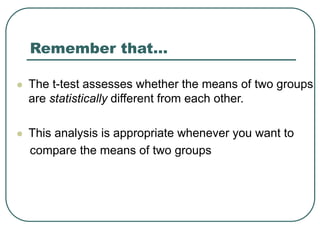
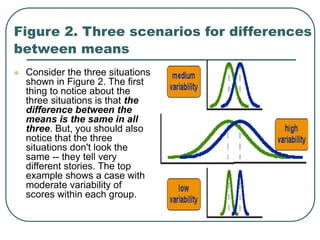

Student's t-test is used to determine if two population means are statistically different based on random samples from those populations. It calculates a ratio of the difference between sample means to the variability within each sample. If the t-value is large enough based on the sample sizes and pre-set significance level (often 0.05), then the population means are considered statistically different. The t-test is commonly used to compare outcomes before and after an intervention or between treated and control groups.