Downloaded 636 times

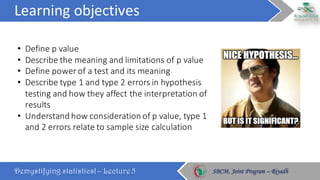
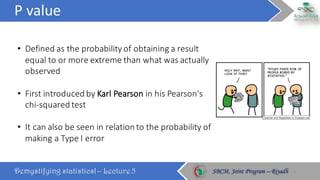
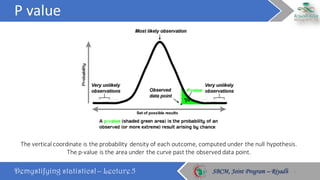
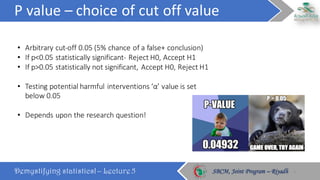

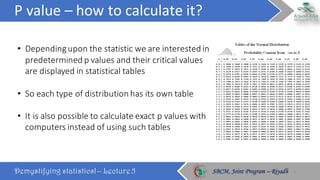
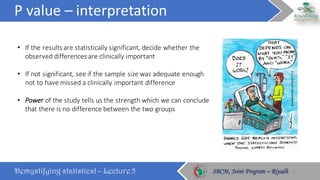

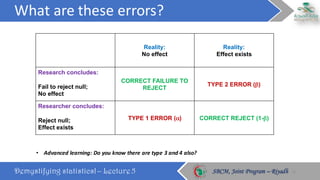
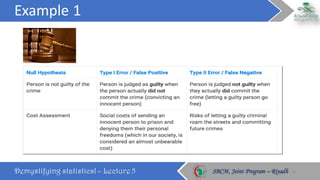

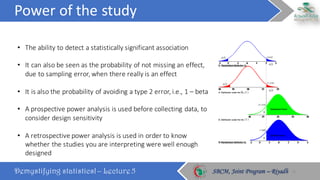
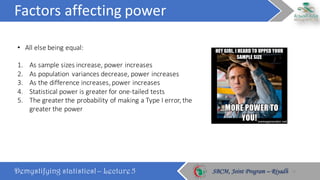

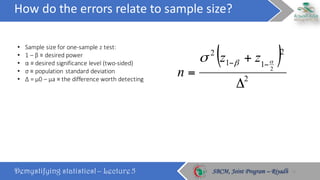
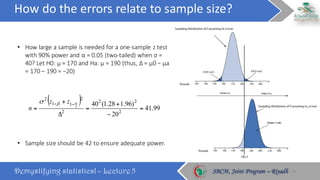
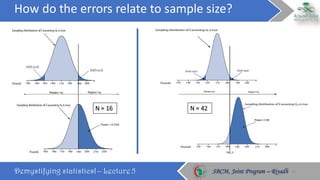


This document discusses key statistical concepts including p-values, type I and II errors, power, and sample size. It defines p-value as the probability of obtaining results as extreme or more extreme than what was observed. Type I error is rejecting the null hypothesis when it is true, while type II error is failing to reject the null when it is false. Power is the probability of avoiding a type II error. The relationships between these concepts and how factors like sample size and effect size influence them are explained. Sample size calculations must consider the desired power, significance level, population variability, and minimum effect size to detect.


