Downloaded 329 times
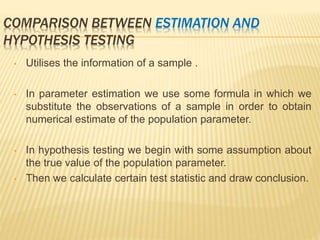

This document discusses statistical inference, which involves drawing conclusions about an unknown population based on a sample. There are two main types of statistical inference: parameter estimation and hypothesis testing. Parameter estimation involves obtaining numerical values of population parameters from a sample, like estimating the percentage of people aware of a product. Hypothesis testing involves making judgments about assumptions regarding population parameters based on sample data. The document also discusses point estimation, interval estimation, standard error, and provides examples of calculating confidence intervals.


![Distribution channel &_physical_distribution.pptx [repaired]](https://cdn.slidesharecdn.com/ss_thumbnails/distributionchannelphysicaldistribution-150108150528-conversion-gate01-thumbnail.jpg?width=640&height=640&fit=bounds)


