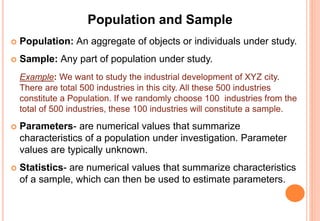
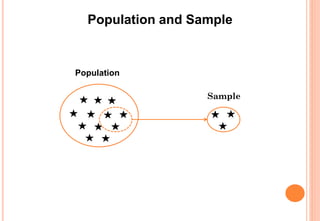
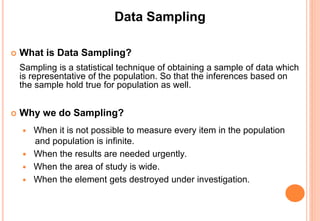
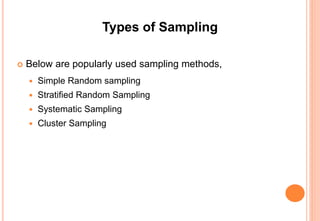
Introduction to Statistics
(Part - I)
Seema Shelke
Learning Objectives
 Definition of Statistics
 Importance of Statistics
 Applications of Statistics
 Branches of Statistics
 Population and Sample
 Data Sampling
 Types of Sampling
 Types of Data
 Scales of Measurements
 Collection of Data
Definition of Statistics
 Statistics is a branch of science which deals with collection,
presentation, analysis and interpretation of data.
 It provides methods for analyzing and assessing the
significance of data.
 Statistics enables the transformation of data into information
that can then serve as the basis for decision-making.
Importance of Statistics
 Presents facts and figures in a definite form.
 Helps to condense the data.
 Gives idea about the shape ,spread and symmetry of the data.
 Facilitates comparison.
 Measures the relationship between two or more variables.
 Helps in estimation and prediction.
 Helps in formulating and testing the hypothesis or a new
theory.
 Helps in planning, controlling and decision making.
Applications of Statistics
 Statistical methods are used in almost all fields at several
phases. Some of the fields are listed below.
• Business and Industry
• Agriculture
• Commerce
• Demography
• Economics
• Education
• Social Sciences
• Biological Sciences
• Medical Sciences
Branches of Statistics
 There are two main branches of Statistics,
1. Descriptive Statistics:
• Organizes, describes and summarizes the characteristics of
data.
• It includes construction of graphs, charts ,tables and the
calculation of various numeric measures such as mean,
median, standard deviation, percentiles, etc.
• It does not involve generalizing beyond the data at hand.
Examples: a batsman wants to find his batting average for the
past 12 months , a politician wants to know the average
number of votes he received in the past 3 years ,average daily
temperature of a Pune city.
Branches of Statistics
2. Inferential Statistics
• Concerns with drawing conclusions or predictions about a
population from the analysis of a random sample drawn from
that population.
• It includes methods like,
• Point estimation
• Interval estimation
• Hypothesis testing
Examples: a politician would like to estimate based on pre-
election polling techniques such as opinion polls; his chance for
winning in the upcoming election, researcher wants to
determine if treatment A is better than treatment B.
Population and Sample
 Population: An aggregate of objects or individuals under study.
 Sample: Any part of population under study.
Example: We want to study the industrial development of XYZ city.
There are total 500 industries in this city. All these 500 industries
constitute a Population. If we randomly choose 100 industries from the
total of 500 industries, these 100 industries will constitute a sample.
 Parameters- are numerical values that summarize
characteristics of a population under investigation. Parameter
values are typically unknown.
 Statistics- are numerical values that summarize characteristics
of a sample, which can then be used to estimate parameters.
Population and Sample
Population
Sample
Data Sampling
 What is Data Sampling?
Sampling is a statistical technique of obtaining a sample of data which
is representative of the population. So that the inferences based on
the sample hold true for population as well.
 Why we do Sampling?
 When it is not possible to measure every item in the population
and population is infinite.
 When the results are needed urgently.
 When the area of study is wide.
 When the element gets destroyed under investigation.
Benefits of Sampling
 Sampling reduces processing time. Results can be obtained
quickly due to time saved in data collection and further analysis.
 Reduces expenses incurred in collection of data and its
analysis, thus sampling is economical.
 Due to reduced volume of work ,data collection and analysis
can be completed efficiently using well trained staff and
sophisticated machinery .Thus it increases accuracy of results.
Key concepts used in Sampling
 Sampling Units: Members or elements of population.
 Sample Size: The number of units in a sample.
 Sampling Frame: A list of all members or elements of
population.
Types of Sampling
 Below are popularly used sampling methods,
 Simple Random sampling
 Stratified Random Sampling
 Systematic Sampling
 Cluster Sampling
Simple Random Sampling
 Each element of a population has an equal chance of being
selected in the sample.
 Simple random samples are obtained either by sampling with
replacement or by sampling without replacement.
 Sampling with replacement : a population element can be
selected more than one time.
 Sampling without replacement: a population element can be
selected only one time.
Simple Random Sampling
 Generally, the simple random sampling is conducted without
replacement because it is more convenient and gives more
precise results.
 Simple random sampling is effective if population is
homogenous i.e. population has no differentiated sections or
classes.
Example: In order to conduct a socio-economic survey of a
particular village, we can randomly select a sample of families
and find per capita income of a village.
Simple Random Sampling
Population Sample
Stratified Random Sampling
 In this method ,the entire population is divided into different non
overlapping homogenous groups called as strata and then a
simple random sample of a suitable size is selected from each
stratum to form a sample.
 The strata are divided according to some criterion such as
geographic location, age, gender, religion or income.
Example: To estimate annual income per family we divide the
population into homogenous groups such as families with
yearly income below Rs. 50,000; between Rs. 50,000 - Rs.1
lakh;between Rs. 1 lakh – Rs. 1.5 lakh and above Rs. 1.5 lakh.
Then we use stratified random sampling taking above groups
as strata.
Stratified Random Sampling
Population
Sample
Stratum
No.1
Stratum
No.2
Stratum
No.k
Systematic Sampling
 This method involves the selection of elements from an
ordered sampling frame.
 To draw a systematic sample of size n,
 sampling units are numbered from 1 to N where N is the
population size.
 calculate the sampling interval k as N/n, where N is population
size and n is sample size.
 select a random number say j from 1 to k (sampling interval) and
thereafter select every kth element j+k, j+2k,etc.
 Thus systematic sample of size n will include jth ,(j+k) th,(j+2k) th
,…..,(j+(n-1))kth observations.
 Only the first unit selected at random determines the entire
sample.
Systematic Sampling
 Suppose a committee of n=6 students is to be selected from a
class of N=60 students.
To draw a systematic sample of size n = 6,
 Students are numbered from 1 to 60 using their roll numbers.
 calculate the sampling interval k = 60/6 = 10
 select a random number from 1 to 10 (sampling interval),suppose it is 5.
 If 5th student is selected ,then the systematic sample will include students
with roll numbers 5,15,25,35,45,55.
Systematic Sampling
1 2 3 4 5 6 7 8 9 10
11 12 13 14 15 16 17 18 19 20
21 22 23 24 25 26 27 28 29 30
31 32 33 34 35 36 37 38 39 40
41 42 43 44 45 46 47 48 49 50
51 52 53 54 55 56 57 58 59 60
Population
Systematic
Sample
Cluster Sampling
 This method is used when population is large and consists of
several groups. These groups are called as clusters.
 In this method, cluster is considered as sampling unit. We
select a simple random sample of clusters. All observations in
the selected clusters are included in the sample.
 Smaller the size of clusters better will be the results.
Example: In health survey of a state, state can be divided into
villages (clusters). A simple random sample of villages may be
selected first and then information about each individual in the
selected village can be collected.
Cluster Sampling
Population
(with clusters)
Sample
Types of Data
Data
Variable
Quantitative
Discrete Continuous
Qualitative
Constant
Types of Data
 Data : is any facts or observations collected together for
reference or analysis which is used as a basis for decision
making.
 Variable :
 Any characteristic which changes its values.
Examples: height, weight, sex, marital status, eye color.
 Variables can be classified as Qualitative or Quantitative.
 Constant:
 A characteristic which does not changes its value or nature.
Example: height of a person after 25 years of age.
Types of Data
 Qualitative Data:
 It is non numerical data that can be arranged into categories.
 This data is also called as Categorical data.
Examples: gender of an individual, nationality of a player ,grade in
examination.
 Quantitative Data :
 It is a numerical data that consists of counts or measurements.
Examples: weight of person, examination marks, profit of a
salesman.
Quantitative Data
 Quantitative data can further be classified as discrete and
continuous data .
 Discrete Data: takes on only a finite or countable number of
values. These are usually whole numbers.
Examples: population of a country, number of cases of certain
disease, number of student in a class.
 Continuous Data: takes all possible values in a certain range and
thus have an infinite number of values. This data does not contain
any gaps, breaks or jumps.
Examples: height of a person, temperature at a certain place,
agricultural production.
Scales of Measurement
 Variables can also be classified based on its scales of
measurements.
 Steven S.S introduced four types of scales of measurements:
nominal, ordinal, interval and ratio scales.
 There are two scales of measurement for categorical
variables: nominal and ordinal.
 There are two scales of measurement for quantitative
variables: interval and ratio.
Scales of Measurement
 Nominal Scale:
 Consist of two or more named categories into which objects are
classified
 Data at this level can't be ordered in a meaningful way.
Examples: Classification of individual using blood group,
Classification of individual using sex, caste, nationality.
 Ordinal Scale:
 Similar to nominal scale ,however data at this level can be
ordered in a meaningful way, but differences between data values
either can not be determined or are meaningless.
Examples: Groups of individuals according to income such as
poor, middle class, rich., Groups of students according to grades
in examination such as fail, second class, first class, first class
with distinction.
Scales of Measurement
 Interval Scale:
 Data from an interval scale can be rank-ordered and has a
sensible spacing of observations such that differences between
measurements are meaningful.
 Interval scales lack the ability to calculate ratios between numbers
on the scale because there is no true zero point.
Example: Temperature on the Fahrenheit and Celsius scales.
 Ratio Scale:
 Data on a ratio scale includes all of the features of interval scale ,in
addition to a true zero point and can therefore accurately indicate
the ratio of difference between two spaces on the measurement
scale.
 It is the best scale of measurement and used in almost all places.
Examples: monthly income, height in cm, weight in kg.
Collection of Data
There are two types of data according to the method of collection;
 Primary Data:
 This is the original data collected by investigator himself/herself for
a specific purpose.
 This type of data are generally a fresh and collected for the first
time.
 This data can be collected by below methods,
• Observation Method
• Interview Method
• Survey method
• Questionnaire method
Examples: Population census, Data collected by a researcher for
his/her project.
Collection of Data
 Secondary Data:
 Data collected by someone else prior to and for a purpose other
than the current project.
 This is processed or finished data.
 Secondary data is data that is being reused.
 It involves less cost, time and effort.
Examples: Data taken from sources like office records, reports
which are already collected by some other agency, Data available
on Internet ,Data from books, Data from magazines.
 Note: Data which are primary for one may be secondary for the
other.
Thank You!

Introduction to Statistics (Part -I)

  • 1.
  • 2.
    Learning Objectives  Definitionof Statistics  Importance of Statistics  Applications of Statistics  Branches of Statistics  Population and Sample  Data Sampling  Types of Sampling  Types of Data  Scales of Measurements  Collection of Data
  • 3.
    Definition of Statistics Statistics is a branch of science which deals with collection, presentation, analysis and interpretation of data.  It provides methods for analyzing and assessing the significance of data.  Statistics enables the transformation of data into information that can then serve as the basis for decision-making.
  • 4.
    Importance of Statistics Presents facts and figures in a definite form.  Helps to condense the data.  Gives idea about the shape ,spread and symmetry of the data.  Facilitates comparison.  Measures the relationship between two or more variables.  Helps in estimation and prediction.  Helps in formulating and testing the hypothesis or a new theory.  Helps in planning, controlling and decision making.
  • 5.
    Applications of Statistics Statistical methods are used in almost all fields at several phases. Some of the fields are listed below. • Business and Industry • Agriculture • Commerce • Demography • Economics • Education • Social Sciences • Biological Sciences • Medical Sciences
  • 6.
    Branches of Statistics There are two main branches of Statistics, 1. Descriptive Statistics: • Organizes, describes and summarizes the characteristics of data. • It includes construction of graphs, charts ,tables and the calculation of various numeric measures such as mean, median, standard deviation, percentiles, etc. • It does not involve generalizing beyond the data at hand. Examples: a batsman wants to find his batting average for the past 12 months , a politician wants to know the average number of votes he received in the past 3 years ,average daily temperature of a Pune city.
  • 7.
    Branches of Statistics 2.Inferential Statistics • Concerns with drawing conclusions or predictions about a population from the analysis of a random sample drawn from that population. • It includes methods like, • Point estimation • Interval estimation • Hypothesis testing Examples: a politician would like to estimate based on pre- election polling techniques such as opinion polls; his chance for winning in the upcoming election, researcher wants to determine if treatment A is better than treatment B.
  • 8.
    Population and Sample Population: An aggregate of objects or individuals under study.  Sample: Any part of population under study. Example: We want to study the industrial development of XYZ city. There are total 500 industries in this city. All these 500 industries constitute a Population. If we randomly choose 100 industries from the total of 500 industries, these 100 industries will constitute a sample.  Parameters- are numerical values that summarize characteristics of a population under investigation. Parameter values are typically unknown.  Statistics- are numerical values that summarize characteristics of a sample, which can then be used to estimate parameters.
  • 9.
  • 10.
    Data Sampling  Whatis Data Sampling? Sampling is a statistical technique of obtaining a sample of data which is representative of the population. So that the inferences based on the sample hold true for population as well.  Why we do Sampling?  When it is not possible to measure every item in the population and population is infinite.  When the results are needed urgently.  When the area of study is wide.  When the element gets destroyed under investigation.
  • 11.
    Benefits of Sampling Sampling reduces processing time. Results can be obtained quickly due to time saved in data collection and further analysis.  Reduces expenses incurred in collection of data and its analysis, thus sampling is economical.  Due to reduced volume of work ,data collection and analysis can be completed efficiently using well trained staff and sophisticated machinery .Thus it increases accuracy of results.
  • 12.
    Key concepts usedin Sampling  Sampling Units: Members or elements of population.  Sample Size: The number of units in a sample.  Sampling Frame: A list of all members or elements of population.
  • 13.
    Types of Sampling Below are popularly used sampling methods,  Simple Random sampling  Stratified Random Sampling  Systematic Sampling  Cluster Sampling
  • 14.
    Simple Random Sampling Each element of a population has an equal chance of being selected in the sample.  Simple random samples are obtained either by sampling with replacement or by sampling without replacement.  Sampling with replacement : a population element can be selected more than one time.  Sampling without replacement: a population element can be selected only one time.
  • 15.
    Simple Random Sampling Generally, the simple random sampling is conducted without replacement because it is more convenient and gives more precise results.  Simple random sampling is effective if population is homogenous i.e. population has no differentiated sections or classes. Example: In order to conduct a socio-economic survey of a particular village, we can randomly select a sample of families and find per capita income of a village.
  • 16.
  • 17.
    Stratified Random Sampling In this method ,the entire population is divided into different non overlapping homogenous groups called as strata and then a simple random sample of a suitable size is selected from each stratum to form a sample.  The strata are divided according to some criterion such as geographic location, age, gender, religion or income. Example: To estimate annual income per family we divide the population into homogenous groups such as families with yearly income below Rs. 50,000; between Rs. 50,000 - Rs.1 lakh;between Rs. 1 lakh – Rs. 1.5 lakh and above Rs. 1.5 lakh. Then we use stratified random sampling taking above groups as strata.
  • 18.
  • 19.
    Systematic Sampling  Thismethod involves the selection of elements from an ordered sampling frame.  To draw a systematic sample of size n,  sampling units are numbered from 1 to N where N is the population size.  calculate the sampling interval k as N/n, where N is population size and n is sample size.  select a random number say j from 1 to k (sampling interval) and thereafter select every kth element j+k, j+2k,etc.  Thus systematic sample of size n will include jth ,(j+k) th,(j+2k) th ,…..,(j+(n-1))kth observations.  Only the first unit selected at random determines the entire sample.
  • 20.
    Systematic Sampling  Supposea committee of n=6 students is to be selected from a class of N=60 students. To draw a systematic sample of size n = 6,  Students are numbered from 1 to 60 using their roll numbers.  calculate the sampling interval k = 60/6 = 10  select a random number from 1 to 10 (sampling interval),suppose it is 5.  If 5th student is selected ,then the systematic sample will include students with roll numbers 5,15,25,35,45,55.
  • 21.
    Systematic Sampling 1 23 4 5 6 7 8 9 10 11 12 13 14 15 16 17 18 19 20 21 22 23 24 25 26 27 28 29 30 31 32 33 34 35 36 37 38 39 40 41 42 43 44 45 46 47 48 49 50 51 52 53 54 55 56 57 58 59 60 Population Systematic Sample
  • 22.
    Cluster Sampling  Thismethod is used when population is large and consists of several groups. These groups are called as clusters.  In this method, cluster is considered as sampling unit. We select a simple random sample of clusters. All observations in the selected clusters are included in the sample.  Smaller the size of clusters better will be the results. Example: In health survey of a state, state can be divided into villages (clusters). A simple random sample of villages may be selected first and then information about each individual in the selected village can be collected.
  • 23.
  • 24.
  • 25.
    Types of Data Data : is any facts or observations collected together for reference or analysis which is used as a basis for decision making.  Variable :  Any characteristic which changes its values. Examples: height, weight, sex, marital status, eye color.  Variables can be classified as Qualitative or Quantitative.  Constant:  A characteristic which does not changes its value or nature. Example: height of a person after 25 years of age.
  • 26.
    Types of Data Qualitative Data:  It is non numerical data that can be arranged into categories.  This data is also called as Categorical data. Examples: gender of an individual, nationality of a player ,grade in examination.  Quantitative Data :  It is a numerical data that consists of counts or measurements. Examples: weight of person, examination marks, profit of a salesman.
  • 27.
    Quantitative Data  Quantitativedata can further be classified as discrete and continuous data .  Discrete Data: takes on only a finite or countable number of values. These are usually whole numbers. Examples: population of a country, number of cases of certain disease, number of student in a class.  Continuous Data: takes all possible values in a certain range and thus have an infinite number of values. This data does not contain any gaps, breaks or jumps. Examples: height of a person, temperature at a certain place, agricultural production.
  • 28.
    Scales of Measurement Variables can also be classified based on its scales of measurements.  Steven S.S introduced four types of scales of measurements: nominal, ordinal, interval and ratio scales.  There are two scales of measurement for categorical variables: nominal and ordinal.  There are two scales of measurement for quantitative variables: interval and ratio.
  • 29.
    Scales of Measurement Nominal Scale:  Consist of two or more named categories into which objects are classified  Data at this level can't be ordered in a meaningful way. Examples: Classification of individual using blood group, Classification of individual using sex, caste, nationality.  Ordinal Scale:  Similar to nominal scale ,however data at this level can be ordered in a meaningful way, but differences between data values either can not be determined or are meaningless. Examples: Groups of individuals according to income such as poor, middle class, rich., Groups of students according to grades in examination such as fail, second class, first class, first class with distinction.
  • 30.
    Scales of Measurement Interval Scale:  Data from an interval scale can be rank-ordered and has a sensible spacing of observations such that differences between measurements are meaningful.  Interval scales lack the ability to calculate ratios between numbers on the scale because there is no true zero point. Example: Temperature on the Fahrenheit and Celsius scales.  Ratio Scale:  Data on a ratio scale includes all of the features of interval scale ,in addition to a true zero point and can therefore accurately indicate the ratio of difference between two spaces on the measurement scale.  It is the best scale of measurement and used in almost all places. Examples: monthly income, height in cm, weight in kg.
  • 31.
    Collection of Data Thereare two types of data according to the method of collection;  Primary Data:  This is the original data collected by investigator himself/herself for a specific purpose.  This type of data are generally a fresh and collected for the first time.  This data can be collected by below methods, • Observation Method • Interview Method • Survey method • Questionnaire method Examples: Population census, Data collected by a researcher for his/her project.
  • 32.
    Collection of Data Secondary Data:  Data collected by someone else prior to and for a purpose other than the current project.  This is processed or finished data.  Secondary data is data that is being reused.  It involves less cost, time and effort. Examples: Data taken from sources like office records, reports which are already collected by some other agency, Data available on Internet ,Data from books, Data from magazines.  Note: Data which are primary for one may be secondary for the other.
  • 33.