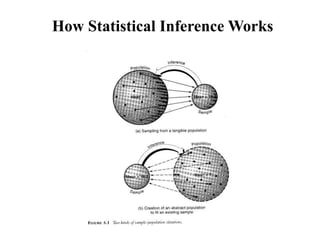
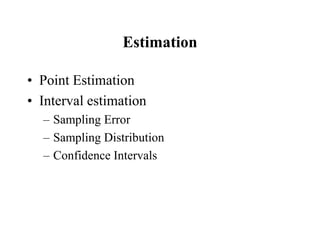
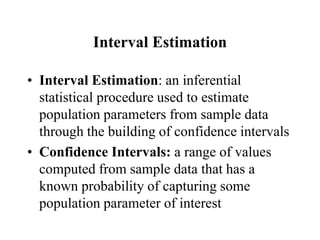
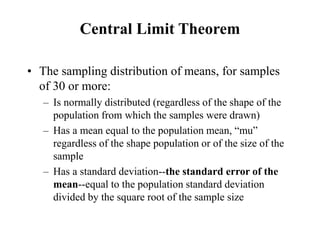
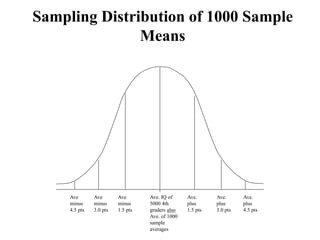
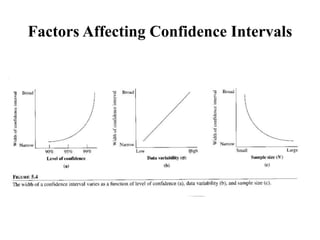
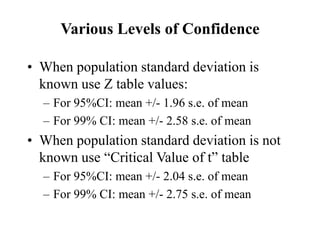
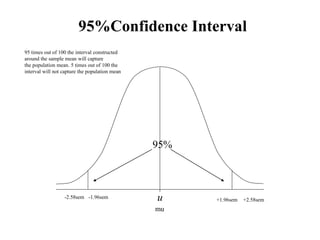
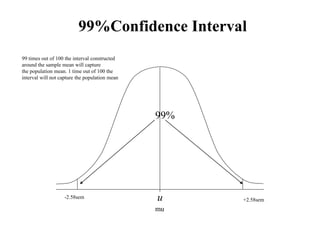
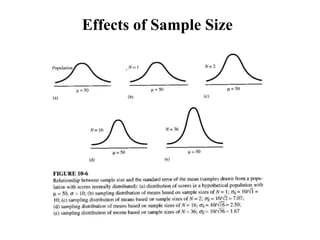
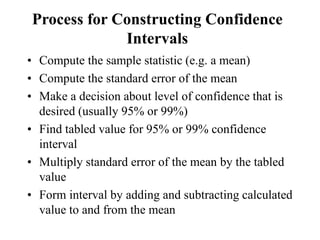
Topics: Inferential Statistics
• Inference
• Terminology
• Central Limit Theorem
• Estimation
– Point Estimation
– Confidence Intervals
• Hypothesis Testing
Inferential Statistics
• Research is about trying to make valid
inferences
• Inferential statistics: the part of statistics
that allows researchers to generalize their
findings beyond data collected.
• Statistical inference: a procedure for
making inferences or generalizations about
a larger population from a sample of that
population
How Statistical Inference Works
Basic Terminology
• Population: any collection of entities that
have at least one characteristic in common
• Parameter: the numbers that describe
characteristics of scores in the population
(mean, variance, s.d., etc.)
Basic Terminology (cont’d)
• Sample: a part of the population
• Statistic: the numbers that describe
characteristics of scores in the sample
(mean, variance, s.d., correlation
coefficient, reliability coefficient, etc.)
Basic Statistical Symbols
Basic Terminology (con’t)
• Estimate: a number computed by using the
data collected from a sample
• Estimator: formula used to compute an
estimate
The Process of Estimation
Types of Samples
• Probability
– Simple Random Samples
– Simple Stratified Samples
– Systematic Samples
– Cluster Samples
• Non Probability
– Purposive Samples
– Convenience Samples
– Quota Samples
– Snowball Samples
Limits on Inferences and Warnings
• Response Rates
• Source of data
• Sample size and sample quality
• “Random”
Estimation
• Point Estimation
• Interval estimation
– Sampling Error
– Sampling Distribution
– Confidence Intervals
Interval Estimation
• Interval Estimation: an inferential
statistical procedure used to estimate
population parameters from sample data
through the building of confidence intervals
• Confidence Intervals: a range of values
computed from sample data that has a
known probability of capturing some
population parameter of interest
Sampling Error
• Samples rarely mirror exactly the
population
• The sample statistics will almost always
contain sampling error
• The magnitude of the difference of the
sampling statistic from the population
parameter
Sampling Distribution
• Sampling Distribution: a theoretical distribution
that shows the frequency of occurrence of values
of some statistic computed for all possible samples
of size N drawn from some population.
• Sampling Distribution of the Mean: A
theoretical distribution of the frequency of
occurrence of values of the mean computed for all
possible samples of size N from a population
Sampling Distribution of Mean
Sampling Distribution of Means and
Standard Error of the Means
u
mu
+2sem
-2sem +1sem
-1sem
-3sem +3sem
Population mean
Central Limit Theorem
• The sampling distribution of means, for samples
of 30 or more:
– Is normally distributed (regardless of the shape of the
population from which the samples were drawn)
– Has a mean equal to the population mean, “mu”
regardless of the shape population or of the size of the
sample
– Has a standard deviation--the standard error of the
mean--equal to the population standard deviation
divided by the square root of the sample size
Sampling Distribution of 1000 Sample
Means
Ave. IQ of
5000 4th
graders also
Ave. of 1000
sample
averages
Ave.
plus
3.0 pts
Ave
minus
3.0 pts
Ave.
plus
1.5 pts
Ave
minus
1.5 pts
Ave
minus
4.5 pts
Ave.
plus
4.5 pts
Confidence Intervals
• A defined interval of values that includes the
statistic of interest, by adding and subtracting a
specific amount from the computed statistic
• A CI is the probability that the interval computed
from the sample data includes the population
parameter of interest
Factors Affecting Confidence Intervals
Various Levels of Confidence
• When population standard deviation is
known use Z table values:
– For 95%CI: mean +/- 1.96 s.e. of mean
– For 99% CI: mean +/- 2.58 s.e. of mean
• When population standard deviation is not
known use “Critical Value of t” table
– For 95%CI: mean +/- 2.04 s.e. of mean
– For 99% CI: mean +/- 2.75 s.e. of mean
95%Confidence Interval
u
mu
+1.96sem
-1.96sem
95%
-2.58sem
+2.58sem
95 times out of 100 the interval constructed
around the sample mean will capture
the population mean. 5 times out of 100 the
interval will not capture the population mean
99%Confidence Interval
u
mu
99%
-2.58sem
+2.58sem
99 times out of 100 the interval constructed
around the sample mean will capture
the population mean. 1 time out of 100 the
interval will not capture the population mean
Effects of Sample Size
Process for Constructing Confidence
Intervals
• Compute the sample statistic (e.g. a mean)
• Compute the standard error of the mean
• Make a decision about level of confidence that is
desired (usually 95% or 99%)
• Find tabled value for 95% or 99% confidence
interval
• Multiply standard error of the mean by the tabled
value
• Form interval by adding and subtracting calculated
value to and from the mean

week6a.ppt

  • 1.
    Topics: Inferential Statistics •Inference • Terminology • Central Limit Theorem • Estimation – Point Estimation – Confidence Intervals • Hypothesis Testing
  • 2.
    Inferential Statistics • Researchis about trying to make valid inferences • Inferential statistics: the part of statistics that allows researchers to generalize their findings beyond data collected. • Statistical inference: a procedure for making inferences or generalizations about a larger population from a sample of that population
  • 3.
  • 4.
    Basic Terminology • Population:any collection of entities that have at least one characteristic in common • Parameter: the numbers that describe characteristics of scores in the population (mean, variance, s.d., etc.)
  • 5.
    Basic Terminology (cont’d) •Sample: a part of the population • Statistic: the numbers that describe characteristics of scores in the sample (mean, variance, s.d., correlation coefficient, reliability coefficient, etc.)
  • 6.
  • 7.
    Basic Terminology (con’t) •Estimate: a number computed by using the data collected from a sample • Estimator: formula used to compute an estimate
  • 8.
    The Process ofEstimation
  • 9.
    Types of Samples •Probability – Simple Random Samples – Simple Stratified Samples – Systematic Samples – Cluster Samples • Non Probability – Purposive Samples – Convenience Samples – Quota Samples – Snowball Samples
  • 10.
    Limits on Inferencesand Warnings • Response Rates • Source of data • Sample size and sample quality • “Random”
  • 11.
    Estimation • Point Estimation •Interval estimation – Sampling Error – Sampling Distribution – Confidence Intervals
  • 12.
    Interval Estimation • IntervalEstimation: an inferential statistical procedure used to estimate population parameters from sample data through the building of confidence intervals • Confidence Intervals: a range of values computed from sample data that has a known probability of capturing some population parameter of interest
  • 13.
    Sampling Error • Samplesrarely mirror exactly the population • The sample statistics will almost always contain sampling error • The magnitude of the difference of the sampling statistic from the population parameter
  • 14.
    Sampling Distribution • SamplingDistribution: a theoretical distribution that shows the frequency of occurrence of values of some statistic computed for all possible samples of size N drawn from some population. • Sampling Distribution of the Mean: A theoretical distribution of the frequency of occurrence of values of the mean computed for all possible samples of size N from a population
  • 15.
  • 16.
    Sampling Distribution ofMeans and Standard Error of the Means u mu +2sem -2sem +1sem -1sem -3sem +3sem Population mean
  • 17.
    Central Limit Theorem •The sampling distribution of means, for samples of 30 or more: – Is normally distributed (regardless of the shape of the population from which the samples were drawn) – Has a mean equal to the population mean, “mu” regardless of the shape population or of the size of the sample – Has a standard deviation--the standard error of the mean--equal to the population standard deviation divided by the square root of the sample size
  • 18.
    Sampling Distribution of1000 Sample Means Ave. IQ of 5000 4th graders also Ave. of 1000 sample averages Ave. plus 3.0 pts Ave minus 3.0 pts Ave. plus 1.5 pts Ave minus 1.5 pts Ave minus 4.5 pts Ave. plus 4.5 pts
  • 19.
    Confidence Intervals • Adefined interval of values that includes the statistic of interest, by adding and subtracting a specific amount from the computed statistic • A CI is the probability that the interval computed from the sample data includes the population parameter of interest
  • 20.
  • 21.
    Various Levels ofConfidence • When population standard deviation is known use Z table values: – For 95%CI: mean +/- 1.96 s.e. of mean – For 99% CI: mean +/- 2.58 s.e. of mean • When population standard deviation is not known use “Critical Value of t” table – For 95%CI: mean +/- 2.04 s.e. of mean – For 99% CI: mean +/- 2.75 s.e. of mean
  • 22.
    95%Confidence Interval u mu +1.96sem -1.96sem 95% -2.58sem +2.58sem 95 timesout of 100 the interval constructed around the sample mean will capture the population mean. 5 times out of 100 the interval will not capture the population mean
  • 23.
    99%Confidence Interval u mu 99% -2.58sem +2.58sem 99 timesout of 100 the interval constructed around the sample mean will capture the population mean. 1 time out of 100 the interval will not capture the population mean
  • 24.
  • 25.
    Process for ConstructingConfidence Intervals • Compute the sample statistic (e.g. a mean) • Compute the standard error of the mean • Make a decision about level of confidence that is desired (usually 95% or 99%) • Find tabled value for 95% or 99% confidence interval • Multiply standard error of the mean by the tabled value • Form interval by adding and subtracting calculated value to and from the mean