Downloaded 1,337 times


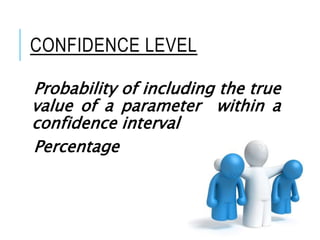
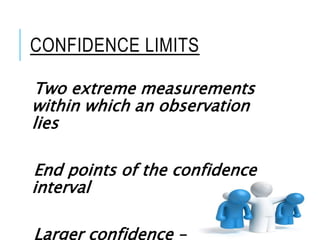
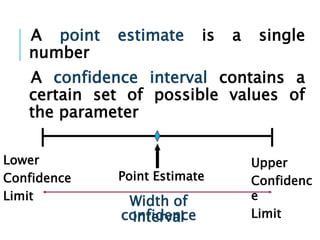

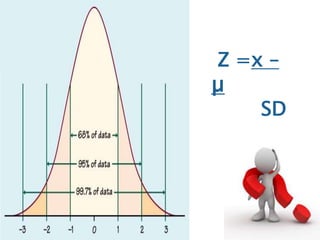
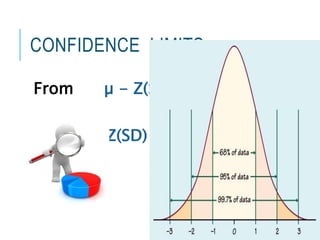
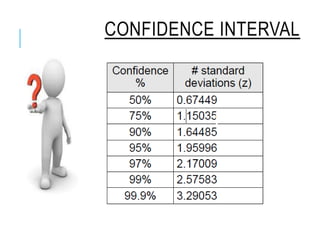
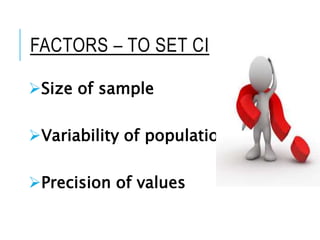

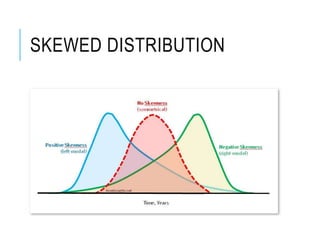
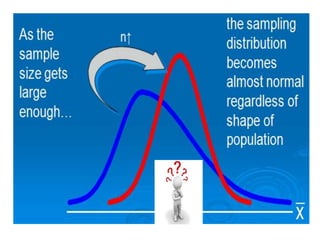

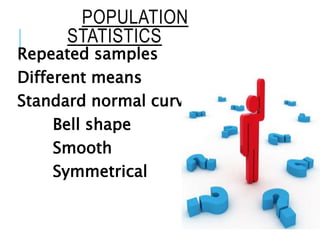
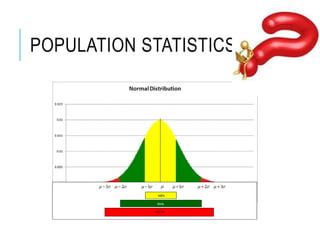
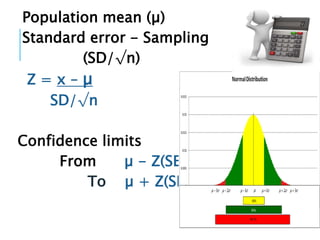
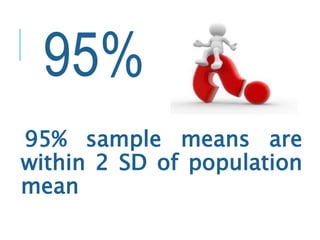
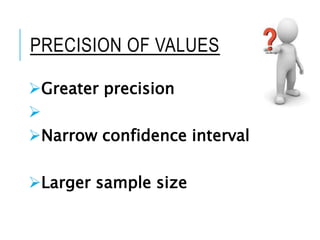
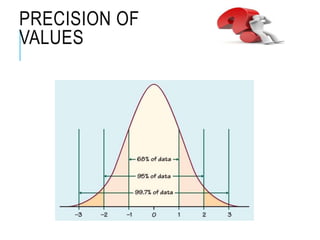


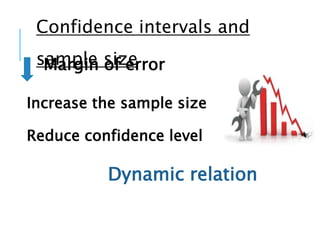
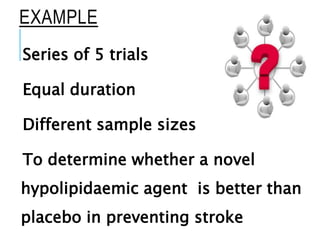
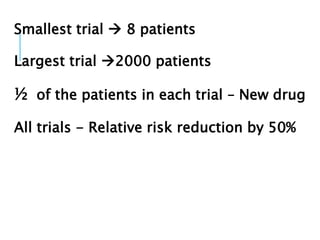
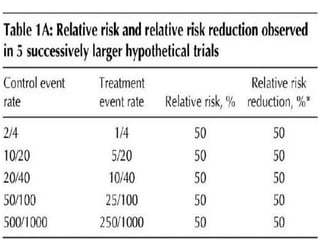


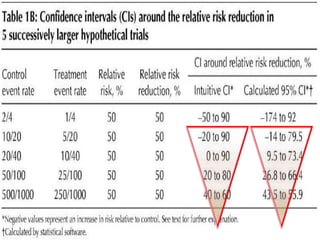


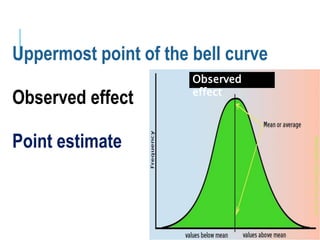
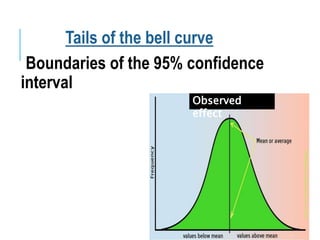
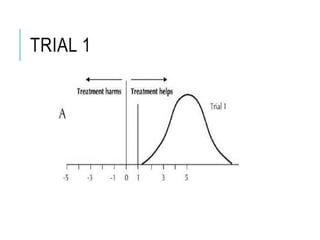
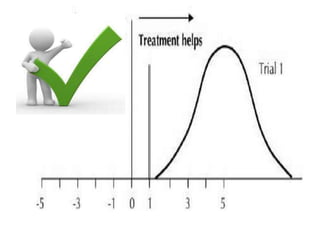
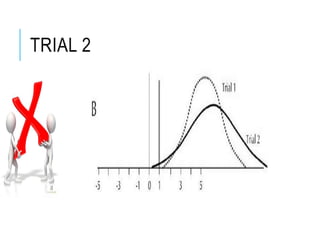
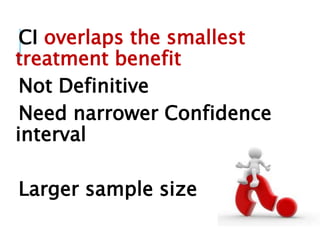
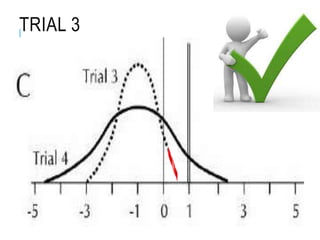


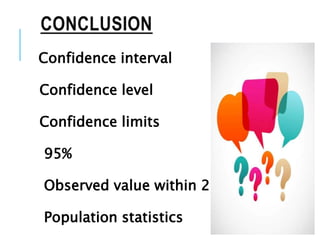


This document discusses confidence intervals, which provide a range of values that is likely to include an unknown population parameter based on a sample statistic. It defines key concepts like confidence level, confidence limits, and factors that determine how to set the confidence interval like sample size, population variability, and precision of values. It explains how larger sample sizes and more precise measurements result in narrower confidence intervals. Applications to clinical trials are discussed, showing how sample size impacts the ability to make definitive recommendations based on trial results.


