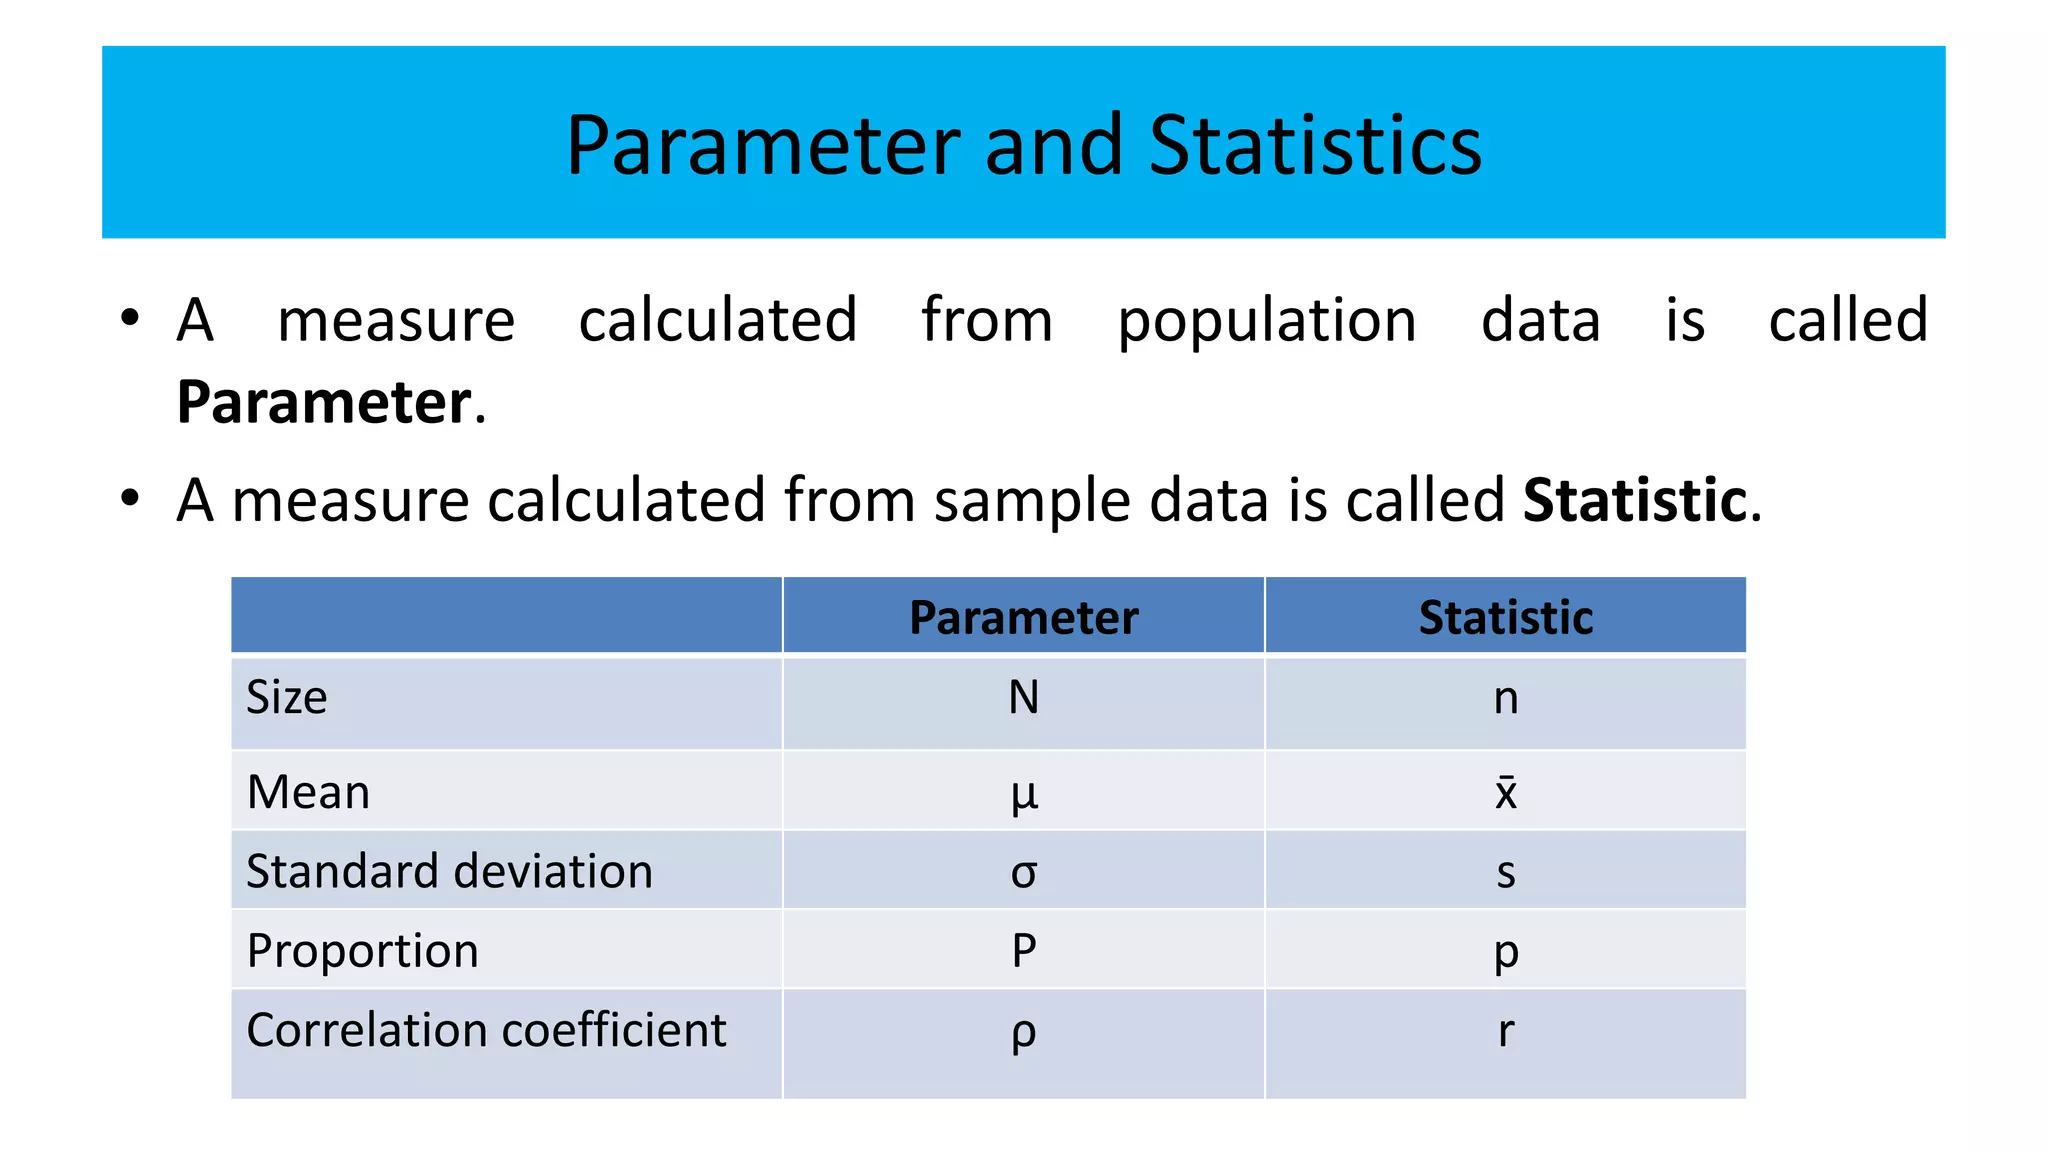
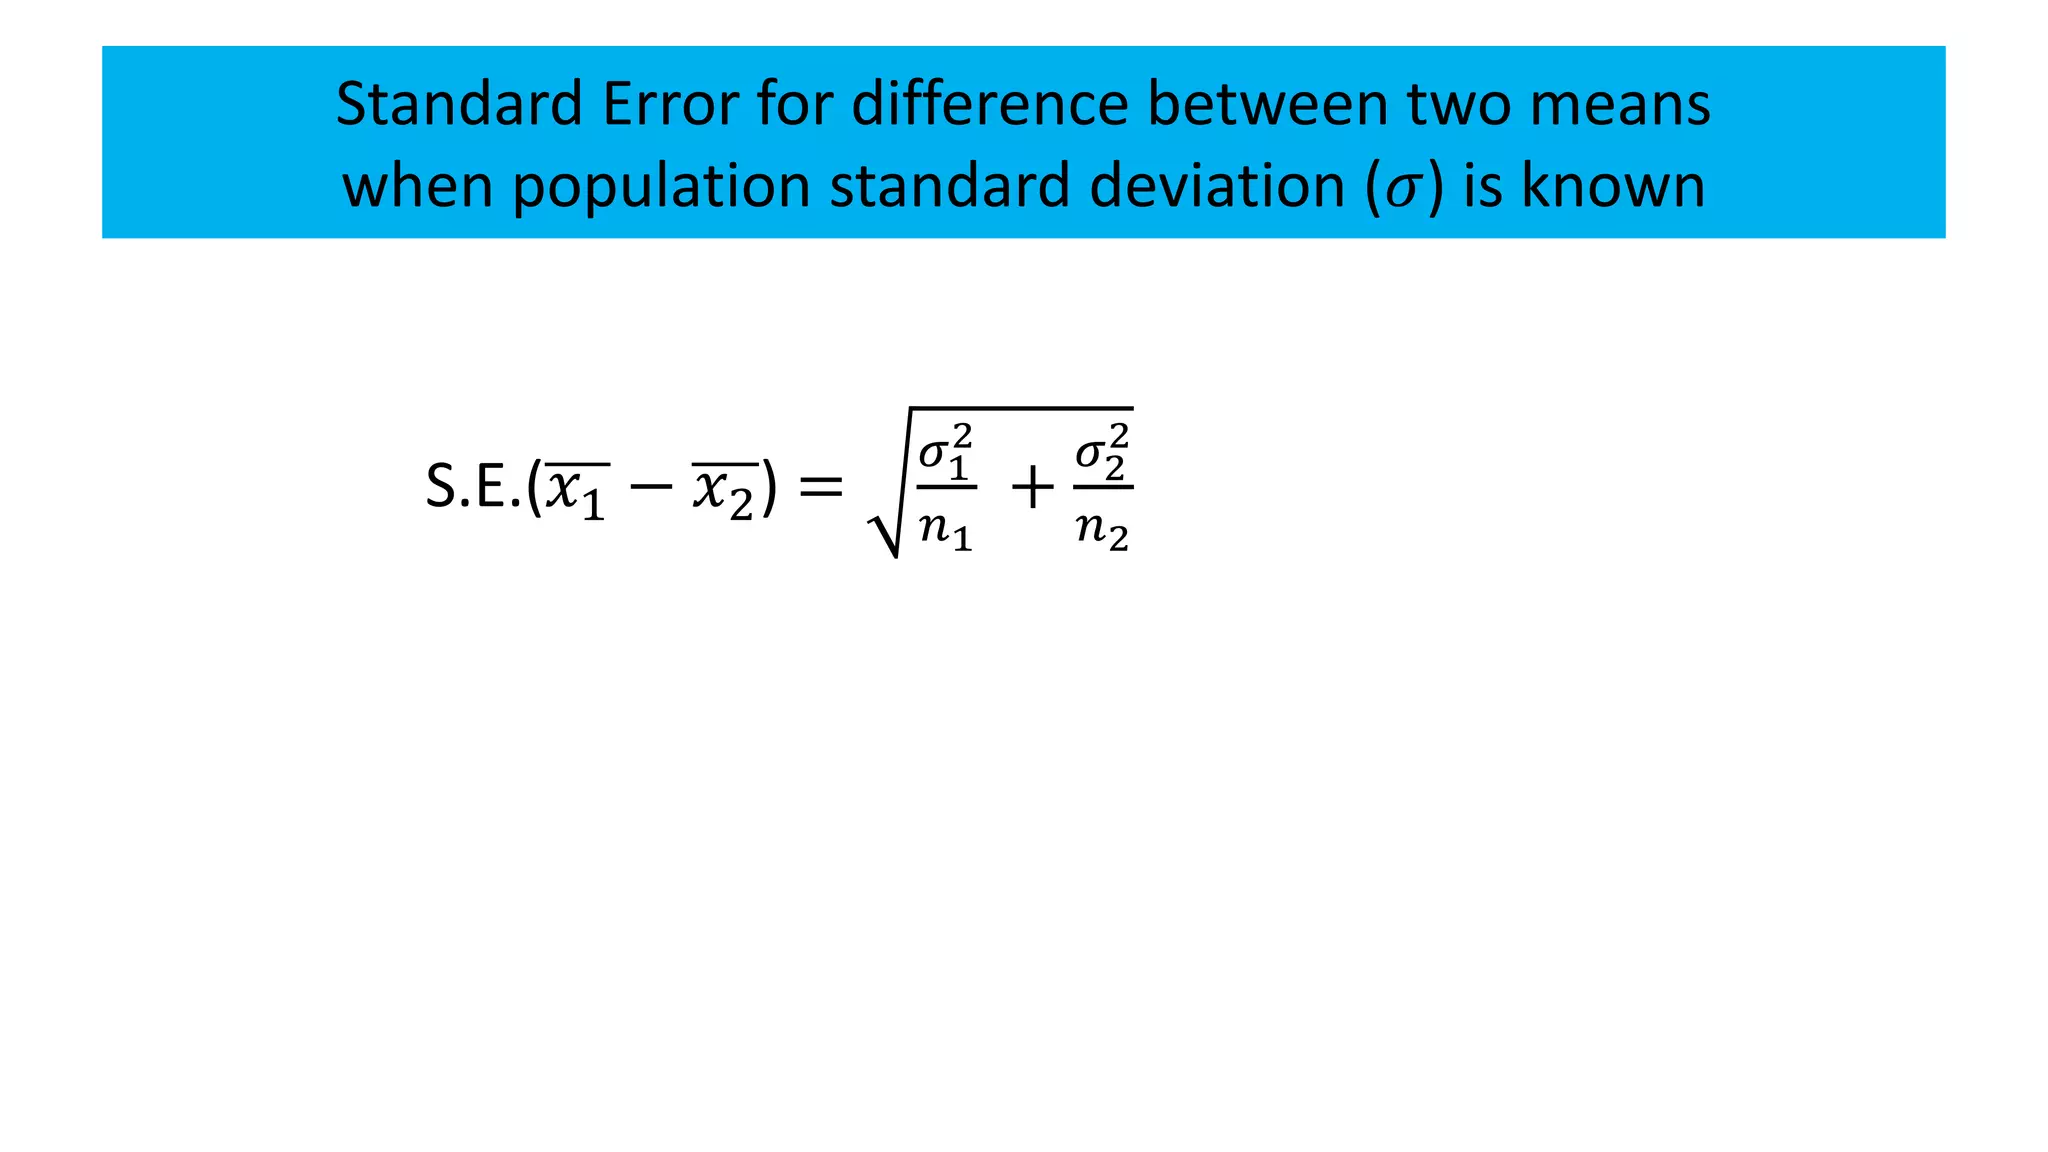
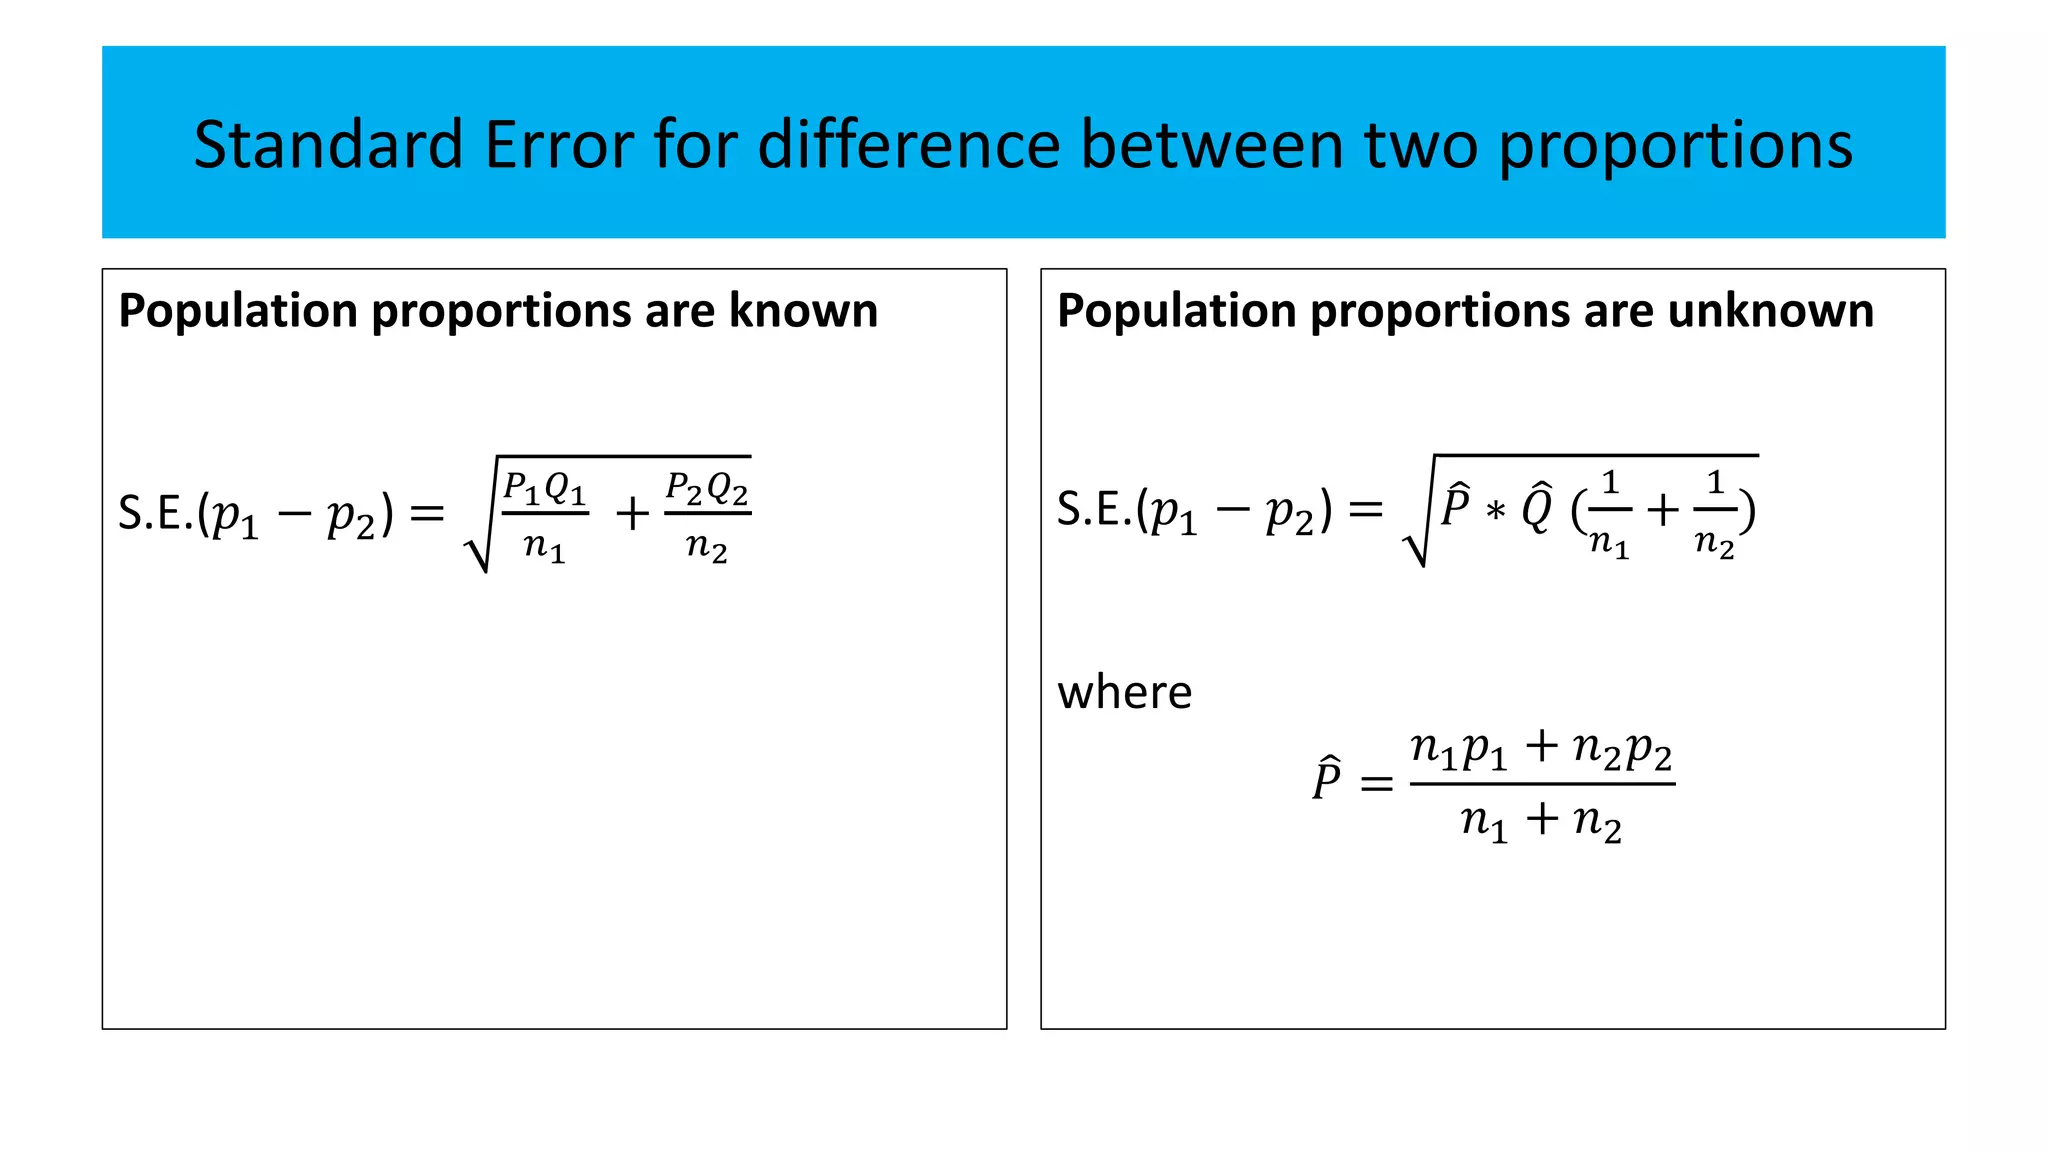
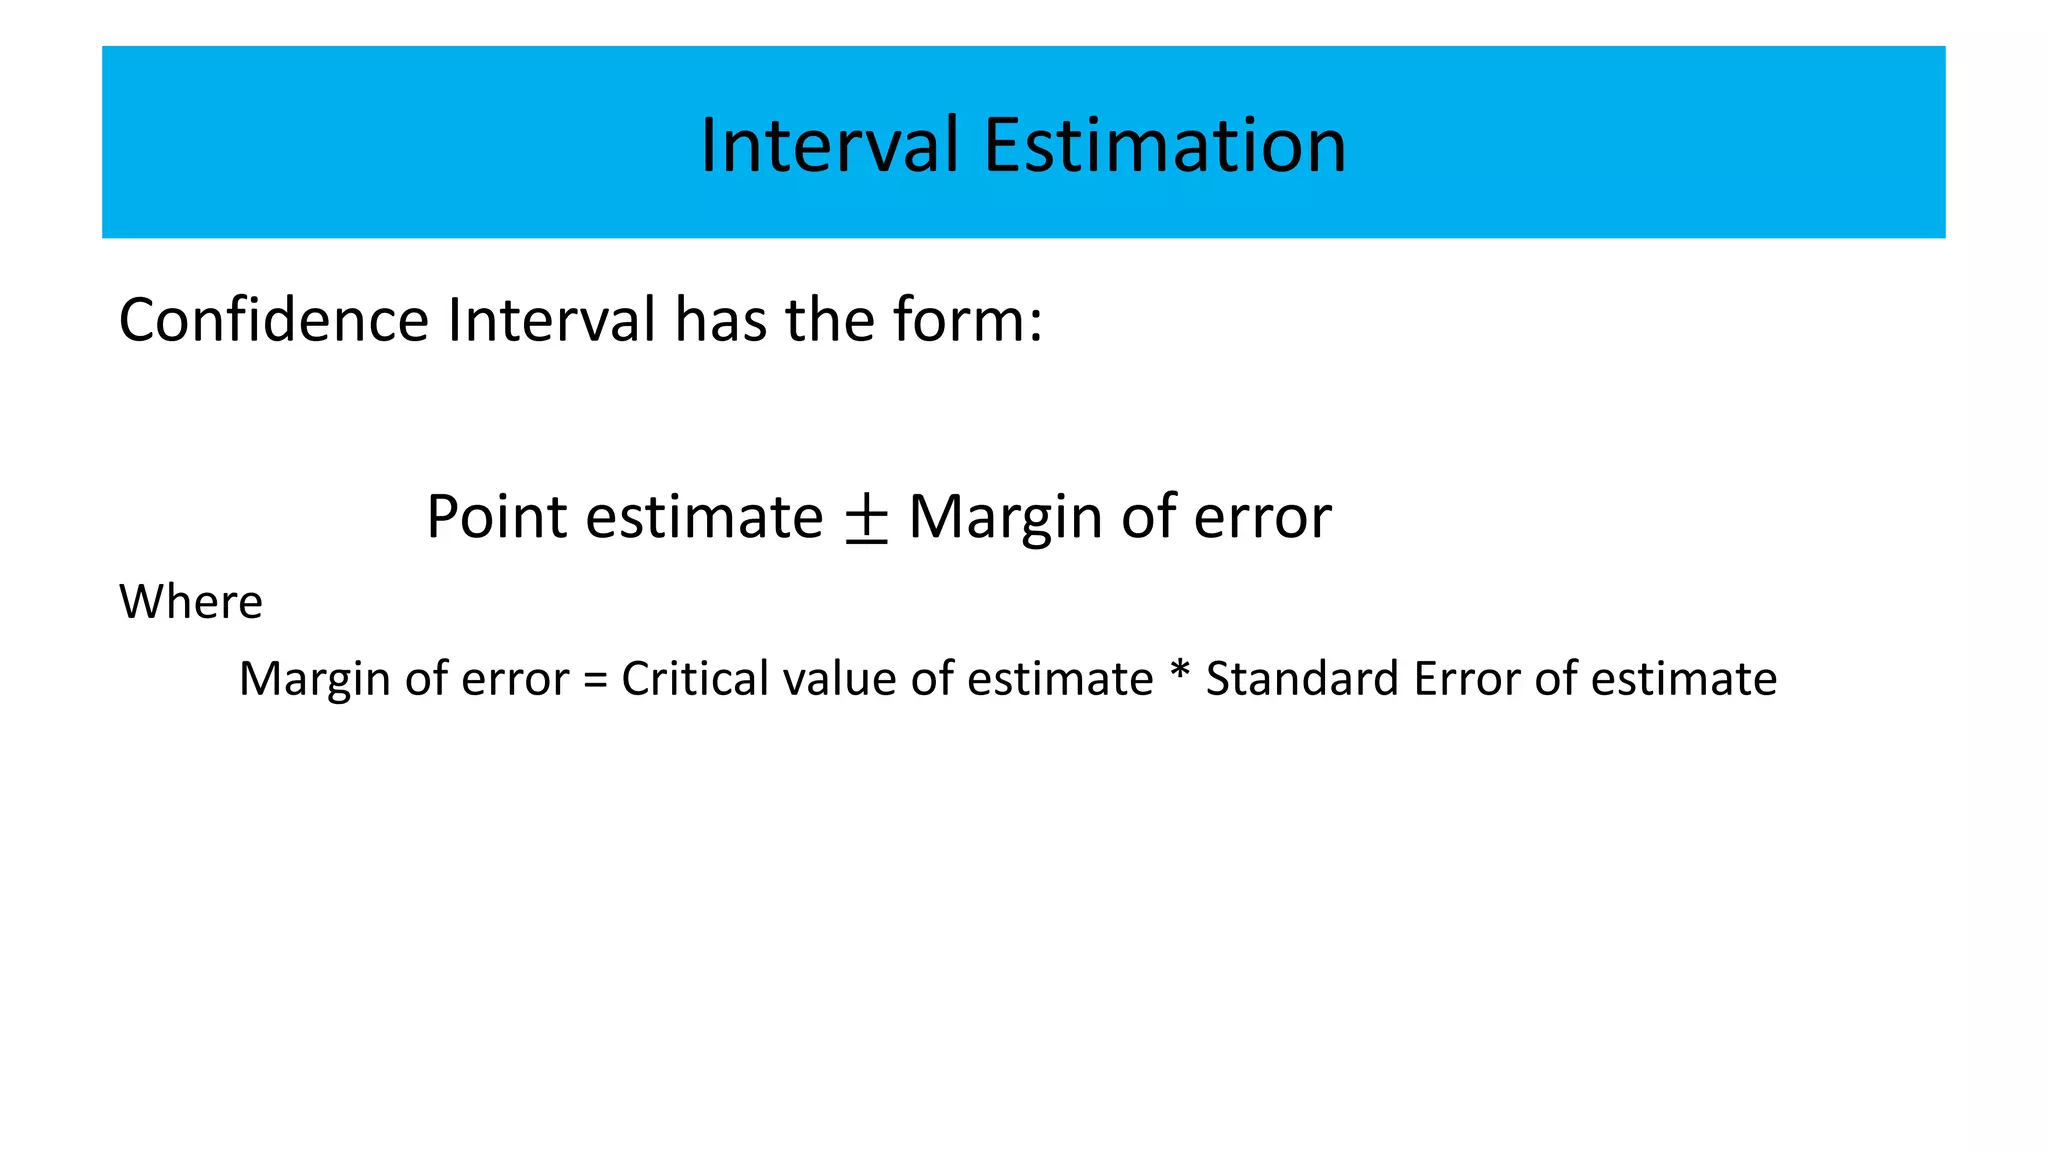
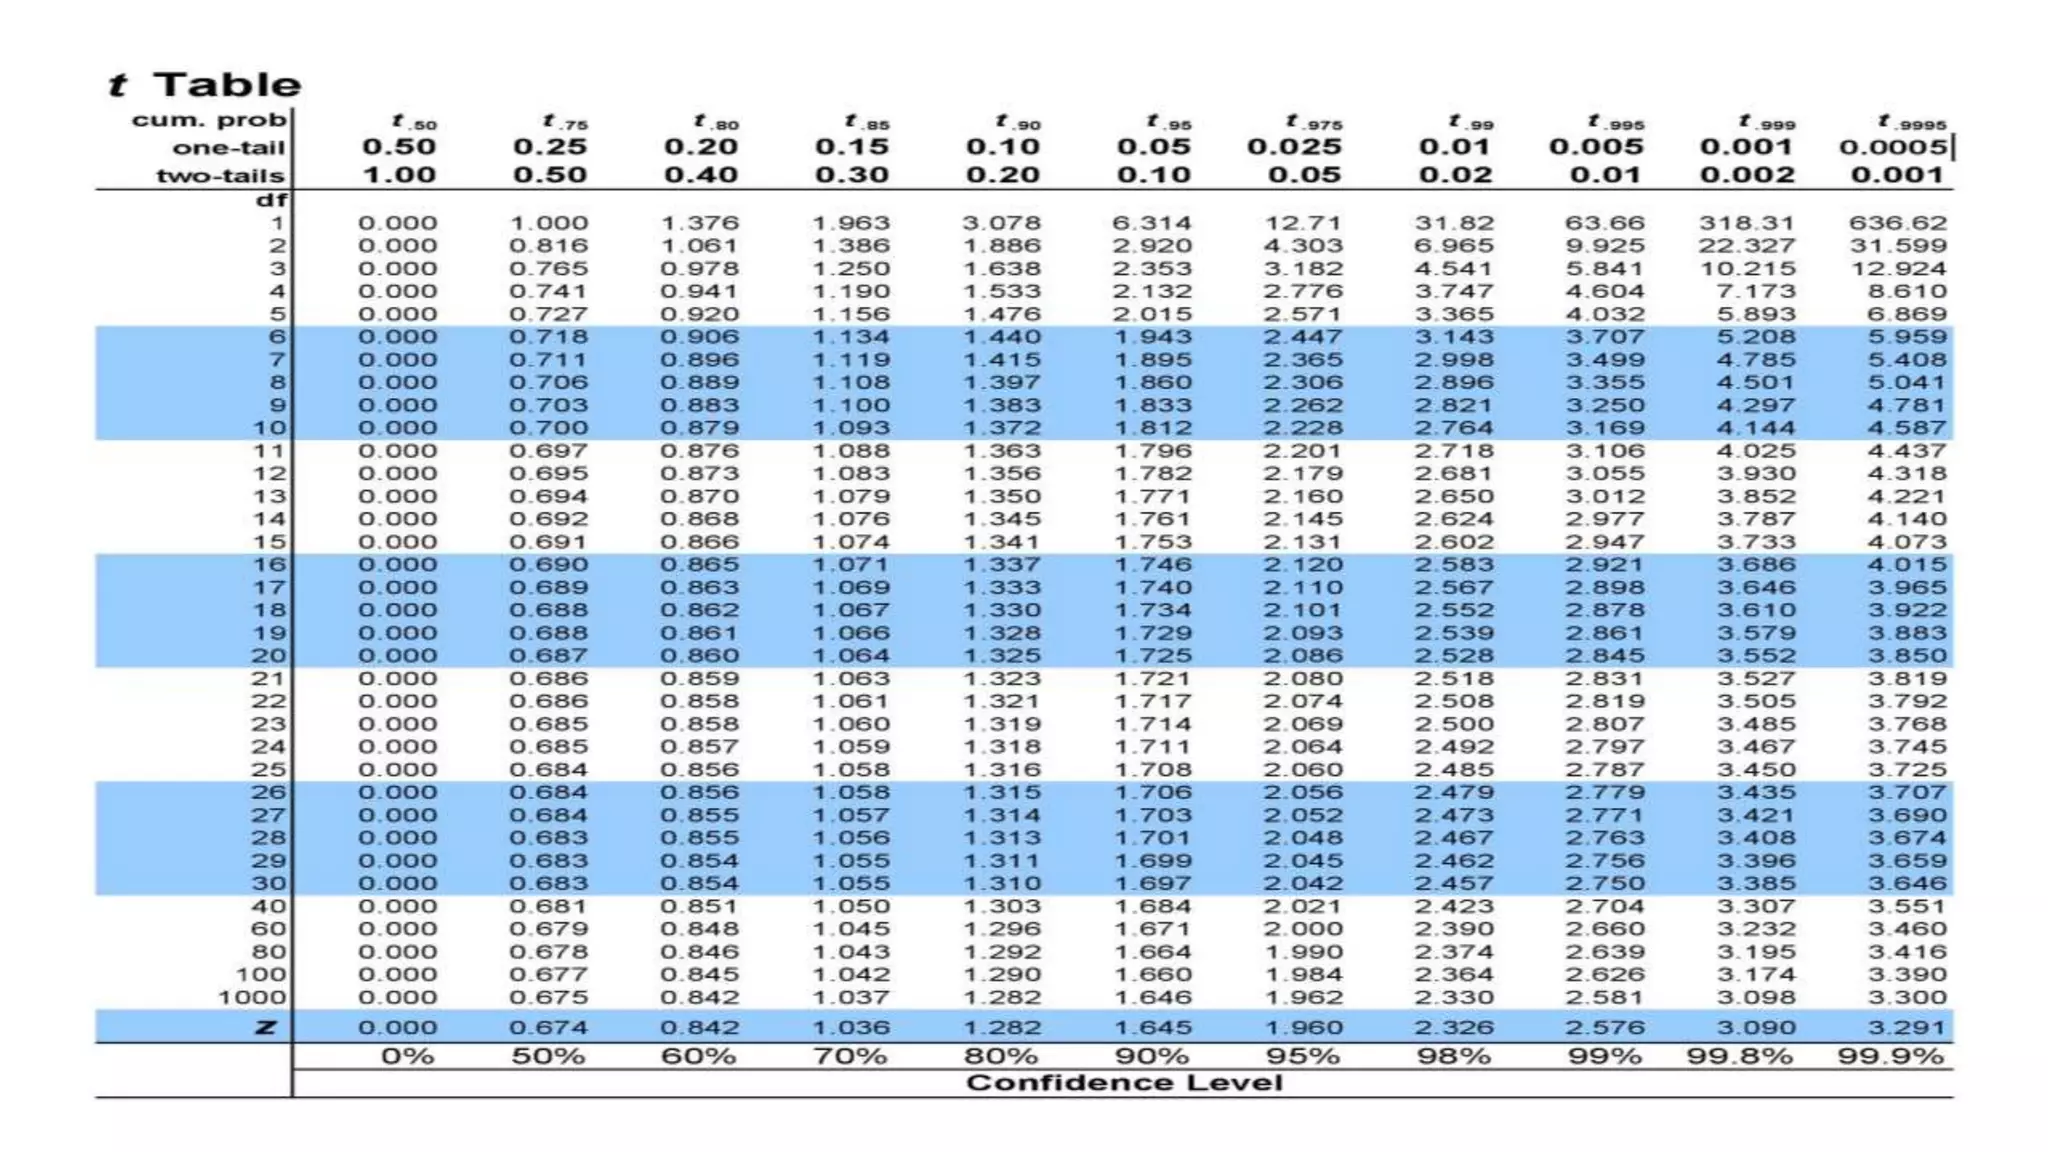
SlideShare a Scribd company logo
STATISTICAL INFERENCE:
ESTIMATION
Parameter and Statistics
• A measure calculated from population data is called
Parameter.
• A measure calculated from sample data is called Statistic.
Parameter Statistic
Size N n
Mean μ x̄
Standard deviation σ s
Proportion P p
Correlation coefficient ρ r
Statistical Inference
The method to infer about population on the basis of sample
information is known as Statistical inference.
It mainly consists of two parts:
• Estimation
• Testing of Hypothesis
Estimation
Estimation is a process whereby we select a random sample from
a population and use a sample statistic to estimate a population
parameter.
There are two ways for estimation:
• Point Estimation
• Interval Estimation
Point Estimate
Point Estimate – A sample statistic used to estimate the exact
value of a population parameter.
• A point estimate is a single value and has the advantage of
being very precise but there is no information about its
reliability.
• The probability that a single sample statistic actually equal to
the parameter value is extremely small. For this reason point
estimation is rarely used.
Good Estimator
Properties of good estimator:
1. Unbiasedness
2. Consistency
3. Sufficiency
4. Efficiency
Unbiasedness
Any sample statistic is said to be an unbiased estimator for the
population parameter if on an average the value sample statistic
is equal to the parameter value.
e.g. 𝐸 𝑥 = 𝜇 i.e. sample mean is an unbiased estimator of
population mean
Consistency
An estimator is said to be a consistent estimator for the
parameter if the value of statistics gets closer to the value of the
parameter and the respective variance of statistics get closer to
zero as sample size increases.
e.g. 𝐸 𝑥 → 𝜇 and 𝑉 𝑥 =
𝜎2
𝑛
→ 0 as sample size n increases
Sufficiency
If a statistic contain almost all information regarding the
population parameter that is contained in the population then
the statistic is called sufficient estimator for the parameter.
Efficiency
An estimator is said to be an efficient estimator if it contains
smaller variance among all variances of all other estimators.
Interval Estimate
Confidence interval (interval estimate) – A range of values
defined by the confidence level within which the population
parameter is estimated to fall.
• The interval estimate is less precise, but gives more
confidence.
Example of Point and Interval Estimate
Government wants to know the percentage of cigarette smokers
among college students.
If we say that there was 10% are smokers, it is a point estimate.
But if we make a statement that 8% to 12% of college students
are smokers, it is interval estimate.
Sampling distribution
From a population of size N, number of samples of size n can be
selected and these samples give different values of a statistics.
These different values of statistic can be arranged in form of a
frequency distribution which is known as sampling distribution
of that statistics.
We can have sampling distribution of sample mean, sampling
distribution of sample proportion etc.
Standard Error of a statistics
The standard deviation calculated from the observations of a
sampling distribution of a statistics is called Standard Error of
that statistics.
E.g. The standard deviation calculated from the observations of
sampling distribution of x̄ is called standard error of x̄. It is
denoted by S.E.(x̄)
Standard Error for Mean
when population standard deviation (𝜎) is known
S.E.( 𝑥 ) =
𝜎
𝑛
for infinite population
S.E.( 𝑥 ) =
𝜎
𝑛
∗
𝑁−𝑛
𝑁−1
for finite population
Standard Error for Mean
when population standard deviation (𝜎) is unknown
When sample size is large ( n > 30)
S.E.( 𝑥 ) =
𝑠
𝑛
for infinite population
S.E.( 𝑥 ) =
𝑠
𝑛
∗
𝑁− 𝑛
𝑁−1
for finite population
When sample size is small ( n ≤ 30)
S.E.( 𝑥 ) =
𝑠
𝑛−1
for infinite population
S.E.( 𝑥 ) =
𝑠
𝑛−1
∗
𝑁− 𝑛
𝑁−1
for finite population
Standard Error for difference between two means
when population standard deviation (𝜎) is known
S.E.(𝑥1 − 𝑥2) =
𝜎1
2
𝑛1
+
𝜎2
2
𝑛2
Standard Error for difference between two means
when population standard deviation (𝜎) is unknown
When sample size is large ( n > 30)
S.E.(𝑥1 − 𝑥2) =
𝑠1
2
𝑛1
+
𝑠2
2
𝑛2
When sample size is small ( n ≤ 30)
S.E.(𝑥1 − 𝑥2) = 𝑠2(
1
𝑛1
+
1
𝑛2
)
Where
𝑠2 =
𝑛1∗𝑠1
2+𝑛2∗𝑠2
2
𝑛1+𝑛2−2
Standard Error for Proportion
S.E. (𝑝) =
𝑃𝑄
𝑛
for infinite population
S.E. (𝑝) =
𝑃𝑄
𝑛
𝑁−𝑛
𝑁−1
for finite population
When population proportion (𝑃) is unknown, then it is estimated by sample
proportion (𝑝)
Standard Error for difference between two proportions
Population proportions are known
S.E.(𝑝1 − 𝑝2) =
𝑃1 𝑄1
𝑛1
+
𝑃2 𝑄2
𝑛2
Population proportions are unknown
S.E.(𝑝1 − 𝑝2) = 𝑃 ∗ 𝑄 (
1
𝑛1
+
1
𝑛2
)
where
𝑃 =
𝑛1 𝑝1 + 𝑛2 𝑝2
𝑛1 + 𝑛2
Interval Estimation
Confidence Interval has the form:
Point estimate ± Margin of error
Where
Margin of error = Critical value of estimate * Standard Error of estimate
z table value
1 % 5% 10%
Two tailed test (≠ ) 2.58 1.96 1.645
One tailed test ( > or < ) 2.33 1.645 1.28
C.I. for Population mean
(i) When Population standard deviation is known or the sample
size is large
𝑥 ± 𝑍 𝛼 × S.E.( 𝑥 )
(ii) When Population standard deviation is unknown and the
sample size is small
𝑥 ± 𝑡 𝛼,𝑛−1 × S.E.( 𝑥 )
Case Study 1
A government agency was charged by the legislature with estimating the
length of time it takes citizens to fill out various forms. Two hundred
randomly selected adults were timed as they filled out a particular form.
The times required had mean 12.8 minutes with standard deviation 1.7
minutes.
Construct a 90% confidence interval for the mean time taken for all adults
to fill out this form.
Case Study 2
A thread manufacturer tests a sample of eight lengths of a
certain type of thread made of blended materials and obtains a
mean tensile strength of 8.2 lb with standard deviation 0.06 lb.
Assuming tensile strengths are normally distributed, construct a
90% confidence interval for the mean tensile strength of this
thread.
C.I. for difference between two means
(i) When Population standard deviation is known or the sample
size is large
(𝑥1 − 𝑥2) ± 𝑍 𝛼 × S.E.(𝑥1 − 𝑥2)
(ii) When Population standard deviation is unknown and the
sample size is small
(𝑥1 − 𝑥2) ± 𝑡 𝛼,𝑛1+𝑛2−2 × S.E.(𝑥1 − 𝑥2)
Case Study 1
Records of 40 used passenger cars and 40 used pickup trucks
(none used commercially) were randomly selected to investigate
whether there was any difference in the mean time in years that
they were kept by the original owner before being sold. For cars
the mean was 5.3 years with standard deviation 2.2 years. For
pickup trucks the mean was 7.1 years with standard deviation 3.0
years. Construct the 95% confidence interval for the difference in
the means based on these data.
Case Study 2
A university administrator wishes to know if there is a difference in average
starting salary for graduates with master’s degrees in engineering and those
with master’s degrees in business. Fifteen recent graduates with master’s
degree in engineering and 11 with master’s degrees in business are surveyed
and the results are summarized below. Construct the 99% confidence interval
for the difference in the population means based on these data.
n Mean Std. dev
Engineering 15 68,535 1627
Business 11 63,230 2033
C.I. for Population proportion
𝑝 ± 𝑍 𝛼 × S.E.(𝑝)
Case Study
In a random sample of 2,300 mortgages taken out in a certain
region last year, 187 were adjustable-rate mortgages. Assuming
that the sample is sufficiently large, construct a 99% confidence
interval for the proportion of all mortgages taken out in this
region last year that were adjustable-rate mortgages.
C.I. for difference between two proportions
(𝑝1 − 𝑝2) ± 𝑍 𝛼 × S.E.(𝑝1 − 𝑝2)
Case Study
A survey for anemia prevalence among women in developing
countries was conducted among African and Asian women. Out
of 2100 African women, 840 were anemia and out of 1900 Asian
women, 323 were anemia. Find a 95% confidence interval for the
difference in proportions of all African women with anemia and
all women from the Asian with anemia.

More Related Content

What's hot

Basic probability concept
Basic probability conceptBasic probability concept
Basic probability concept
Mmedsc Hahm
 
Sampling Distributions
Sampling DistributionsSampling Distributions
Sampling Distributions
DataminingTools Inc
 
Statistical Inference
Statistical Inference Statistical Inference
Statistical Inference
Muhammad Amir Sohail
 
Regression analysis.
Regression analysis.Regression analysis.
Regression analysis.
sonia gupta
 
Point Estimation
Point Estimation Point Estimation
Measure of Dispersion in statistics
Measure of Dispersion in statisticsMeasure of Dispersion in statistics
Measure of Dispersion in statistics
Md. Mehadi Hassan Bappy
 
Statistical Estimation
Statistical Estimation Statistical Estimation
Statistical Estimation
Remyagharishs
 
Probability Distributions
Probability DistributionsProbability Distributions
Probability Distributions
Birinder Singh Gulati
 
Regression analysis
Regression analysisRegression analysis
Regression analysis
Shameer P Hamsa
 
Regression Analysis
Regression AnalysisRegression Analysis
Regression Analysis
Birinder Singh Gulati
 
Hypothesis testing
Hypothesis testingHypothesis testing
Hypothesis testing
Kaori Kubo Germano, PhD
 
Logistic Regression Analysis
Logistic Regression AnalysisLogistic Regression Analysis
Logistic Regression Analysis
COSTARCH Analytical Consulting (P) Ltd.
 
Sampling distribution
Sampling distributionSampling distribution
Sampling distribution
swarna dey
 
Binomial probability distributions ppt
Binomial probability distributions pptBinomial probability distributions ppt
Binomial probability distributions pptTayab Ali
 
Simple Linier Regression
Simple Linier RegressionSimple Linier Regression
Simple Linier Regressiondessybudiyanti
 
Probability distribution
Probability distributionProbability distribution
Probability distribution
Rohit kumar
 
Simple linear regression
Simple linear regressionSimple linear regression
Simple linear regression
Avjinder (Avi) Kaler
 
The sampling distribution
The sampling distributionThe sampling distribution
The sampling distributionHarve Abella
 

What's hot (20)

Basic probability concept
Basic probability conceptBasic probability concept
Basic probability concept
 
Sampling Distributions
Sampling DistributionsSampling Distributions
Sampling Distributions
 
Statistical Inference
Statistical Inference Statistical Inference
Statistical Inference
 
Regression analysis.
Regression analysis.Regression analysis.
Regression analysis.
 
Point Estimation
Point Estimation Point Estimation
Point Estimation
 
Regression
RegressionRegression
Regression
 
Measure of Dispersion in statistics
Measure of Dispersion in statisticsMeasure of Dispersion in statistics
Measure of Dispersion in statistics
 
The Chi Square Test
The Chi Square TestThe Chi Square Test
The Chi Square Test
 
Statistical Estimation
Statistical Estimation Statistical Estimation
Statistical Estimation
 
Probability Distributions
Probability DistributionsProbability Distributions
Probability Distributions
 
Regression analysis
Regression analysisRegression analysis
Regression analysis
 
Regression Analysis
Regression AnalysisRegression Analysis
Regression Analysis
 
Hypothesis testing
Hypothesis testingHypothesis testing
Hypothesis testing
 
Logistic Regression Analysis
Logistic Regression AnalysisLogistic Regression Analysis
Logistic Regression Analysis
 
Sampling distribution
Sampling distributionSampling distribution
Sampling distribution
 
Binomial probability distributions ppt
Binomial probability distributions pptBinomial probability distributions ppt
Binomial probability distributions ppt
 
Simple Linier Regression
Simple Linier RegressionSimple Linier Regression
Simple Linier Regression
 
Probability distribution
Probability distributionProbability distribution
Probability distribution
 
Simple linear regression
Simple linear regressionSimple linear regression
Simple linear regression
 
The sampling distribution
The sampling distributionThe sampling distribution
The sampling distribution
 

Similar to Statistical inference: Estimation

statistical inference.pptx
statistical inference.pptxstatistical inference.pptx
statistical inference.pptx
SoujanyaLk1
 
3. Statistical inference_anesthesia.pptx
3.  Statistical inference_anesthesia.pptx3.  Statistical inference_anesthesia.pptx
3. Statistical inference_anesthesia.pptx
Abebe334138
 
Estimating a Population Proportion
Estimating a Population Proportion  Estimating a Population Proportion
Estimating a Population Proportion
Long Beach City College
 
Ch3_Statistical Analysis and Random Error Estimation.pdf
Ch3_Statistical Analysis and Random Error Estimation.pdfCh3_Statistical Analysis and Random Error Estimation.pdf
Ch3_Statistical Analysis and Random Error Estimation.pdf
Vamshi962726
 
Estimation in statistics
Estimation in statisticsEstimation in statistics
Estimation in statistics
Rabea Jamal
 
estimation.pptx
estimation.pptxestimation.pptx
estimation.pptx
NaolAbebe8
 
5_lectureslides.pptx
5_lectureslides.pptx5_lectureslides.pptx
5_lectureslides.pptx
suchita74
 
Statistik 1 7 estimasi & ci
Statistik 1 7 estimasi & ciStatistik 1 7 estimasi & ci
Statistik 1 7 estimasi & ciSelvin Hadi
 
Normal and standard normal distribution
Normal and standard normal distributionNormal and standard normal distribution
Normal and standard normal distribution
Avjinder (Avi) Kaler
 
Mpu 1033 Kuliah 9
Mpu 1033 Kuliah 9Mpu 1033 Kuliah 9
Mpu 1033 Kuliah 9SITI AHMAD
 
Theory of estimation
Theory of estimationTheory of estimation
Theory of estimationTech_MX
 
Estimating a Population Mean
Estimating a Population Mean  Estimating a Population Mean
Estimating a Population Mean
Long Beach City College
 
STATISTIC ESTIMATION
STATISTIC ESTIMATIONSTATISTIC ESTIMATION
STATISTIC ESTIMATION
Smruti Ranjan Parida
 
Probability Distributions
Probability DistributionsProbability Distributions
Probability DistributionsHarish Lunani
 
1 lab basicstatisticsfall2013
1 lab basicstatisticsfall20131 lab basicstatisticsfall2013
1 lab basicstatisticsfall2013TAMUK
 
Basic of Statistical Inference Part-III: The Theory of Estimation from Dexlab...
Basic of Statistical Inference Part-III: The Theory of Estimation from Dexlab...Basic of Statistical Inference Part-III: The Theory of Estimation from Dexlab...
Basic of Statistical Inference Part-III: The Theory of Estimation from Dexlab...
Dexlab Analytics
 
Estimating population mean
Estimating population meanEstimating population mean
Estimating population mean
Ronaldo Cabardo
 
Chapter 8
Chapter 8Chapter 8

Similar to Statistical inference: Estimation (20)

statistical inference.pptx
statistical inference.pptxstatistical inference.pptx
statistical inference.pptx
 
3. Statistical inference_anesthesia.pptx
3.  Statistical inference_anesthesia.pptx3.  Statistical inference_anesthesia.pptx
3. Statistical inference_anesthesia.pptx
 
Estimating a Population Proportion
Estimating a Population Proportion  Estimating a Population Proportion
Estimating a Population Proportion
 
Ch3_Statistical Analysis and Random Error Estimation.pdf
Ch3_Statistical Analysis and Random Error Estimation.pdfCh3_Statistical Analysis and Random Error Estimation.pdf
Ch3_Statistical Analysis and Random Error Estimation.pdf
 
Estimation in statistics
Estimation in statisticsEstimation in statistics
Estimation in statistics
 
estimation.pptx
estimation.pptxestimation.pptx
estimation.pptx
 
5_lectureslides.pptx
5_lectureslides.pptx5_lectureslides.pptx
5_lectureslides.pptx
 
Statistik 1 7 estimasi & ci
Statistik 1 7 estimasi & ciStatistik 1 7 estimasi & ci
Statistik 1 7 estimasi & ci
 
Normal and standard normal distribution
Normal and standard normal distributionNormal and standard normal distribution
Normal and standard normal distribution
 
Mpu 1033 Kuliah 9
Mpu 1033 Kuliah 9Mpu 1033 Kuliah 9
Mpu 1033 Kuliah 9
 
Inferential statistics-estimation
Inferential statistics-estimationInferential statistics-estimation
Inferential statistics-estimation
 
Theory of estimation
Theory of estimationTheory of estimation
Theory of estimation
 
Estimating a Population Mean
Estimating a Population Mean  Estimating a Population Mean
Estimating a Population Mean
 
STATISTIC ESTIMATION
STATISTIC ESTIMATIONSTATISTIC ESTIMATION
STATISTIC ESTIMATION
 
Probability Distributions
Probability DistributionsProbability Distributions
Probability Distributions
 
1 lab basicstatisticsfall2013
1 lab basicstatisticsfall20131 lab basicstatisticsfall2013
1 lab basicstatisticsfall2013
 
Chapter09
Chapter09Chapter09
Chapter09
 
Basic of Statistical Inference Part-III: The Theory of Estimation from Dexlab...
Basic of Statistical Inference Part-III: The Theory of Estimation from Dexlab...Basic of Statistical Inference Part-III: The Theory of Estimation from Dexlab...
Basic of Statistical Inference Part-III: The Theory of Estimation from Dexlab...
 
Estimating population mean
Estimating population meanEstimating population mean
Estimating population mean
 
Chapter 8
Chapter 8Chapter 8
Chapter 8
 

More from Parag Shah

Basic Statistics in 1 hour.pptx
Basic Statistics in 1 hour.pptxBasic Statistics in 1 hour.pptx
Basic Statistics in 1 hour.pptx
Parag Shah
 
Non- Parametric Tests
Non- Parametric TestsNon- Parametric Tests
Non- Parametric Tests
Parag Shah
 
Correlation & Regression Analysis using SPSS
Correlation & Regression Analysis  using SPSSCorrelation & Regression Analysis  using SPSS
Correlation & Regression Analysis using SPSS
Parag Shah
 
Proportion test using Chi square
Proportion test using Chi squareProportion test using Chi square
Proportion test using Chi square
Parag Shah
 
Chi square tests using spss
Chi square tests using spssChi square tests using spss
Chi square tests using spss
Parag Shah
 
Chi square tests using SPSS
Chi square tests using SPSSChi square tests using SPSS
Chi square tests using SPSS
Parag Shah
 
t test using spss
t test using spsst test using spss
t test using spss
Parag Shah
 
Basics of Hypothesis testing for Pharmacy
Basics of Hypothesis testing for PharmacyBasics of Hypothesis testing for Pharmacy
Basics of Hypothesis testing for Pharmacy
Parag Shah
 
Exploratory Data Analysis for Biotechnology and Pharmaceutical Sciences
Exploratory Data Analysis for Biotechnology and Pharmaceutical SciencesExploratory Data Analysis for Biotechnology and Pharmaceutical Sciences
Exploratory Data Analysis for Biotechnology and Pharmaceutical Sciences
Parag Shah
 
Probability
Probability    Probability
Probability
Parag Shah
 
Basic stat analysis using excel
Basic stat analysis using excelBasic stat analysis using excel
Basic stat analysis using excel
Parag Shah
 
Small sample test
Small sample testSmall sample test
Small sample test
Parag Shah
 
F test and ANOVA
F test and ANOVAF test and ANOVA
F test and ANOVA
Parag Shah
 
Testing of hypothesis - Chi-Square test
Testing of hypothesis - Chi-Square testTesting of hypothesis - Chi-Square test
Testing of hypothesis - Chi-Square test
Parag Shah
 
Testing of hypothesis - large sample test
Testing of hypothesis - large sample testTesting of hypothesis - large sample test
Testing of hypothesis - large sample test
Parag Shah
 
Statistics for Physical Education
Statistics for Physical EducationStatistics for Physical Education
Statistics for Physical Education
Parag Shah
 
Career option for stats
Career option for statsCareer option for stats
Career option for stats
Parag Shah
 

More from Parag Shah (17)

Basic Statistics in 1 hour.pptx
Basic Statistics in 1 hour.pptxBasic Statistics in 1 hour.pptx
Basic Statistics in 1 hour.pptx
 
Non- Parametric Tests
Non- Parametric TestsNon- Parametric Tests
Non- Parametric Tests
 
Correlation & Regression Analysis using SPSS
Correlation & Regression Analysis  using SPSSCorrelation & Regression Analysis  using SPSS
Correlation & Regression Analysis using SPSS
 
Proportion test using Chi square
Proportion test using Chi squareProportion test using Chi square
Proportion test using Chi square
 
Chi square tests using spss
Chi square tests using spssChi square tests using spss
Chi square tests using spss
 
Chi square tests using SPSS
Chi square tests using SPSSChi square tests using SPSS
Chi square tests using SPSS
 
t test using spss
t test using spsst test using spss
t test using spss
 
Basics of Hypothesis testing for Pharmacy
Basics of Hypothesis testing for PharmacyBasics of Hypothesis testing for Pharmacy
Basics of Hypothesis testing for Pharmacy
 
Exploratory Data Analysis for Biotechnology and Pharmaceutical Sciences
Exploratory Data Analysis for Biotechnology and Pharmaceutical SciencesExploratory Data Analysis for Biotechnology and Pharmaceutical Sciences
Exploratory Data Analysis for Biotechnology and Pharmaceutical Sciences
 
Probability
Probability    Probability
Probability
 
Basic stat analysis using excel
Basic stat analysis using excelBasic stat analysis using excel
Basic stat analysis using excel
 
Small sample test
Small sample testSmall sample test
Small sample test
 
F test and ANOVA
F test and ANOVAF test and ANOVA
F test and ANOVA
 
Testing of hypothesis - Chi-Square test
Testing of hypothesis - Chi-Square testTesting of hypothesis - Chi-Square test
Testing of hypothesis - Chi-Square test
 
Testing of hypothesis - large sample test
Testing of hypothesis - large sample testTesting of hypothesis - large sample test
Testing of hypothesis - large sample test
 
Statistics for Physical Education
Statistics for Physical EducationStatistics for Physical Education
Statistics for Physical Education
 
Career option for stats
Career option for statsCareer option for stats
Career option for stats
 

Recently uploaded

1.Seydhcuxhxyxhccuuxuxyxyxmisolids 2019.pptx
1.Seydhcuxhxyxhccuuxuxyxyxmisolids 2019.pptx1.Seydhcuxhxyxhccuuxuxyxyxmisolids 2019.pptx
1.Seydhcuxhxyxhccuuxuxyxyxmisolids 2019.pptx
Tiktokethiodaily
 
一比一原版(ArtEZ毕业证)ArtEZ艺术学院毕业证成绩单
一比一原版(ArtEZ毕业证)ArtEZ艺术学院毕业证成绩单一比一原版(ArtEZ毕业证)ArtEZ艺术学院毕业证成绩单
一比一原版(ArtEZ毕业证)ArtEZ艺术学院毕业证成绩单
vcaxypu
 
原版制作(Deakin毕业证书)迪肯大学毕业证学位证一模一样
原版制作(Deakin毕业证书)迪肯大学毕业证学位证一模一样原版制作(Deakin毕业证书)迪肯大学毕业证学位证一模一样
原版制作(Deakin毕业证书)迪肯大学毕业证学位证一模一样
u86oixdj
 
一比一原版(CBU毕业证)卡普顿大学毕业证如何办理
一比一原版(CBU毕业证)卡普顿大学毕业证如何办理一比一原版(CBU毕业证)卡普顿大学毕业证如何办理
一比一原版(CBU毕业证)卡普顿大学毕业证如何办理
ahzuo
 
Opendatabay - Open Data Marketplace.pptx
Opendatabay - Open Data Marketplace.pptxOpendatabay - Open Data Marketplace.pptx
Opendatabay - Open Data Marketplace.pptx
Opendatabay
 
Q1’2024 Update: MYCI’s Leap Year Rebound
Q1’2024 Update: MYCI’s Leap Year ReboundQ1’2024 Update: MYCI’s Leap Year Rebound
Q1’2024 Update: MYCI’s Leap Year Rebound
Oppotus
 
Data Centers - Striving Within A Narrow Range - Research Report - MCG - May 2...
Data Centers - Striving Within A Narrow Range - Research Report - MCG - May 2...Data Centers - Striving Within A Narrow Range - Research Report - MCG - May 2...
Data Centers - Striving Within A Narrow Range - Research Report - MCG - May 2...
pchutichetpong
 
Algorithmic optimizations for Dynamic Levelwise PageRank (from STICD) : SHORT...
Algorithmic optimizations for Dynamic Levelwise PageRank (from STICD) : SHORT...Algorithmic optimizations for Dynamic Levelwise PageRank (from STICD) : SHORT...
Algorithmic optimizations for Dynamic Levelwise PageRank (from STICD) : SHORT...
Subhajit Sahu
 
一比一原版(UniSA毕业证书)南澳大学毕业证如何办理
一比一原版(UniSA毕业证书)南澳大学毕业证如何办理一比一原版(UniSA毕业证书)南澳大学毕业证如何办理
一比一原版(UniSA毕业证书)南澳大学毕业证如何办理
slg6lamcq
 
一比一原版(CBU毕业证)不列颠海角大学毕业证成绩单
一比一原版(CBU毕业证)不列颠海角大学毕业证成绩单一比一原版(CBU毕业证)不列颠海角大学毕业证成绩单
一比一原版(CBU毕业证)不列颠海角大学毕业证成绩单
nscud
 
一比一原版(BU毕业证)波士顿大学毕业证成绩单
一比一原版(BU毕业证)波士顿大学毕业证成绩单一比一原版(BU毕业证)波士顿大学毕业证成绩单
一比一原版(BU毕业证)波士顿大学毕业证成绩单
ewymefz
 
Best best suvichar in gujarati english meaning of this sentence as Silk road ...
Best best suvichar in gujarati english meaning of this sentence as Silk road ...Best best suvichar in gujarati english meaning of this sentence as Silk road ...
Best best suvichar in gujarati english meaning of this sentence as Silk road ...
AbhimanyuSinha9
 
一比一原版(Deakin毕业证书)迪肯大学毕业证如何办理
一比一原版(Deakin毕业证书)迪肯大学毕业证如何办理一比一原版(Deakin毕业证书)迪肯大学毕业证如何办理
一比一原版(Deakin毕业证书)迪肯大学毕业证如何办理
oz8q3jxlp
 
一比一原版(TWU毕业证)西三一大学毕业证成绩单
一比一原版(TWU毕业证)西三一大学毕业证成绩单一比一原版(TWU毕业证)西三一大学毕业证成绩单
一比一原版(TWU毕业证)西三一大学毕业证成绩单
ocavb
 
SOCRadar Germany 2024 Threat Landscape Report
SOCRadar Germany 2024 Threat Landscape ReportSOCRadar Germany 2024 Threat Landscape Report
SOCRadar Germany 2024 Threat Landscape Report
SOCRadar
 
Sample_Global Non-invasive Prenatal Testing (NIPT) Market, 2019-2030.pdf
Sample_Global Non-invasive Prenatal Testing (NIPT) Market, 2019-2030.pdfSample_Global Non-invasive Prenatal Testing (NIPT) Market, 2019-2030.pdf
Sample_Global Non-invasive Prenatal Testing (NIPT) Market, 2019-2030.pdf
Linda486226
 
The affect of service quality and online reviews on customer loyalty in the E...
The affect of service quality and online reviews on customer loyalty in the E...The affect of service quality and online reviews on customer loyalty in the E...
The affect of service quality and online reviews on customer loyalty in the E...
jerlynmaetalle
 
Criminal IP - Threat Hunting Webinar.pdf
Criminal IP - Threat Hunting Webinar.pdfCriminal IP - Threat Hunting Webinar.pdf
Criminal IP - Threat Hunting Webinar.pdf
Criminal IP
 
一比一原版(QU毕业证)皇后大学毕业证成绩单
一比一原版(QU毕业证)皇后大学毕业证成绩单一比一原版(QU毕业证)皇后大学毕业证成绩单
一比一原版(QU毕业证)皇后大学毕业证成绩单
enxupq
 
Adjusting primitives for graph : SHORT REPORT / NOTES
Adjusting primitives for graph : SHORT REPORT / NOTESAdjusting primitives for graph : SHORT REPORT / NOTES
Adjusting primitives for graph : SHORT REPORT / NOTES
Subhajit Sahu
 

Recently uploaded (20)

1.Seydhcuxhxyxhccuuxuxyxyxmisolids 2019.pptx
1.Seydhcuxhxyxhccuuxuxyxyxmisolids 2019.pptx1.Seydhcuxhxyxhccuuxuxyxyxmisolids 2019.pptx
1.Seydhcuxhxyxhccuuxuxyxyxmisolids 2019.pptx
 
一比一原版(ArtEZ毕业证)ArtEZ艺术学院毕业证成绩单
一比一原版(ArtEZ毕业证)ArtEZ艺术学院毕业证成绩单一比一原版(ArtEZ毕业证)ArtEZ艺术学院毕业证成绩单
一比一原版(ArtEZ毕业证)ArtEZ艺术学院毕业证成绩单
 
原版制作(Deakin毕业证书)迪肯大学毕业证学位证一模一样
原版制作(Deakin毕业证书)迪肯大学毕业证学位证一模一样原版制作(Deakin毕业证书)迪肯大学毕业证学位证一模一样
原版制作(Deakin毕业证书)迪肯大学毕业证学位证一模一样
 
一比一原版(CBU毕业证)卡普顿大学毕业证如何办理
一比一原版(CBU毕业证)卡普顿大学毕业证如何办理一比一原版(CBU毕业证)卡普顿大学毕业证如何办理
一比一原版(CBU毕业证)卡普顿大学毕业证如何办理
 
Opendatabay - Open Data Marketplace.pptx
Opendatabay - Open Data Marketplace.pptxOpendatabay - Open Data Marketplace.pptx
Opendatabay - Open Data Marketplace.pptx
 
Q1’2024 Update: MYCI’s Leap Year Rebound
Q1’2024 Update: MYCI’s Leap Year ReboundQ1’2024 Update: MYCI’s Leap Year Rebound
Q1’2024 Update: MYCI’s Leap Year Rebound
 
Data Centers - Striving Within A Narrow Range - Research Report - MCG - May 2...
Data Centers - Striving Within A Narrow Range - Research Report - MCG - May 2...Data Centers - Striving Within A Narrow Range - Research Report - MCG - May 2...
Data Centers - Striving Within A Narrow Range - Research Report - MCG - May 2...
 
Algorithmic optimizations for Dynamic Levelwise PageRank (from STICD) : SHORT...
Algorithmic optimizations for Dynamic Levelwise PageRank (from STICD) : SHORT...Algorithmic optimizations for Dynamic Levelwise PageRank (from STICD) : SHORT...
Algorithmic optimizations for Dynamic Levelwise PageRank (from STICD) : SHORT...
 
一比一原版(UniSA毕业证书)南澳大学毕业证如何办理
一比一原版(UniSA毕业证书)南澳大学毕业证如何办理一比一原版(UniSA毕业证书)南澳大学毕业证如何办理
一比一原版(UniSA毕业证书)南澳大学毕业证如何办理
 
一比一原版(CBU毕业证)不列颠海角大学毕业证成绩单
一比一原版(CBU毕业证)不列颠海角大学毕业证成绩单一比一原版(CBU毕业证)不列颠海角大学毕业证成绩单
一比一原版(CBU毕业证)不列颠海角大学毕业证成绩单
 
一比一原版(BU毕业证)波士顿大学毕业证成绩单
一比一原版(BU毕业证)波士顿大学毕业证成绩单一比一原版(BU毕业证)波士顿大学毕业证成绩单
一比一原版(BU毕业证)波士顿大学毕业证成绩单
 
Best best suvichar in gujarati english meaning of this sentence as Silk road ...
Best best suvichar in gujarati english meaning of this sentence as Silk road ...Best best suvichar in gujarati english meaning of this sentence as Silk road ...
Best best suvichar in gujarati english meaning of this sentence as Silk road ...
 
一比一原版(Deakin毕业证书)迪肯大学毕业证如何办理
一比一原版(Deakin毕业证书)迪肯大学毕业证如何办理一比一原版(Deakin毕业证书)迪肯大学毕业证如何办理
一比一原版(Deakin毕业证书)迪肯大学毕业证如何办理
 
一比一原版(TWU毕业证)西三一大学毕业证成绩单
一比一原版(TWU毕业证)西三一大学毕业证成绩单一比一原版(TWU毕业证)西三一大学毕业证成绩单
一比一原版(TWU毕业证)西三一大学毕业证成绩单
 
SOCRadar Germany 2024 Threat Landscape Report
SOCRadar Germany 2024 Threat Landscape ReportSOCRadar Germany 2024 Threat Landscape Report
SOCRadar Germany 2024 Threat Landscape Report
 
Sample_Global Non-invasive Prenatal Testing (NIPT) Market, 2019-2030.pdf
Sample_Global Non-invasive Prenatal Testing (NIPT) Market, 2019-2030.pdfSample_Global Non-invasive Prenatal Testing (NIPT) Market, 2019-2030.pdf
Sample_Global Non-invasive Prenatal Testing (NIPT) Market, 2019-2030.pdf
 
The affect of service quality and online reviews on customer loyalty in the E...
The affect of service quality and online reviews on customer loyalty in the E...The affect of service quality and online reviews on customer loyalty in the E...
The affect of service quality and online reviews on customer loyalty in the E...
 
Criminal IP - Threat Hunting Webinar.pdf
Criminal IP - Threat Hunting Webinar.pdfCriminal IP - Threat Hunting Webinar.pdf
Criminal IP - Threat Hunting Webinar.pdf
 
一比一原版(QU毕业证)皇后大学毕业证成绩单
一比一原版(QU毕业证)皇后大学毕业证成绩单一比一原版(QU毕业证)皇后大学毕业证成绩单
一比一原版(QU毕业证)皇后大学毕业证成绩单
 
Adjusting primitives for graph : SHORT REPORT / NOTES
Adjusting primitives for graph : SHORT REPORT / NOTESAdjusting primitives for graph : SHORT REPORT / NOTES
Adjusting primitives for graph : SHORT REPORT / NOTES
 

Statistical inference: Estimation

  • 2. Parameter and Statistics • A measure calculated from population data is called Parameter. • A measure calculated from sample data is called Statistic. Parameter Statistic Size N n Mean μ x̄ Standard deviation σ s Proportion P p Correlation coefficient ρ r
  • 3. Statistical Inference The method to infer about population on the basis of sample information is known as Statistical inference. It mainly consists of two parts: • Estimation • Testing of Hypothesis
  • 4. Estimation Estimation is a process whereby we select a random sample from a population and use a sample statistic to estimate a population parameter. There are two ways for estimation: • Point Estimation • Interval Estimation
  • 5. Point Estimate Point Estimate – A sample statistic used to estimate the exact value of a population parameter. • A point estimate is a single value and has the advantage of being very precise but there is no information about its reliability. • The probability that a single sample statistic actually equal to the parameter value is extremely small. For this reason point estimation is rarely used.
  • 6. Good Estimator Properties of good estimator: 1. Unbiasedness 2. Consistency 3. Sufficiency 4. Efficiency
  • 7. Unbiasedness Any sample statistic is said to be an unbiased estimator for the population parameter if on an average the value sample statistic is equal to the parameter value. e.g. 𝐸 𝑥 = 𝜇 i.e. sample mean is an unbiased estimator of population mean
  • 8. Consistency An estimator is said to be a consistent estimator for the parameter if the value of statistics gets closer to the value of the parameter and the respective variance of statistics get closer to zero as sample size increases. e.g. 𝐸 𝑥 → 𝜇 and 𝑉 𝑥 = 𝜎2 𝑛 → 0 as sample size n increases
  • 9. Sufficiency If a statistic contain almost all information regarding the population parameter that is contained in the population then the statistic is called sufficient estimator for the parameter.
  • 10. Efficiency An estimator is said to be an efficient estimator if it contains smaller variance among all variances of all other estimators.
  • 11. Interval Estimate Confidence interval (interval estimate) – A range of values defined by the confidence level within which the population parameter is estimated to fall. • The interval estimate is less precise, but gives more confidence.
  • 12. Example of Point and Interval Estimate Government wants to know the percentage of cigarette smokers among college students. If we say that there was 10% are smokers, it is a point estimate. But if we make a statement that 8% to 12% of college students are smokers, it is interval estimate.
  • 13. Sampling distribution From a population of size N, number of samples of size n can be selected and these samples give different values of a statistics. These different values of statistic can be arranged in form of a frequency distribution which is known as sampling distribution of that statistics. We can have sampling distribution of sample mean, sampling distribution of sample proportion etc.
  • 14. Standard Error of a statistics The standard deviation calculated from the observations of a sampling distribution of a statistics is called Standard Error of that statistics. E.g. The standard deviation calculated from the observations of sampling distribution of x̄ is called standard error of x̄. It is denoted by S.E.(x̄)
  • 15. Standard Error for Mean when population standard deviation (𝜎) is known S.E.( 𝑥 ) = 𝜎 𝑛 for infinite population S.E.( 𝑥 ) = 𝜎 𝑛 ∗ 𝑁−𝑛 𝑁−1 for finite population
  • 16. Standard Error for Mean when population standard deviation (𝜎) is unknown When sample size is large ( n > 30) S.E.( 𝑥 ) = 𝑠 𝑛 for infinite population S.E.( 𝑥 ) = 𝑠 𝑛 ∗ 𝑁− 𝑛 𝑁−1 for finite population When sample size is small ( n ≤ 30) S.E.( 𝑥 ) = 𝑠 𝑛−1 for infinite population S.E.( 𝑥 ) = 𝑠 𝑛−1 ∗ 𝑁− 𝑛 𝑁−1 for finite population
  • 17. Standard Error for difference between two means when population standard deviation (𝜎) is known S.E.(𝑥1 − 𝑥2) = 𝜎1 2 𝑛1 + 𝜎2 2 𝑛2
  • 18. Standard Error for difference between two means when population standard deviation (𝜎) is unknown When sample size is large ( n > 30) S.E.(𝑥1 − 𝑥2) = 𝑠1 2 𝑛1 + 𝑠2 2 𝑛2 When sample size is small ( n ≤ 30) S.E.(𝑥1 − 𝑥2) = 𝑠2( 1 𝑛1 + 1 𝑛2 ) Where 𝑠2 = 𝑛1∗𝑠1 2+𝑛2∗𝑠2 2 𝑛1+𝑛2−2
  • 19. Standard Error for Proportion S.E. (𝑝) = 𝑃𝑄 𝑛 for infinite population S.E. (𝑝) = 𝑃𝑄 𝑛 𝑁−𝑛 𝑁−1 for finite population When population proportion (𝑃) is unknown, then it is estimated by sample proportion (𝑝)
  • 20. Standard Error for difference between two proportions Population proportions are known S.E.(𝑝1 − 𝑝2) = 𝑃1 𝑄1 𝑛1 + 𝑃2 𝑄2 𝑛2 Population proportions are unknown S.E.(𝑝1 − 𝑝2) = 𝑃 ∗ 𝑄 ( 1 𝑛1 + 1 𝑛2 ) where 𝑃 = 𝑛1 𝑝1 + 𝑛2 𝑝2 𝑛1 + 𝑛2
  • 21. Interval Estimation Confidence Interval has the form: Point estimate ± Margin of error Where Margin of error = Critical value of estimate * Standard Error of estimate
  • 22. z table value 1 % 5% 10% Two tailed test (≠ ) 2.58 1.96 1.645 One tailed test ( > or < ) 2.33 1.645 1.28
  • 23.
  • 24. C.I. for Population mean (i) When Population standard deviation is known or the sample size is large 𝑥 ± 𝑍 𝛼 × S.E.( 𝑥 ) (ii) When Population standard deviation is unknown and the sample size is small 𝑥 ± 𝑡 𝛼,𝑛−1 × S.E.( 𝑥 )
  • 25. Case Study 1 A government agency was charged by the legislature with estimating the length of time it takes citizens to fill out various forms. Two hundred randomly selected adults were timed as they filled out a particular form. The times required had mean 12.8 minutes with standard deviation 1.7 minutes. Construct a 90% confidence interval for the mean time taken for all adults to fill out this form.
  • 26. Case Study 2 A thread manufacturer tests a sample of eight lengths of a certain type of thread made of blended materials and obtains a mean tensile strength of 8.2 lb with standard deviation 0.06 lb. Assuming tensile strengths are normally distributed, construct a 90% confidence interval for the mean tensile strength of this thread.
  • 27. C.I. for difference between two means (i) When Population standard deviation is known or the sample size is large (𝑥1 − 𝑥2) ± 𝑍 𝛼 × S.E.(𝑥1 − 𝑥2) (ii) When Population standard deviation is unknown and the sample size is small (𝑥1 − 𝑥2) ± 𝑡 𝛼,𝑛1+𝑛2−2 × S.E.(𝑥1 − 𝑥2)
  • 28. Case Study 1 Records of 40 used passenger cars and 40 used pickup trucks (none used commercially) were randomly selected to investigate whether there was any difference in the mean time in years that they were kept by the original owner before being sold. For cars the mean was 5.3 years with standard deviation 2.2 years. For pickup trucks the mean was 7.1 years with standard deviation 3.0 years. Construct the 95% confidence interval for the difference in the means based on these data.
  • 29. Case Study 2 A university administrator wishes to know if there is a difference in average starting salary for graduates with master’s degrees in engineering and those with master’s degrees in business. Fifteen recent graduates with master’s degree in engineering and 11 with master’s degrees in business are surveyed and the results are summarized below. Construct the 99% confidence interval for the difference in the population means based on these data. n Mean Std. dev Engineering 15 68,535 1627 Business 11 63,230 2033
  • 30. C.I. for Population proportion 𝑝 ± 𝑍 𝛼 × S.E.(𝑝)
  • 31. Case Study In a random sample of 2,300 mortgages taken out in a certain region last year, 187 were adjustable-rate mortgages. Assuming that the sample is sufficiently large, construct a 99% confidence interval for the proportion of all mortgages taken out in this region last year that were adjustable-rate mortgages.
  • 32. C.I. for difference between two proportions (𝑝1 − 𝑝2) ± 𝑍 𝛼 × S.E.(𝑝1 − 𝑝2)
  • 33. Case Study A survey for anemia prevalence among women in developing countries was conducted among African and Asian women. Out of 2100 African women, 840 were anemia and out of 1900 Asian women, 323 were anemia. Find a 95% confidence interval for the difference in proportions of all African women with anemia and all women from the Asian with anemia.