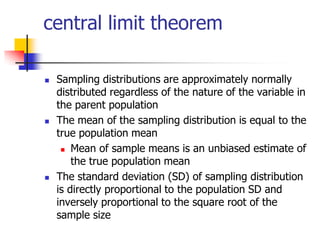
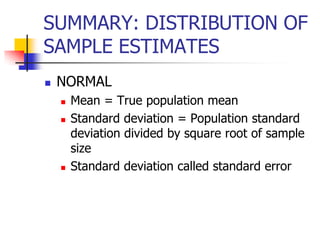
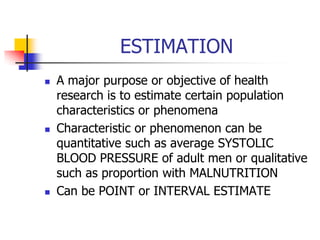
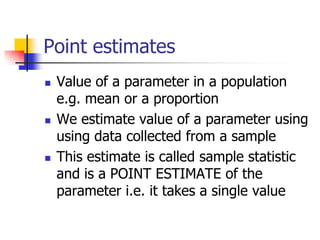
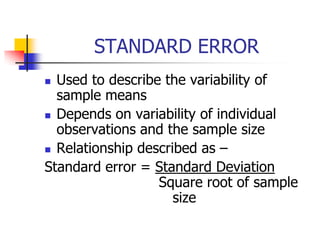
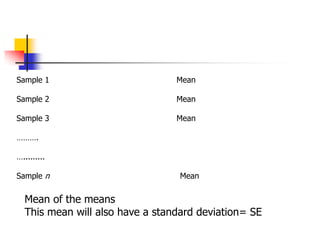
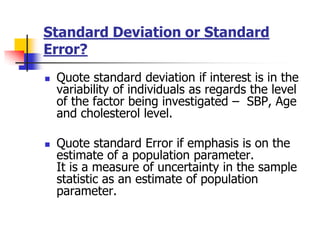
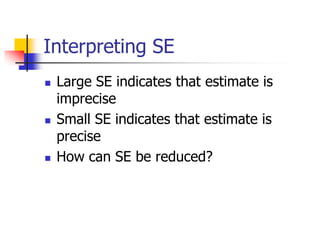
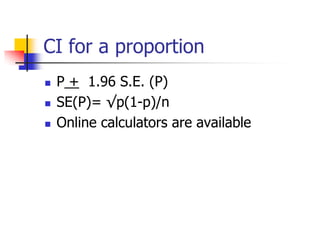
Sampling
Distributions, Standard
Error, Confidence Interval
Oyindamola Bidemi YUSUF
KAIMRC-WR
SAMPLE
 Why do we sample?
 Note: information in sample may not
fully reflect what is true in the
population
 We have introduced sampling error by
studying only some of the population
 Can we quantify this error?
SAMPLING VARIATIONS
 Taking repeated samples
 Unlikely that the estimates would be exactly
the same in each sample
 However, they should be close to the true
value
 By quantifying the variability of these
estimates, precision of estimate is obtained.
 Sampling error is thereby assessed.
SAMPLING DISTRIBUTIONS
 Distribution of sample estimates
- Means
- Proportions
- Variance
 Take repeated samples and calculate
estimates
 Distribution is approximately normal
 Mathematicians have examined the
distribution of these sample estimates
and their results are expressed in the
central limit theorem
 Sampling distributions are approximately normally
distributed regardless of the nature of the variable in
the parent population
 The mean of the sampling distribution is equal to the
true population mean
 Mean of sample means is an unbiased estimate of
the true population mean
 The standard deviation (SD) of sampling distribution
is directly proportional to the population SD and
inversely proportional to the square root of the
sample size
SUMMARY: DISTRIBUTION OF
SAMPLE ESTIMATES
 NORMAL
 Mean = True population mean
 Standard deviation = Population standard
deviation divided by square root of sample
size
 Standard deviation called standard error
ESTIMATION
 A major purpose or objective of health
research is to estimate certain population
characteristics or phenomena
 Characteristic or phenomenon can be
quantitative such as average SYSTOLIC
BLOOD PRESSURE of adult men or qualitative
such as proportion with MALNUTRITION
 Can be POINT or INTERVAL ESTIMATE
Point estimates
 Value of a parameter in a population
e.g. mean or a proportion
 We estimate value of a parameter using
using data collected from a sample
 This estimate is called sample statistic
and is a POINT ESTIMATE of the
parameter i.e. it takes a single value
STANDARD ERROR
 Used to describe the variability of
sample means
 Depends on variability of individual
observations and the sample size
 Relationship described as –
Standard error = Standard Deviation
Square root of sample
size
Sample 1 Mean
Sample 2 Mean
Sample 3 Mean
……….
….........
Sample n Mean
Standard error
Mean of the means
Mean of the means
This mean will also have a standard deviation= SE
Standard error
Standard Deviation or Standard
Error?
 Quote standard deviation if interest is in the
variability of individuals as regards the level
of the factor being investigated – SBP, Age
and cholesterol level.
 Quote standard Error if emphasis is on the
estimate of a population parameter.
It is a measure of uncertainty in the sample
statistic as an estimate of population
parameter.
Interpreting SE
 Large SE indicates that estimate is
imprecise
 Small SE indicates that estimate is
precise
 How can SE be reduced?
Answer
 If sample size is increased
 If data is less variable
INTERVAL ESTIMATE
 Is SE particularly useful?
 More helpful to incorporate this measure of
precision into an interval estimate for the
population parameter
 How?
 By using the knowledge of the theoretical
probability distribution of the sample statistic to
calculate a CI
 Not sufficient to rely on a single
estimate
 Other samples could yield plausible
estimates
 Comfortable to find a range of values
within which to find all possible mean
values
WHAT IS A CONFIDENCE
INTERVAL?
 The CI is a range of values, above and below a
finding, in which the actual value is likely to fall.
 The confidence interval represents the accuracy or
precision of an estimate.
 Only by convention that the 95% confidence level
is commonly chosen.
 Researchers are confident that if other surveys
had been done, then 95 per cent of the time — or
19 times out of 20 — the findings would fall in this
range.
CONFIDENCE INTERVAL
 Statistic + 1.96 S.E. (Statistic)
 95% of the distribution of sample
means lies within 1.96 SD of the
population mean
Interpretation
 If experiment is repeated many times,
the interval would contain the true
population mean on 95% of occasions
 i.e. a range of values within which we
are 95% certain that the true
population mean lies
Issues in CI interpretation
 How wide is it? A wide CI indicates that
estimate is imprecise
 A narrow one indicates a precise
estimate
 Width is dependent on size of SE, which
in turn depends on SS
Factors affecting CI
 A narrow or small confidence interval
indicates that if we were to ask the same
question of a different sample, we are
reasonably sure we would get a similar result.
 A wide confidence interval indicates that we
are less sure and perhaps information needs
to be collected from a larger number of
people to increase our confidence.
 Confidence intervals are influenced by
the number of people that are being
surveyed.
 Typically, larger surveys will produce
estimates with smaller confidence
intervals compared to smaller surveys.
Why are CIs important
 Because confidence intervals represent
the range of values scores that are
likely if we were to repeat the survey.
 Important to consider when
generalizing results.
 Consider random sampling and
application of correct statistical test
 Like comfort zones that encompass the
true population parameter
Calculating confidence limits
 The mean diastolic blood pressure from
16 subjects is 90.0 mm Hg, and the
standard deviation is 14 mm Hg.
Calculate its standard error and 95%
confidence limits.
Standard error = Standard Deviation
Square root of sample
size
14
√16
 95% CI: Statistic + 1.96 S.E. (Statistic)
ANWERS
 Standard error – 3.5
 95% confidence limits – 82.55 to 97.46
CI for a proportion
 P + 1.96 S.E. (P)
 SE(P)= √p(1-p)/n
 Online calculators are available
In summary
 SD versus SE
 Meaning and interpretation of CI
 Shopping for the right sampling
distribution
 THANK YOU

RSS Hypothessis testing

  • 1.
    Sampling Distributions, Standard Error, ConfidenceInterval Oyindamola Bidemi YUSUF KAIMRC-WR
  • 3.
    SAMPLE  Why dowe sample?  Note: information in sample may not fully reflect what is true in the population  We have introduced sampling error by studying only some of the population  Can we quantify this error?
  • 4.
    SAMPLING VARIATIONS  Takingrepeated samples  Unlikely that the estimates would be exactly the same in each sample  However, they should be close to the true value  By quantifying the variability of these estimates, precision of estimate is obtained.  Sampling error is thereby assessed.
  • 5.
    SAMPLING DISTRIBUTIONS  Distributionof sample estimates - Means - Proportions - Variance  Take repeated samples and calculate estimates  Distribution is approximately normal
  • 6.
     Mathematicians haveexamined the distribution of these sample estimates and their results are expressed in the central limit theorem
  • 7.
    central limit theorem Sampling distributions are approximately normally distributed regardless of the nature of the variable in the parent population  The mean of the sampling distribution is equal to the true population mean  Mean of sample means is an unbiased estimate of the true population mean  The standard deviation (SD) of sampling distribution is directly proportional to the population SD and inversely proportional to the square root of the sample size
  • 8.
    SUMMARY: DISTRIBUTION OF SAMPLEESTIMATES  NORMAL  Mean = True population mean  Standard deviation = Population standard deviation divided by square root of sample size  Standard deviation called standard error
  • 9.
    ESTIMATION  A majorpurpose or objective of health research is to estimate certain population characteristics or phenomena  Characteristic or phenomenon can be quantitative such as average SYSTOLIC BLOOD PRESSURE of adult men or qualitative such as proportion with MALNUTRITION  Can be POINT or INTERVAL ESTIMATE
  • 10.
    Point estimates  Valueof a parameter in a population e.g. mean or a proportion  We estimate value of a parameter using using data collected from a sample  This estimate is called sample statistic and is a POINT ESTIMATE of the parameter i.e. it takes a single value
  • 11.
    STANDARD ERROR  Usedto describe the variability of sample means  Depends on variability of individual observations and the sample size  Relationship described as – Standard error = Standard Deviation Square root of sample size
  • 12.
    Sample 1 Mean Sample2 Mean Sample 3 Mean ………. …......... Sample n Mean Standard error Mean of the means Mean of the means This mean will also have a standard deviation= SE Standard error
  • 13.
    Standard Deviation orStandard Error?  Quote standard deviation if interest is in the variability of individuals as regards the level of the factor being investigated – SBP, Age and cholesterol level.  Quote standard Error if emphasis is on the estimate of a population parameter. It is a measure of uncertainty in the sample statistic as an estimate of population parameter.
  • 14.
    Interpreting SE  LargeSE indicates that estimate is imprecise  Small SE indicates that estimate is precise  How can SE be reduced?
  • 15.
    Answer  If samplesize is increased  If data is less variable
  • 16.
    INTERVAL ESTIMATE  IsSE particularly useful?  More helpful to incorporate this measure of precision into an interval estimate for the population parameter  How?  By using the knowledge of the theoretical probability distribution of the sample statistic to calculate a CI
  • 17.
     Not sufficientto rely on a single estimate  Other samples could yield plausible estimates  Comfortable to find a range of values within which to find all possible mean values
  • 18.
    WHAT IS ACONFIDENCE INTERVAL?  The CI is a range of values, above and below a finding, in which the actual value is likely to fall.  The confidence interval represents the accuracy or precision of an estimate.  Only by convention that the 95% confidence level is commonly chosen.  Researchers are confident that if other surveys had been done, then 95 per cent of the time — or 19 times out of 20 — the findings would fall in this range.
  • 19.
    CONFIDENCE INTERVAL  Statistic+ 1.96 S.E. (Statistic)  95% of the distribution of sample means lies within 1.96 SD of the population mean
  • 20.
    Interpretation  If experimentis repeated many times, the interval would contain the true population mean on 95% of occasions  i.e. a range of values within which we are 95% certain that the true population mean lies
  • 21.
    Issues in CIinterpretation  How wide is it? A wide CI indicates that estimate is imprecise  A narrow one indicates a precise estimate  Width is dependent on size of SE, which in turn depends on SS
  • 22.
    Factors affecting CI A narrow or small confidence interval indicates that if we were to ask the same question of a different sample, we are reasonably sure we would get a similar result.  A wide confidence interval indicates that we are less sure and perhaps information needs to be collected from a larger number of people to increase our confidence.
  • 23.
     Confidence intervalsare influenced by the number of people that are being surveyed.  Typically, larger surveys will produce estimates with smaller confidence intervals compared to smaller surveys.
  • 24.
    Why are CIsimportant  Because confidence intervals represent the range of values scores that are likely if we were to repeat the survey.  Important to consider when generalizing results.  Consider random sampling and application of correct statistical test  Like comfort zones that encompass the true population parameter
  • 25.
    Calculating confidence limits The mean diastolic blood pressure from 16 subjects is 90.0 mm Hg, and the standard deviation is 14 mm Hg. Calculate its standard error and 95% confidence limits.
  • 26.
    Standard error =Standard Deviation Square root of sample size 14 √16
  • 27.
     95% CI:Statistic + 1.96 S.E. (Statistic)
  • 28.
    ANWERS  Standard error– 3.5  95% confidence limits – 82.55 to 97.46
  • 29.
    CI for aproportion  P + 1.96 S.E. (P)  SE(P)= √p(1-p)/n  Online calculators are available
  • 30.
    In summary  SDversus SE  Meaning and interpretation of CI  Shopping for the right sampling distribution
  • 31.