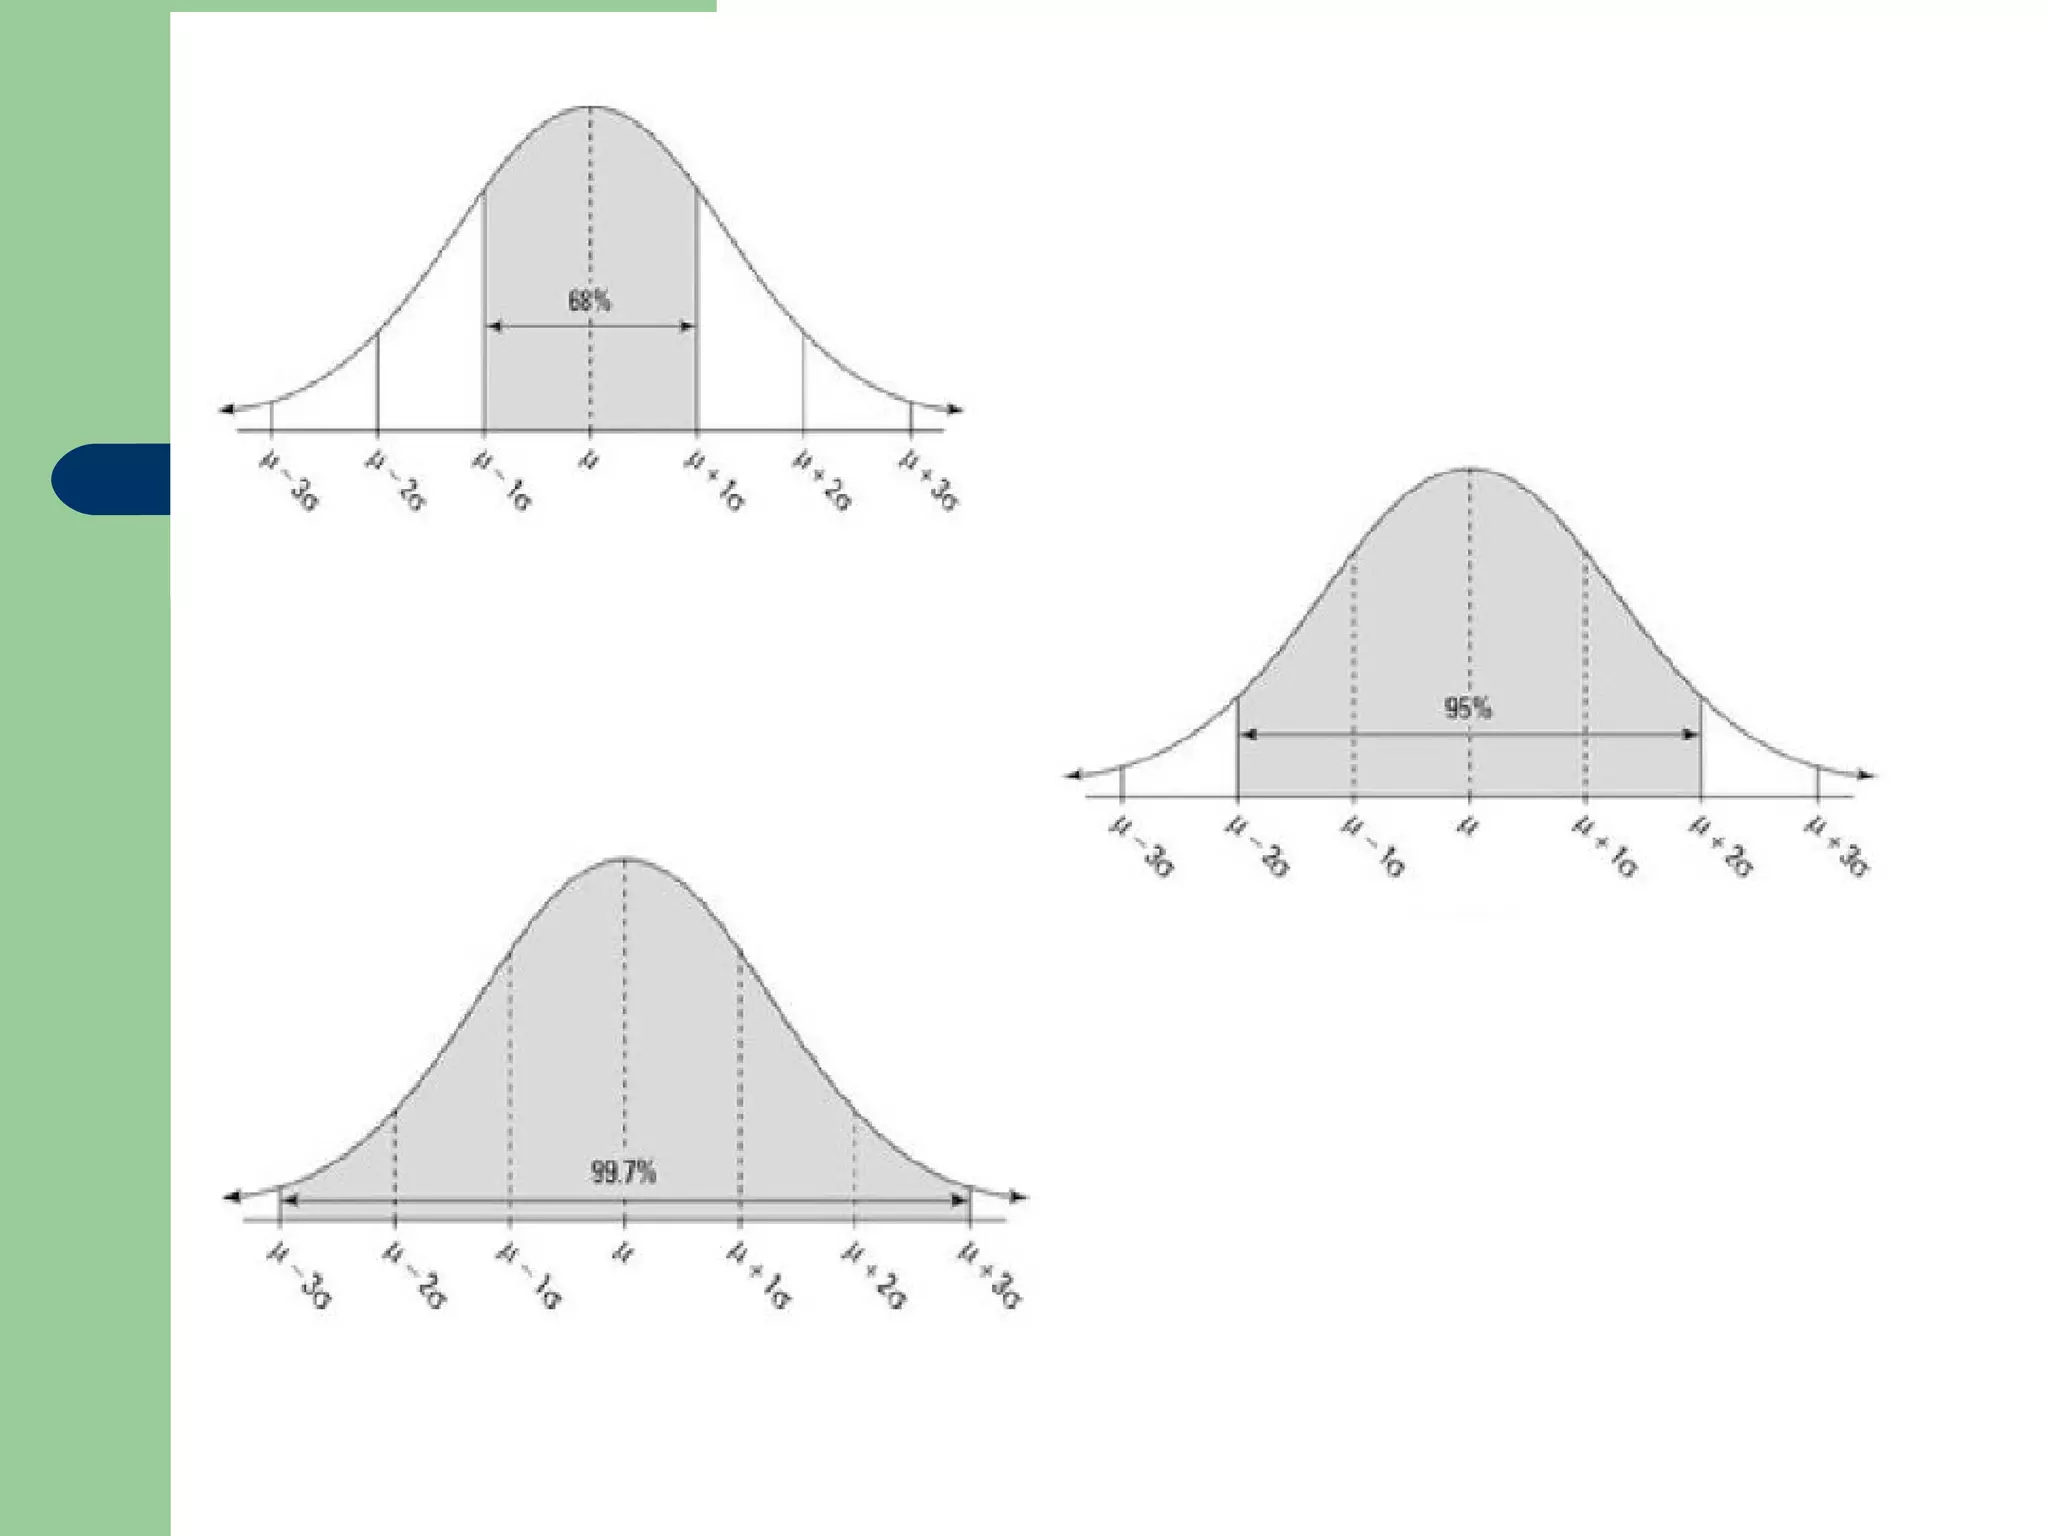
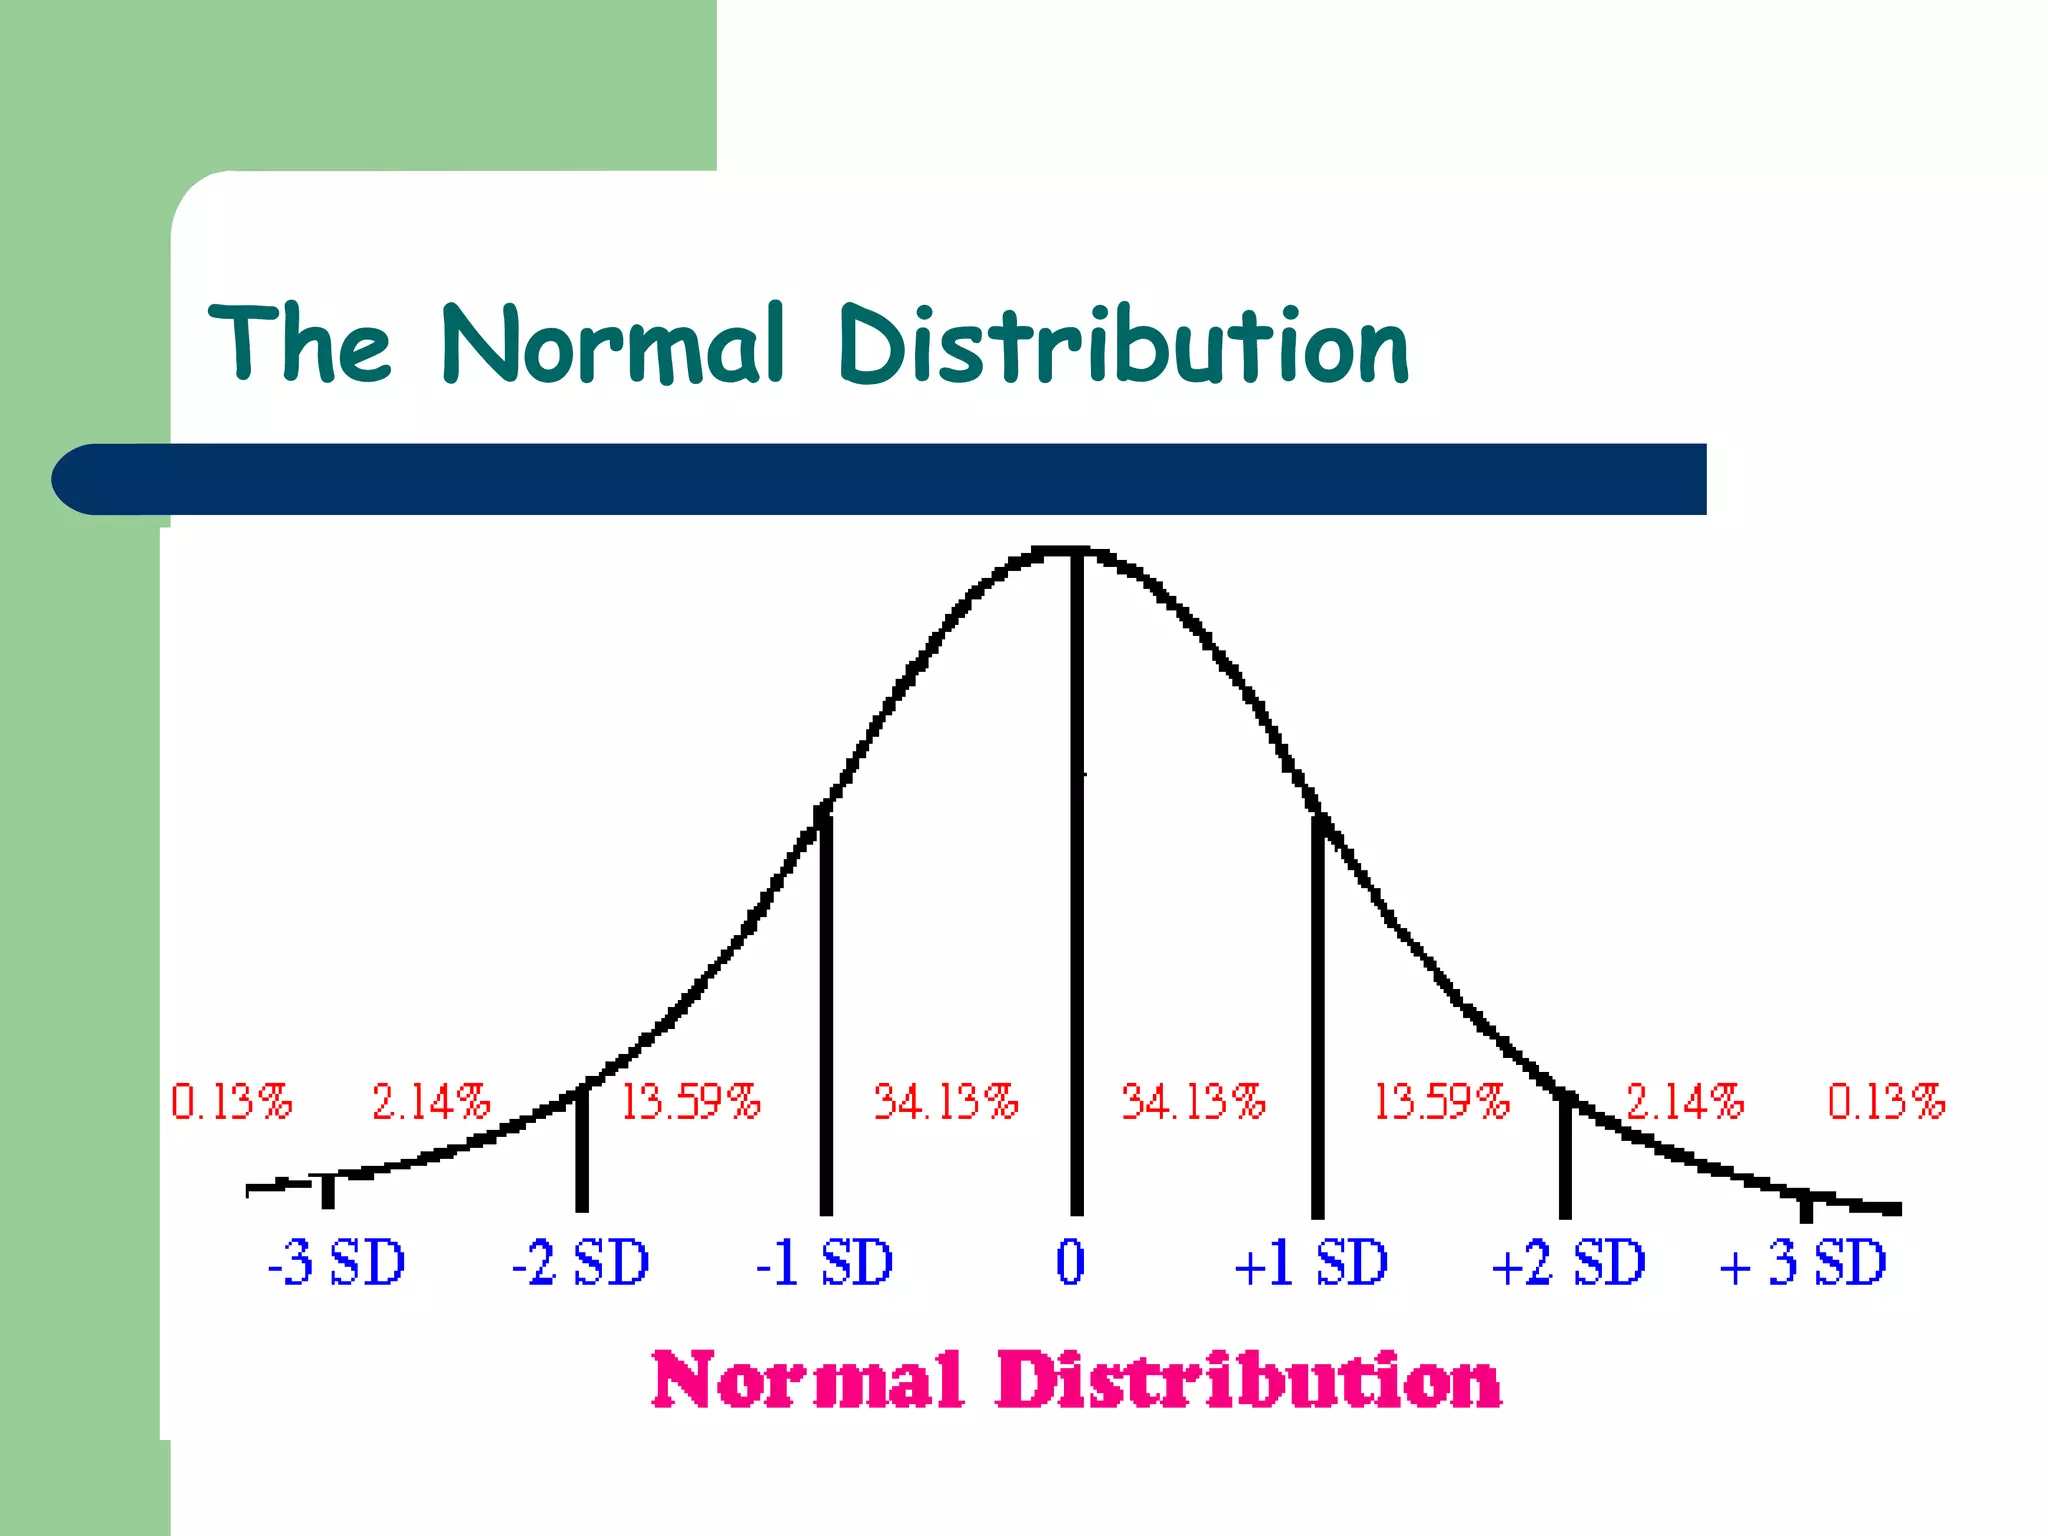
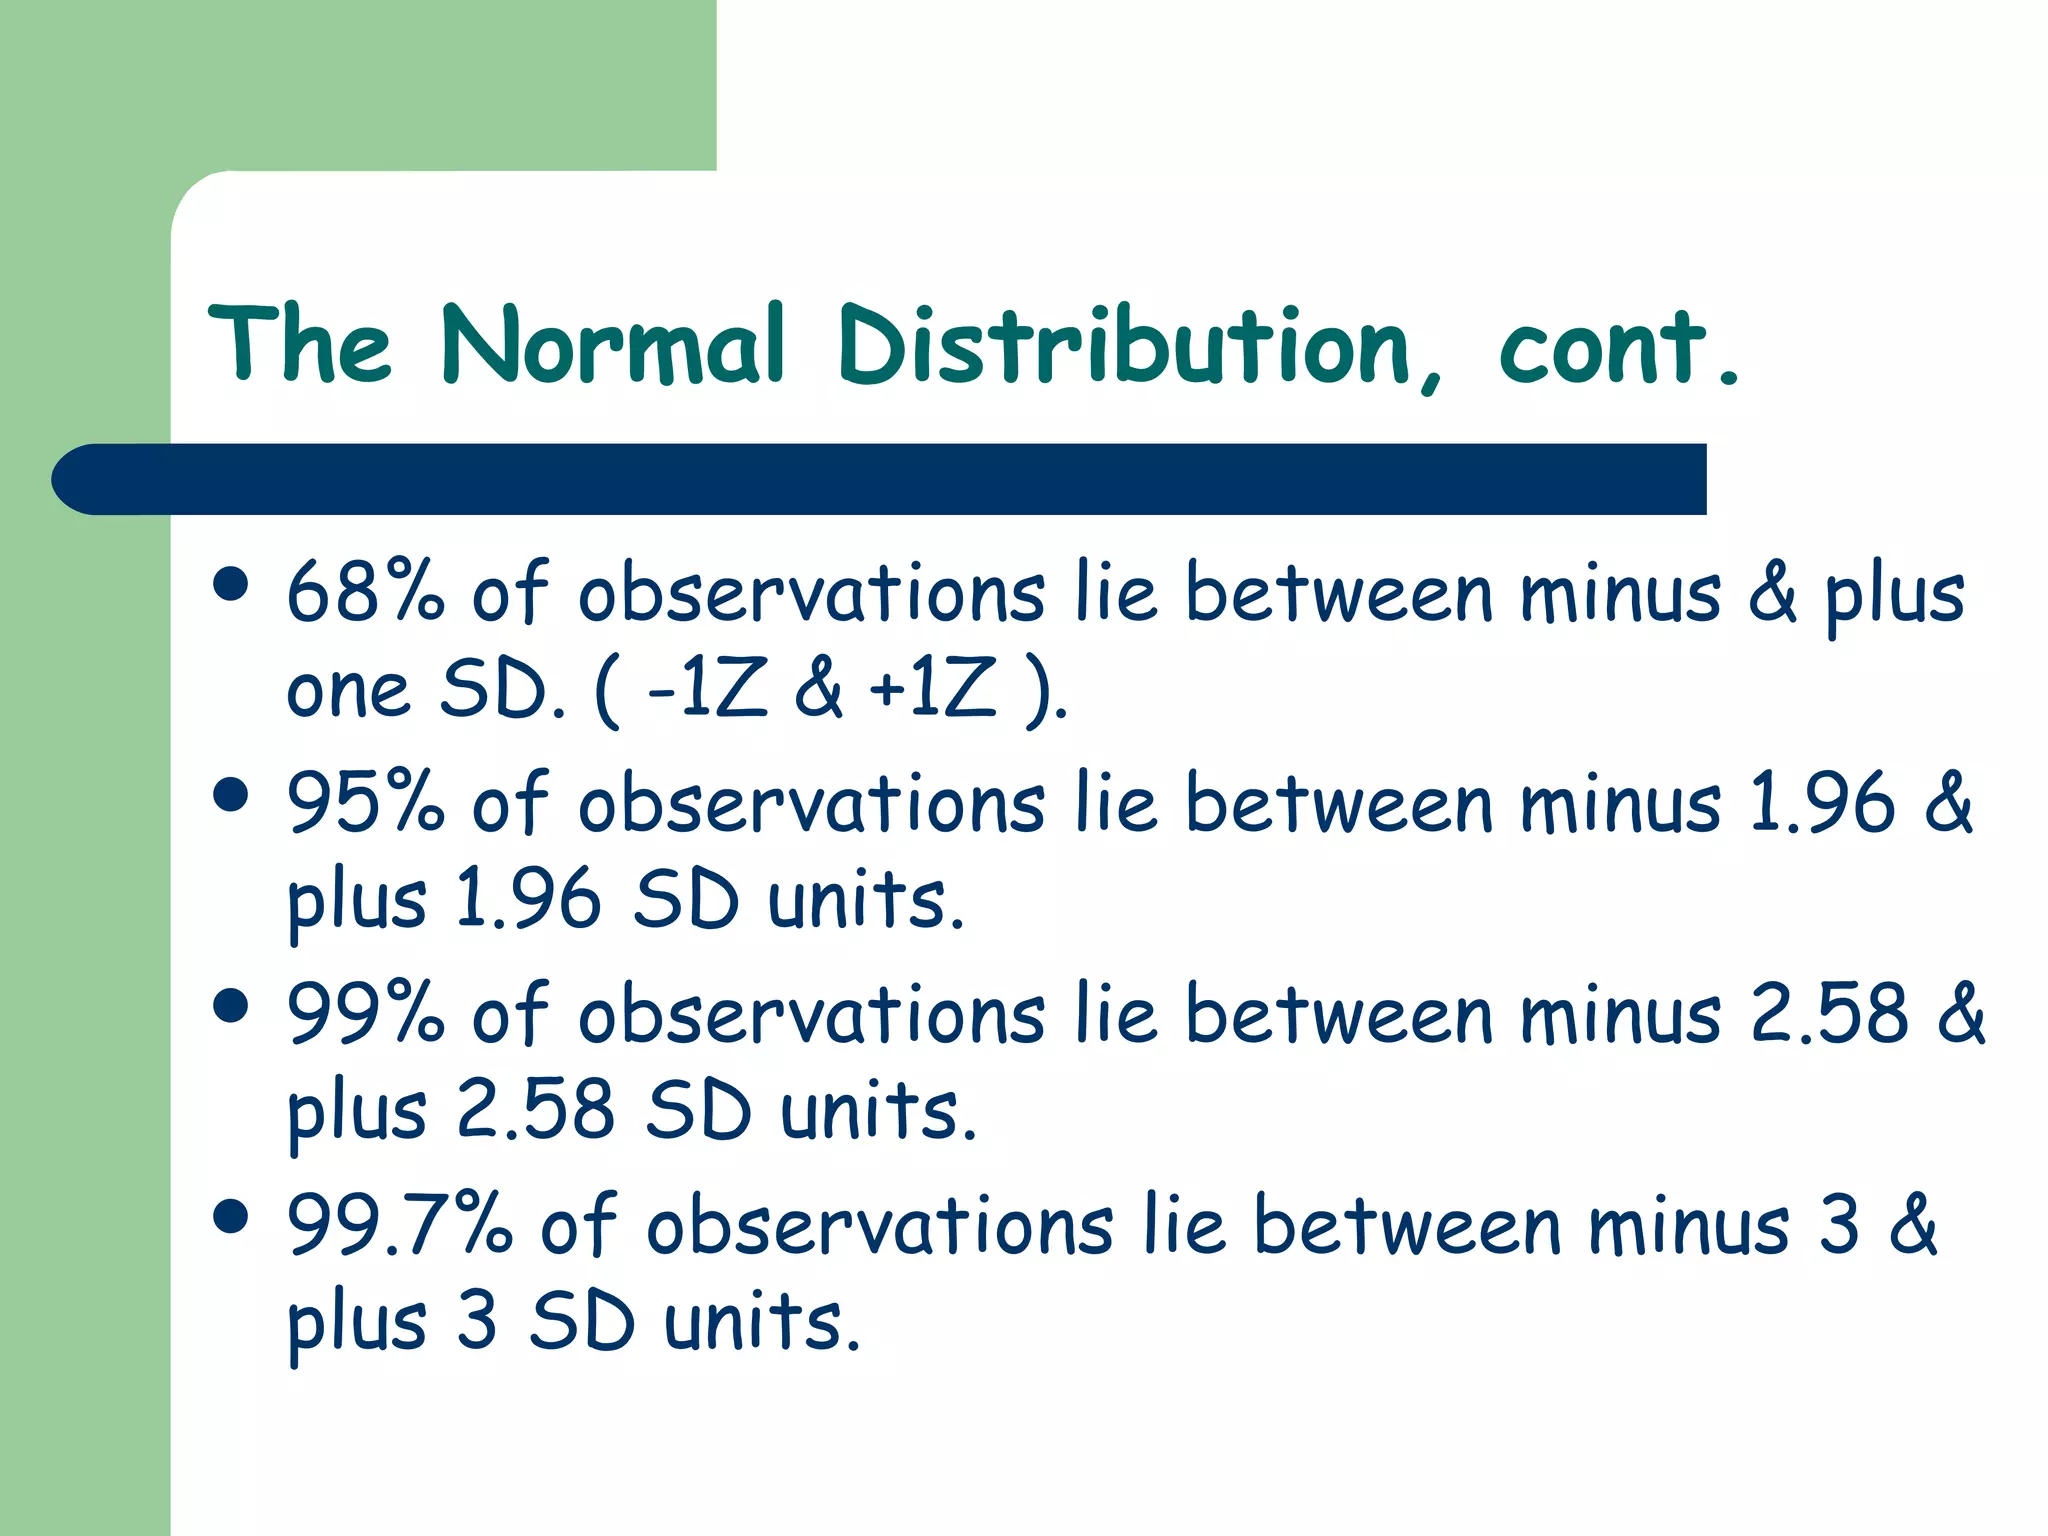
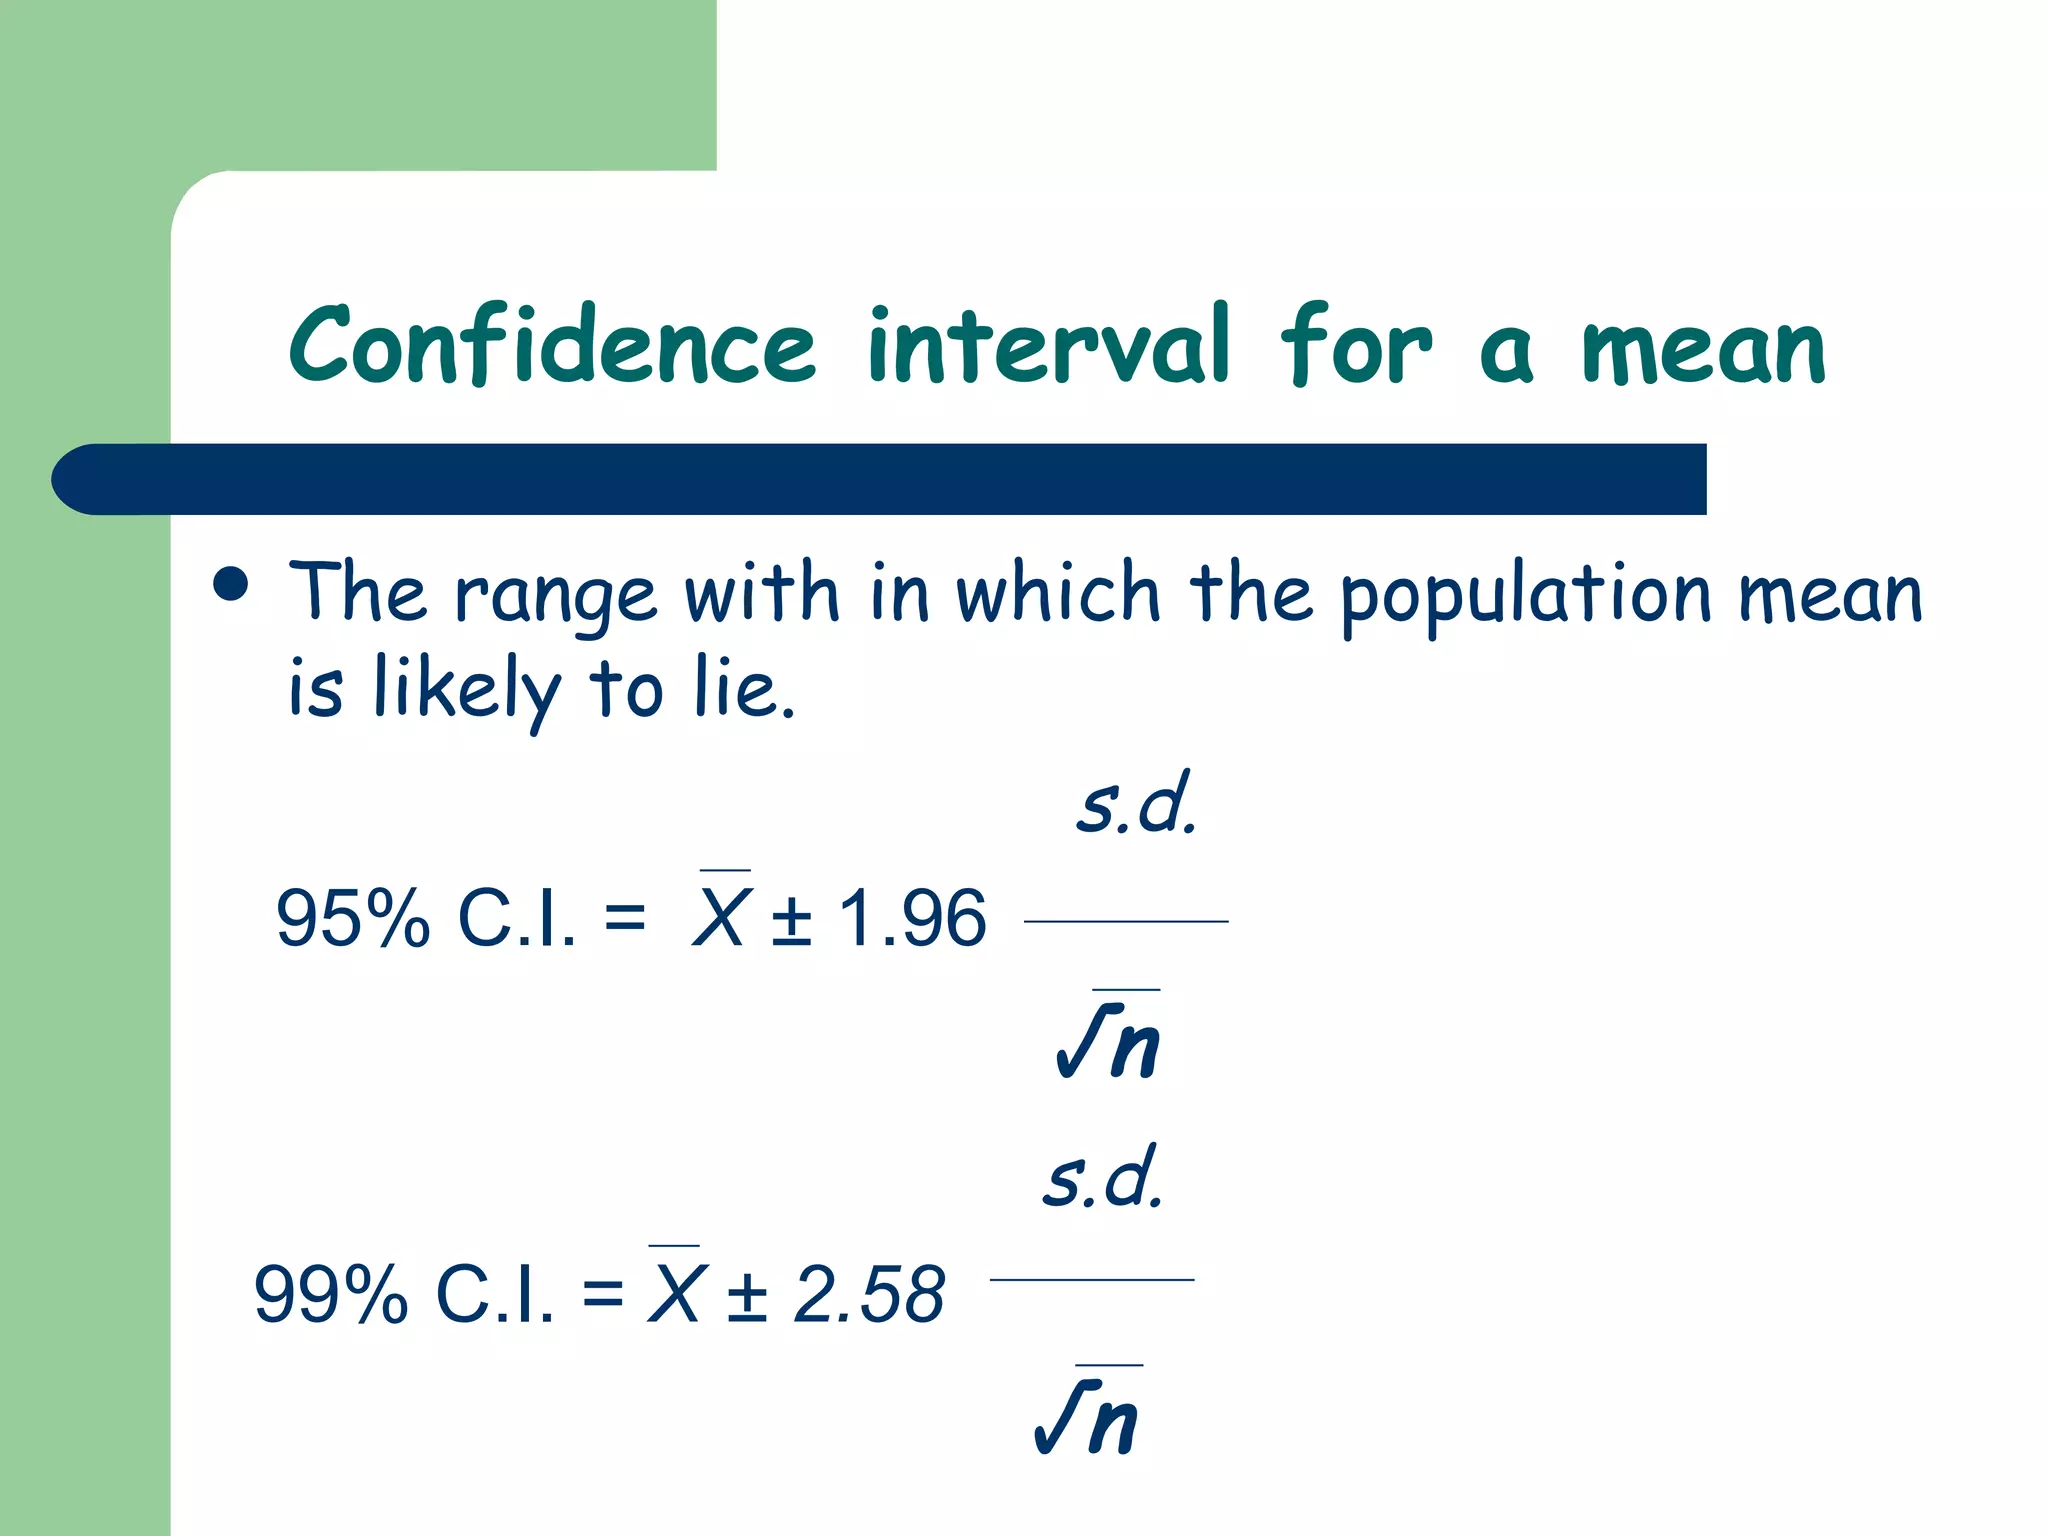
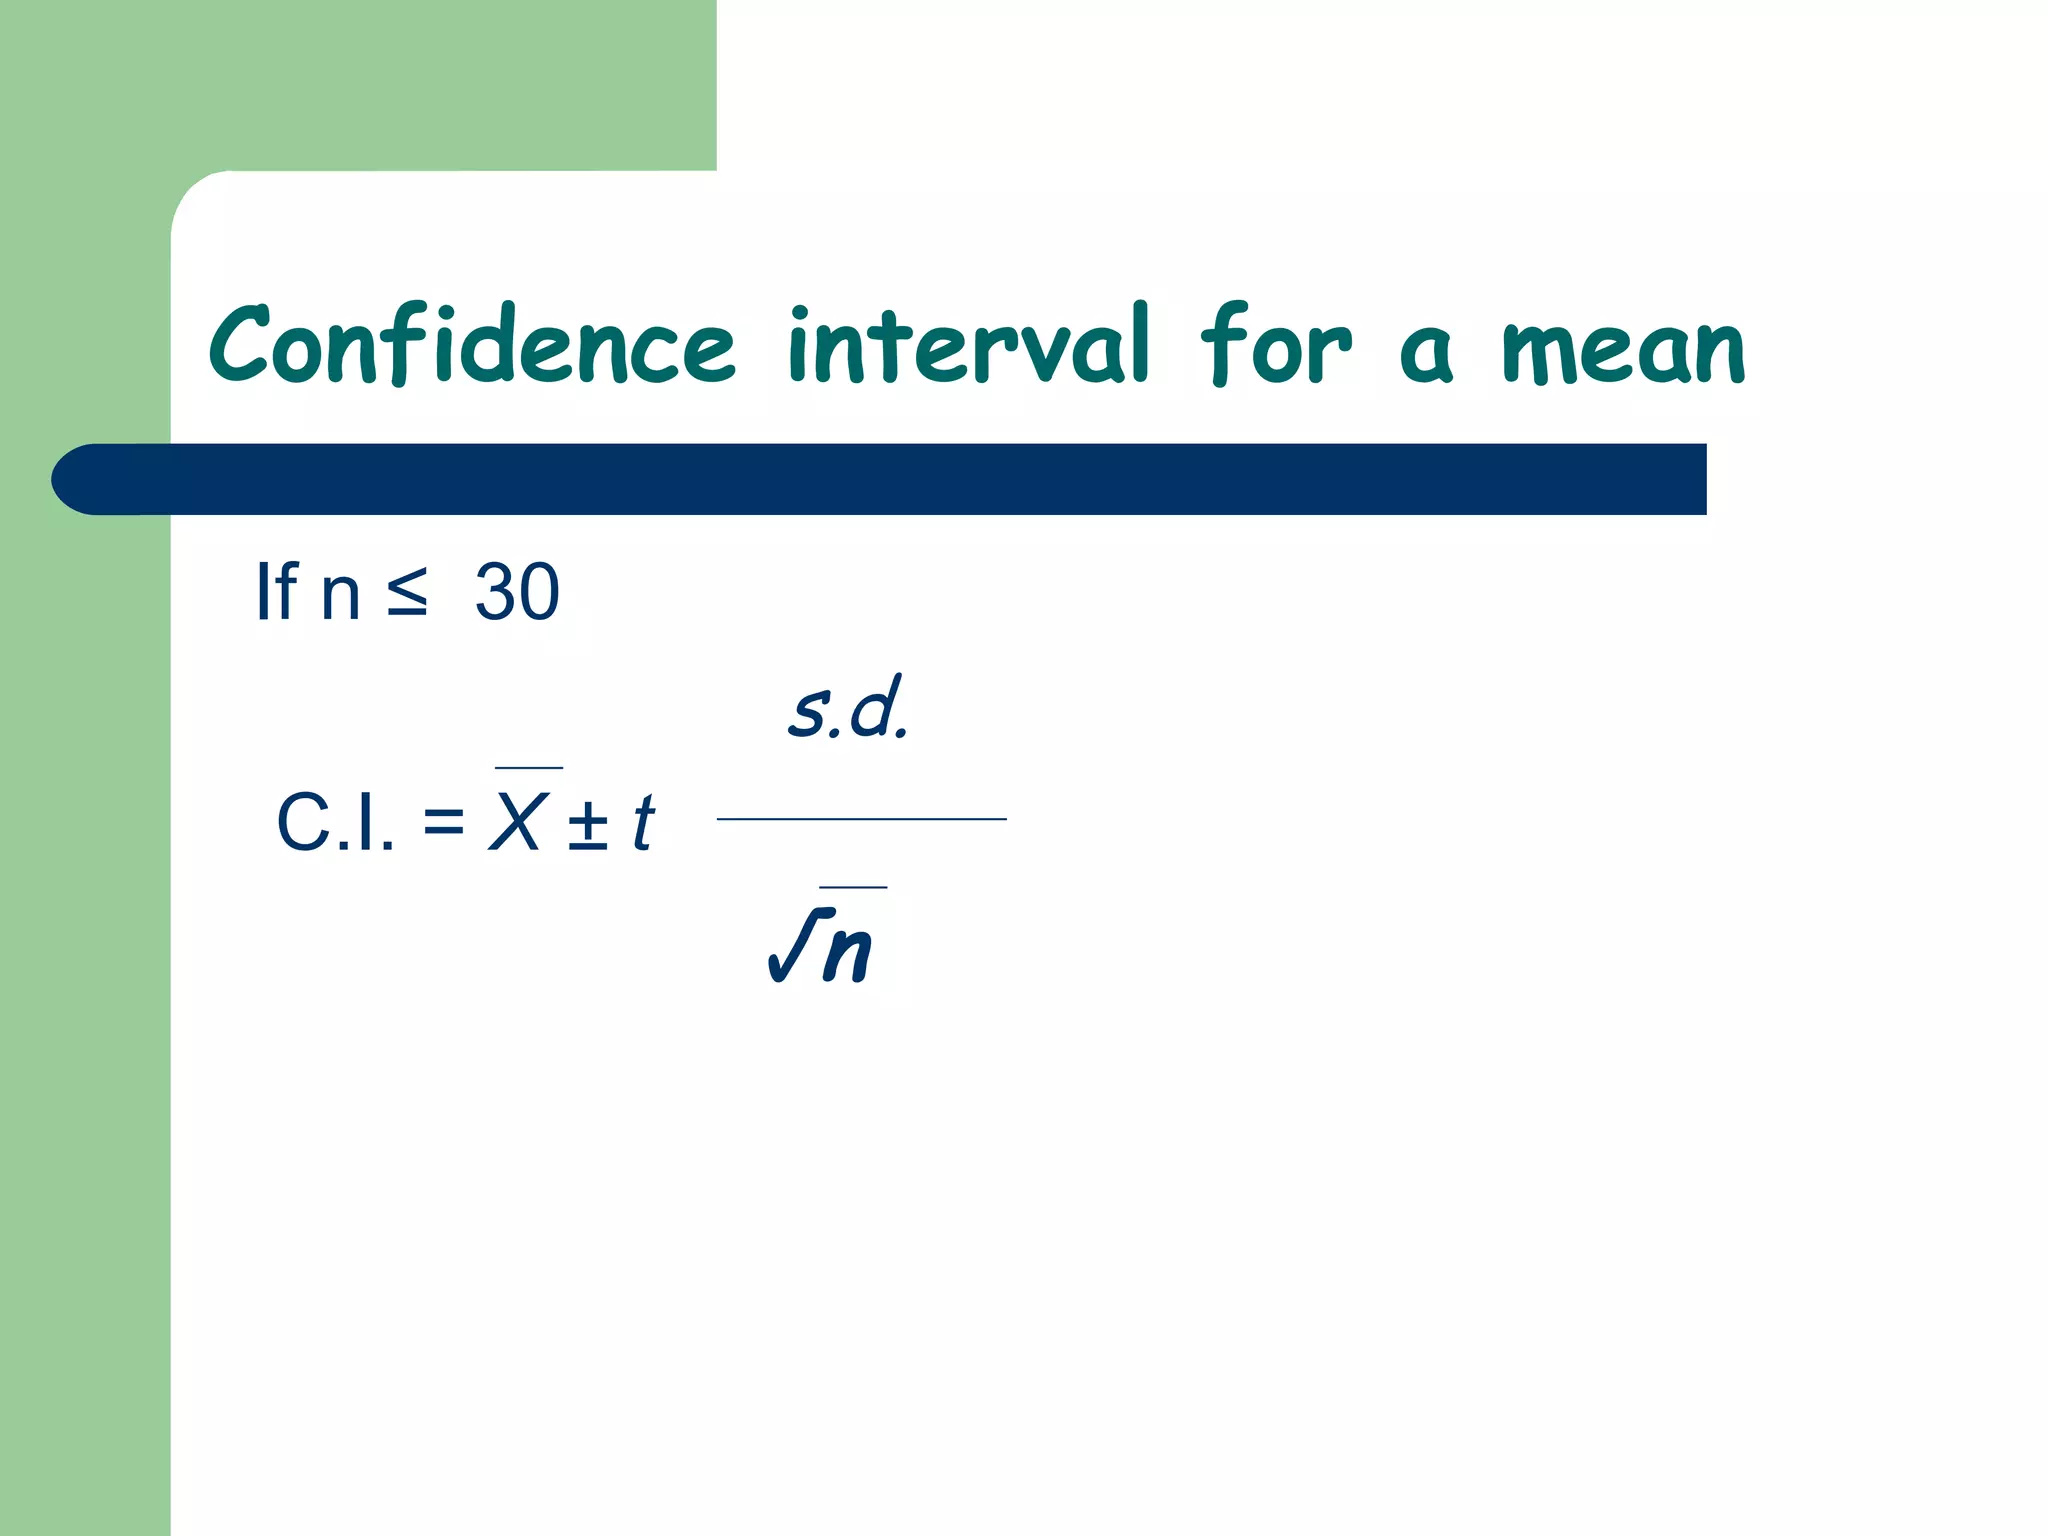
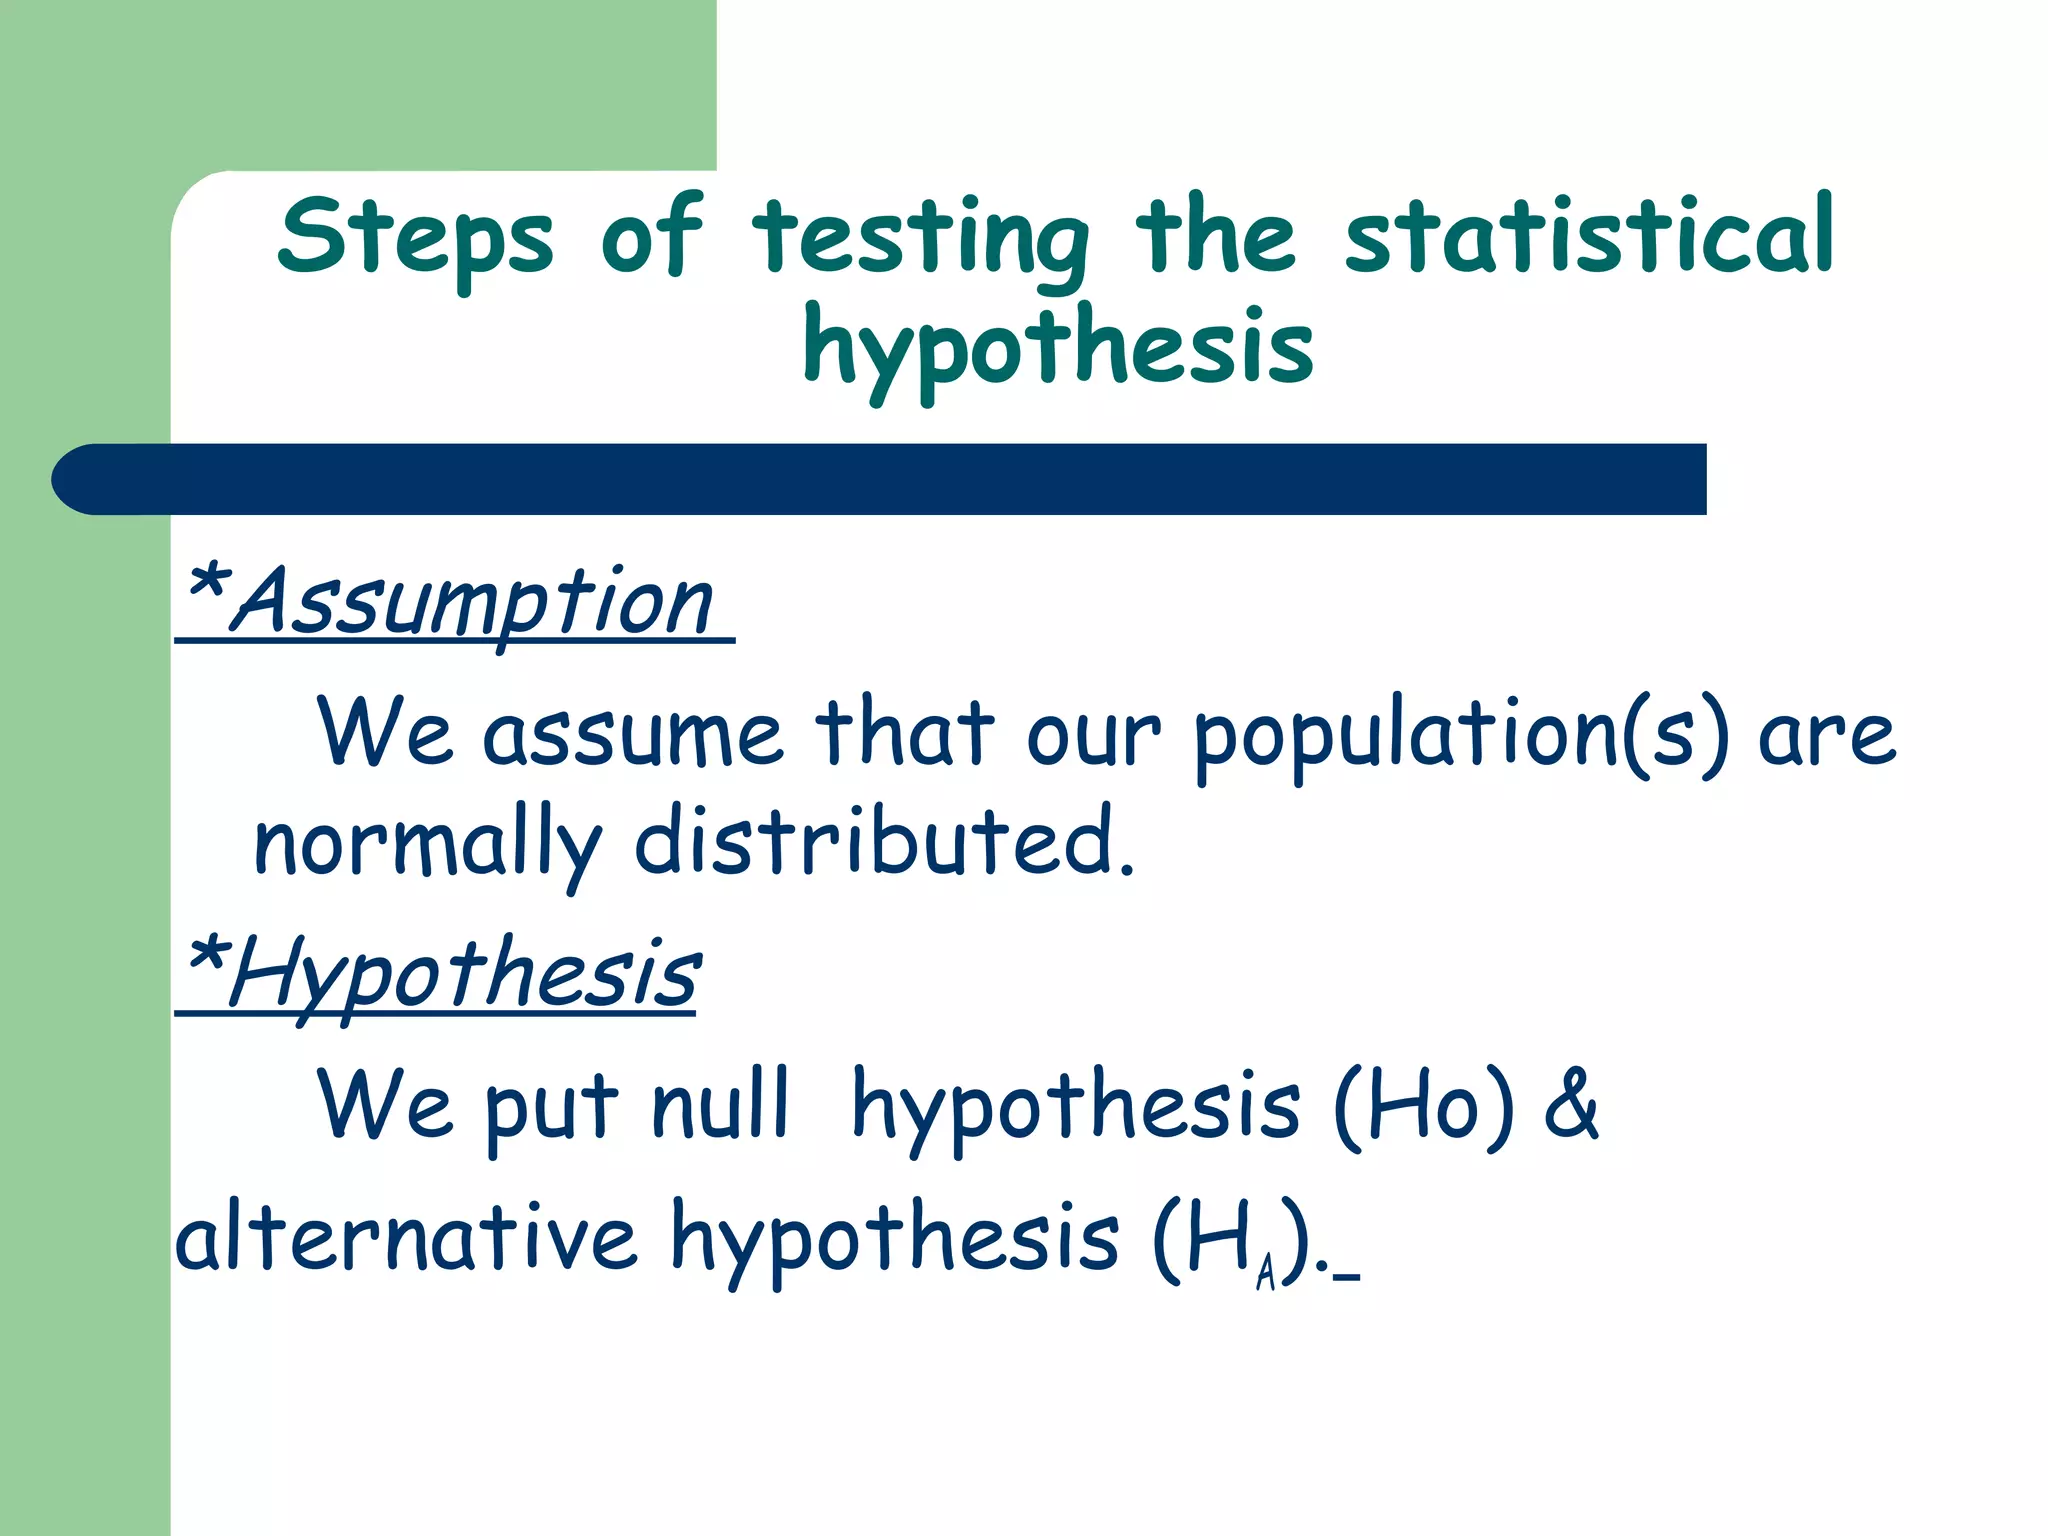
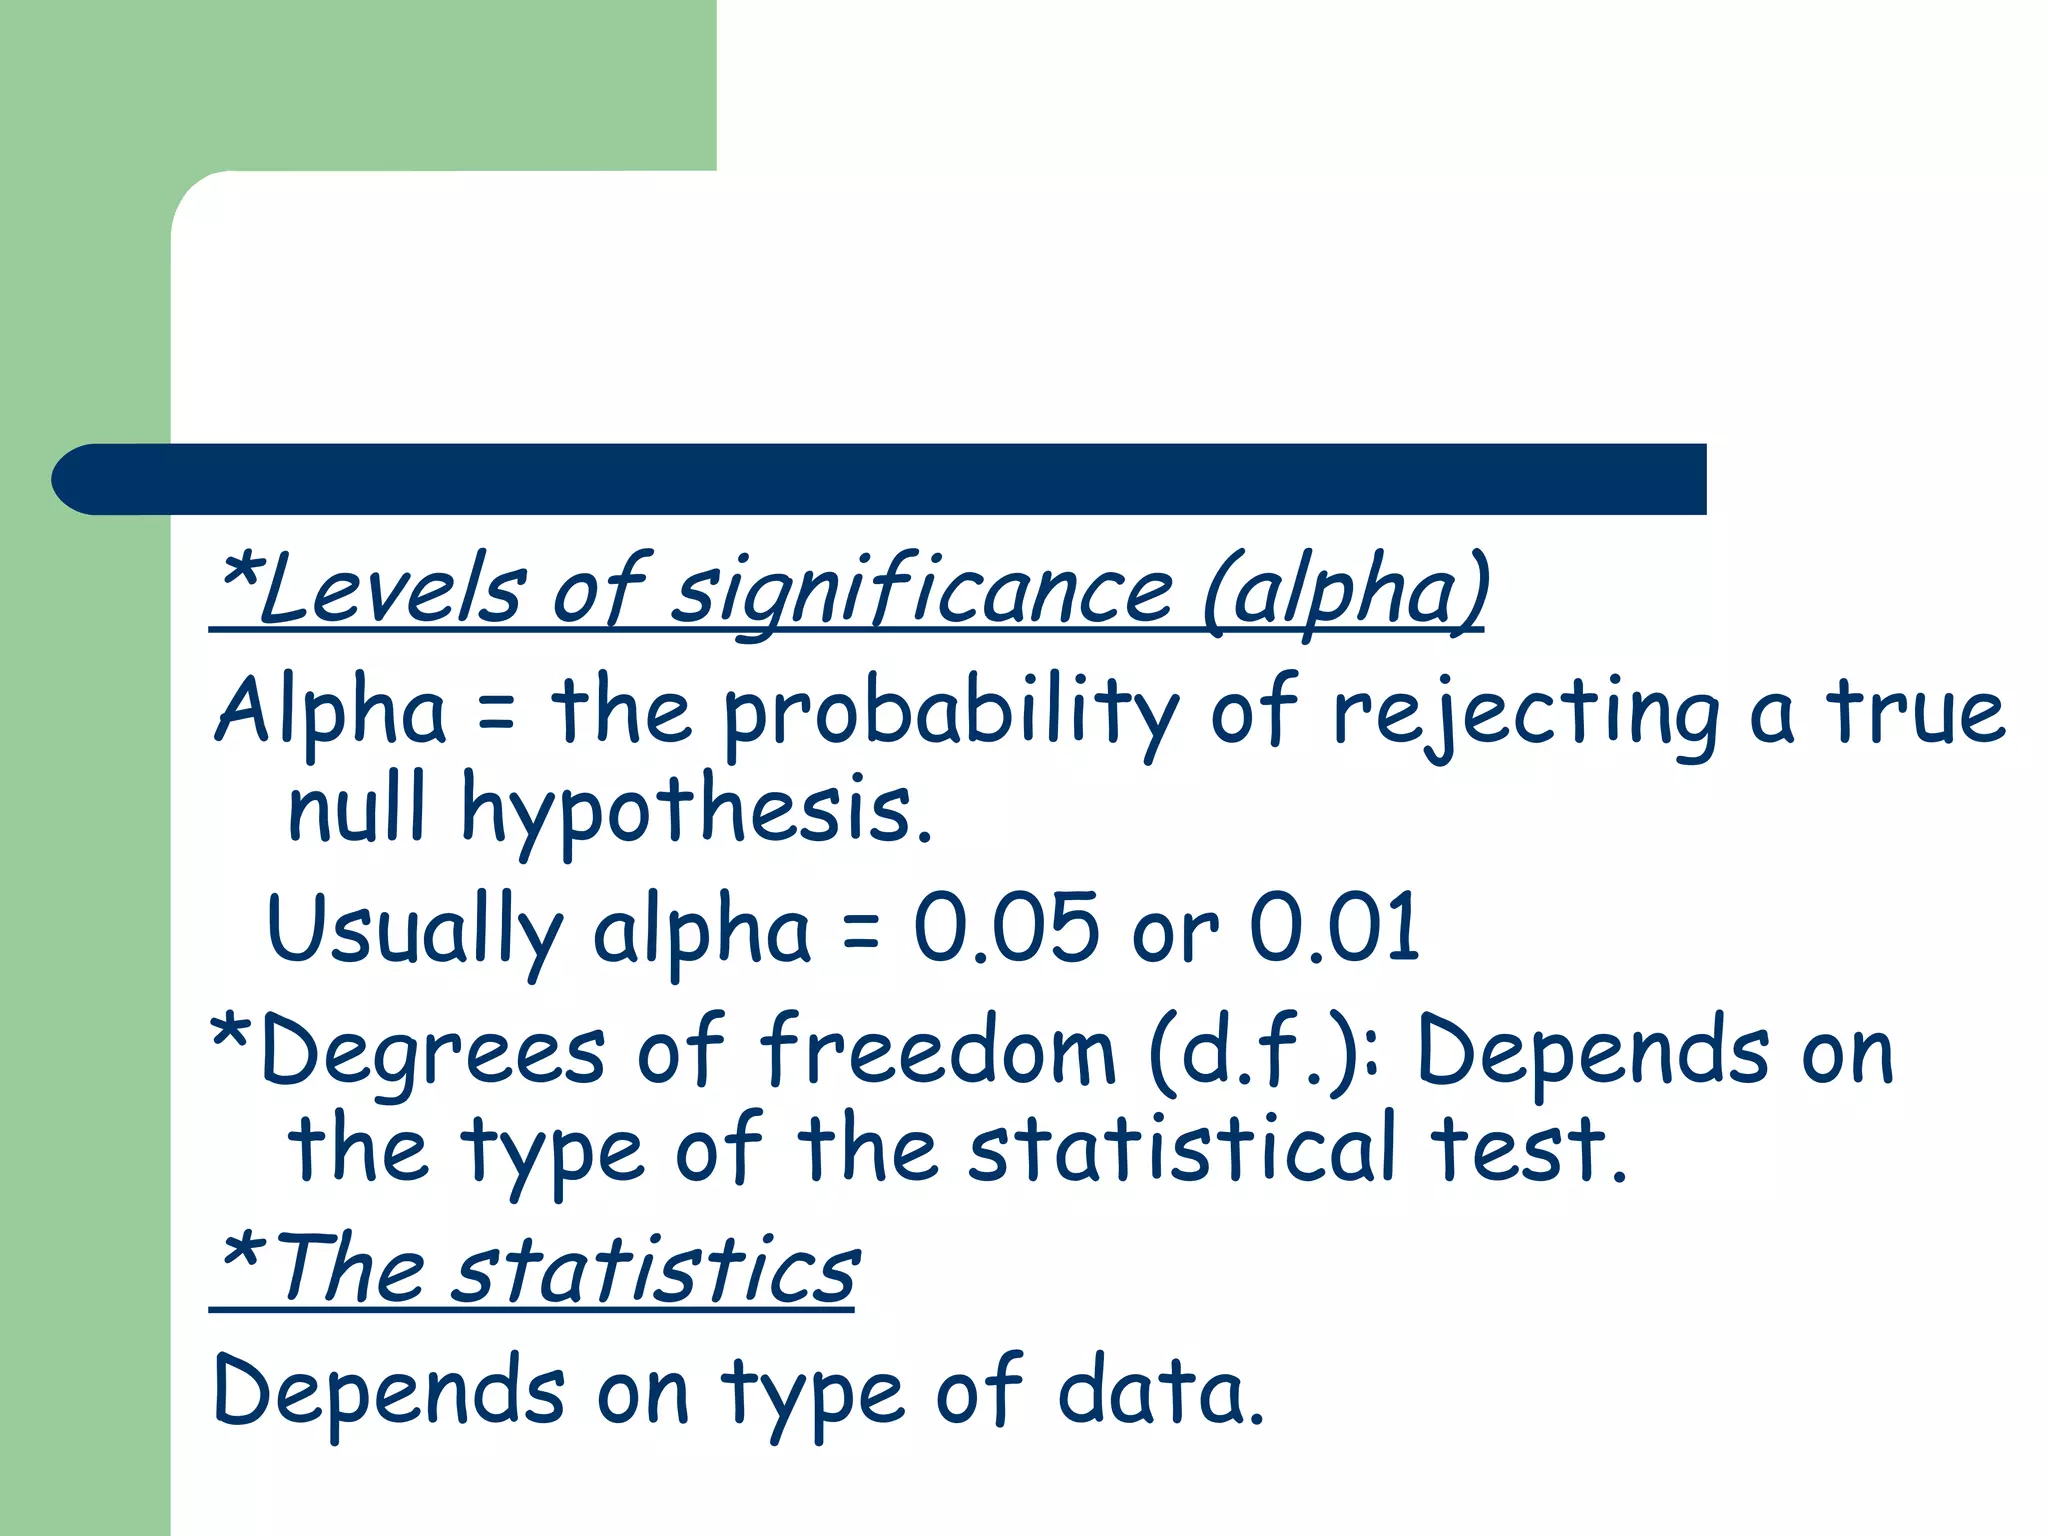
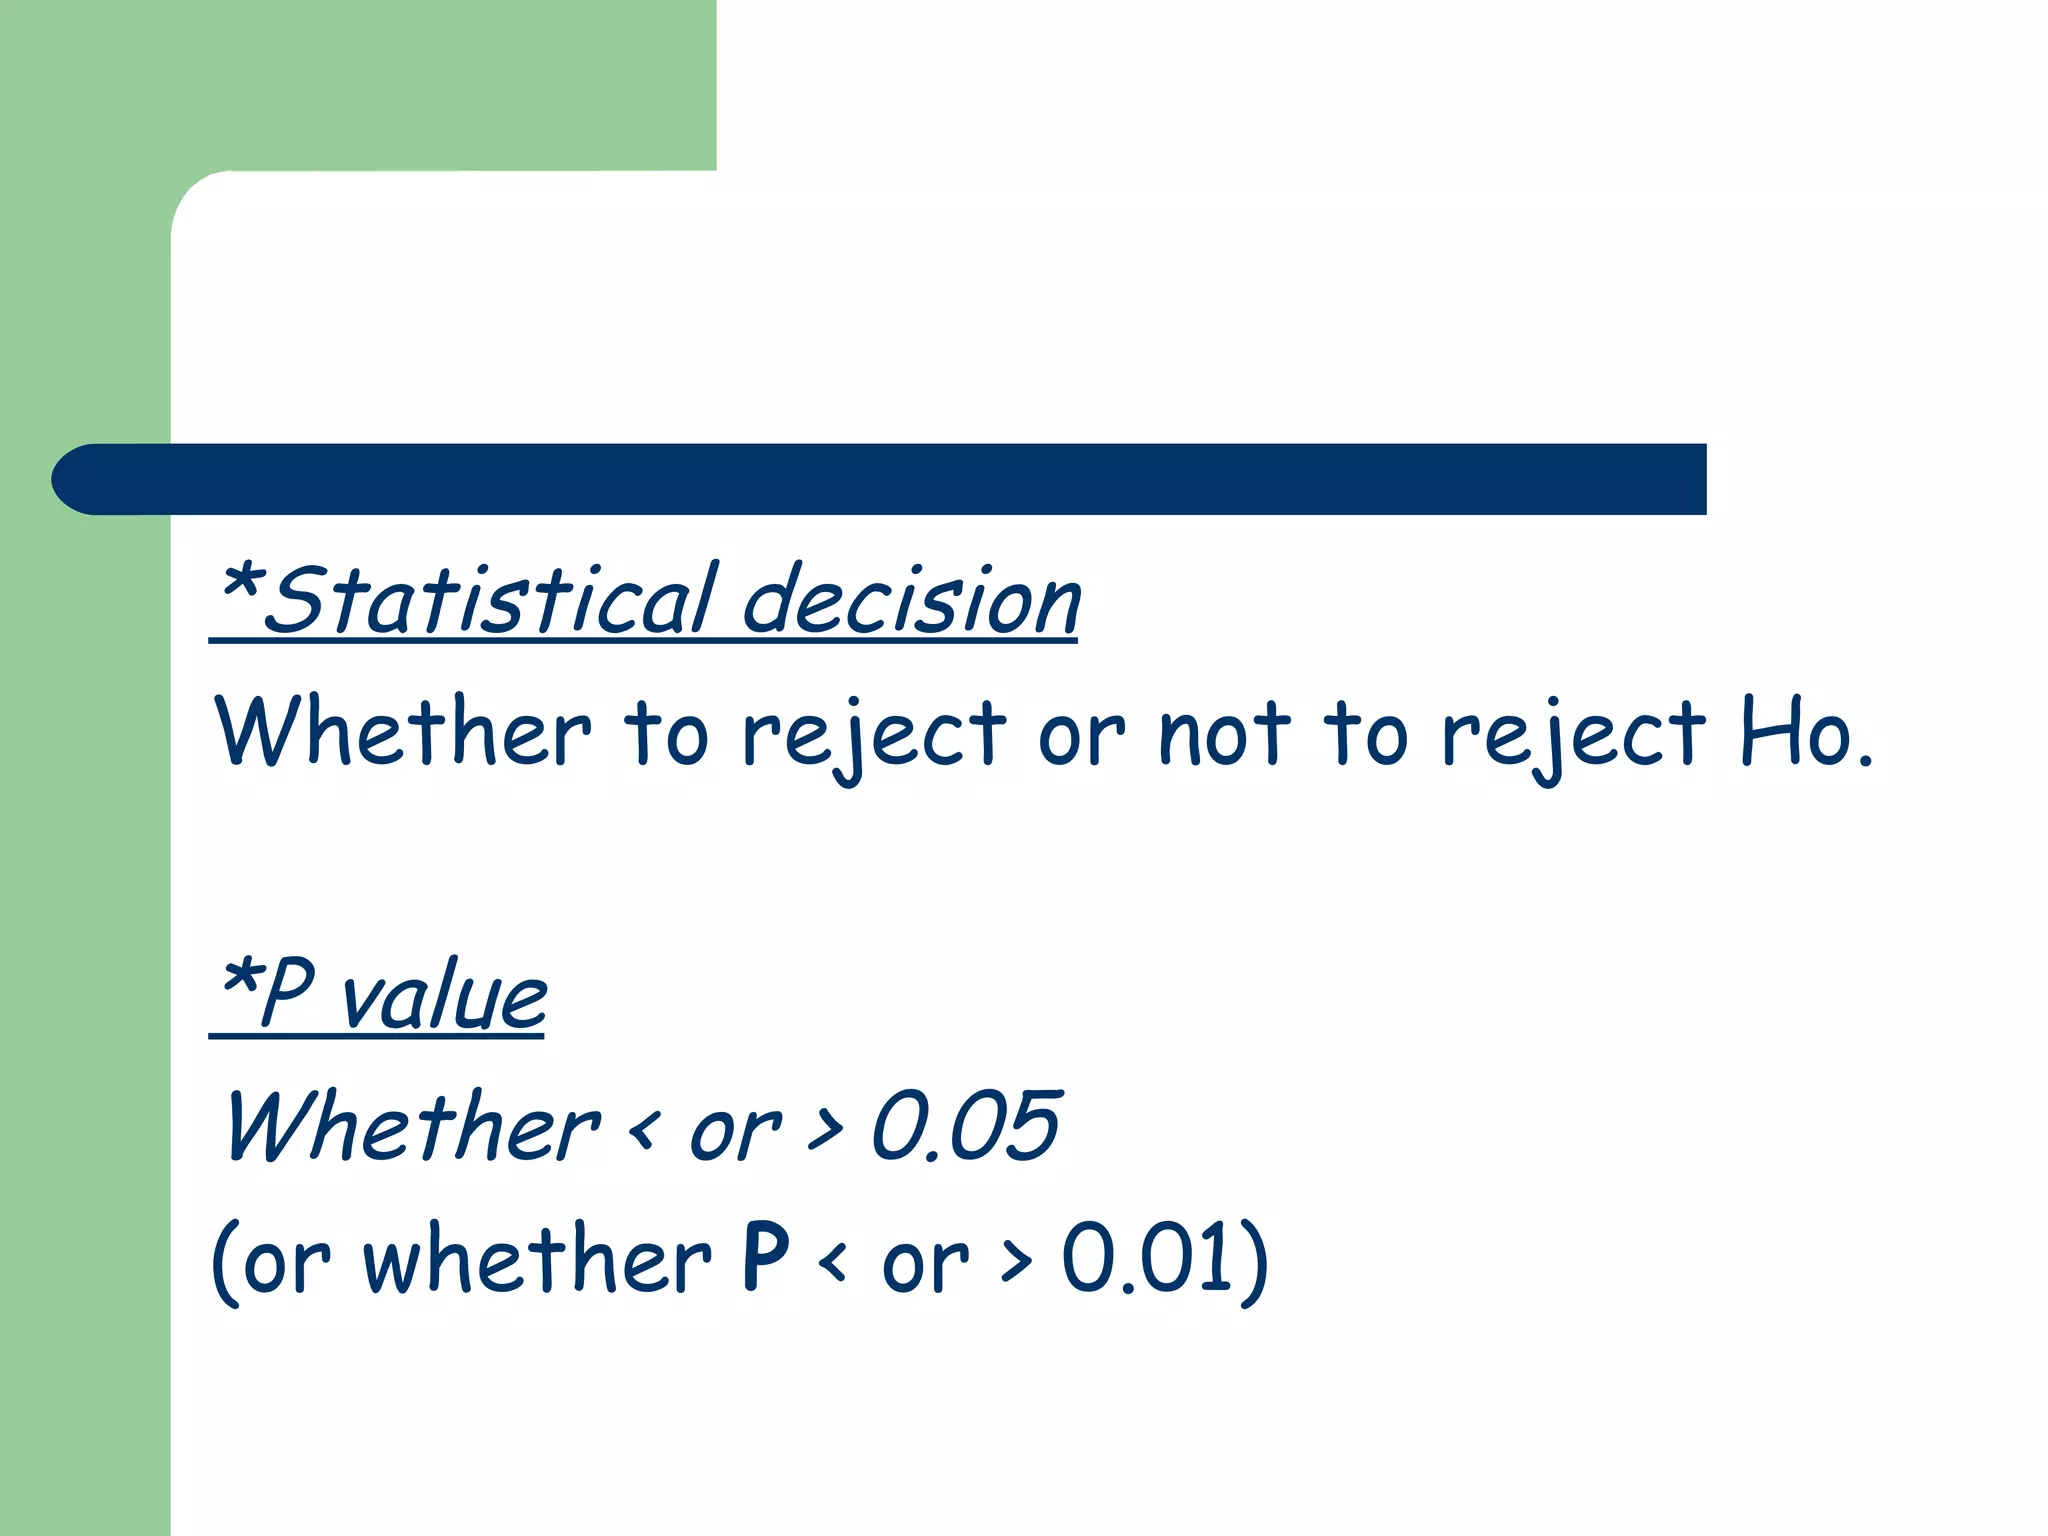
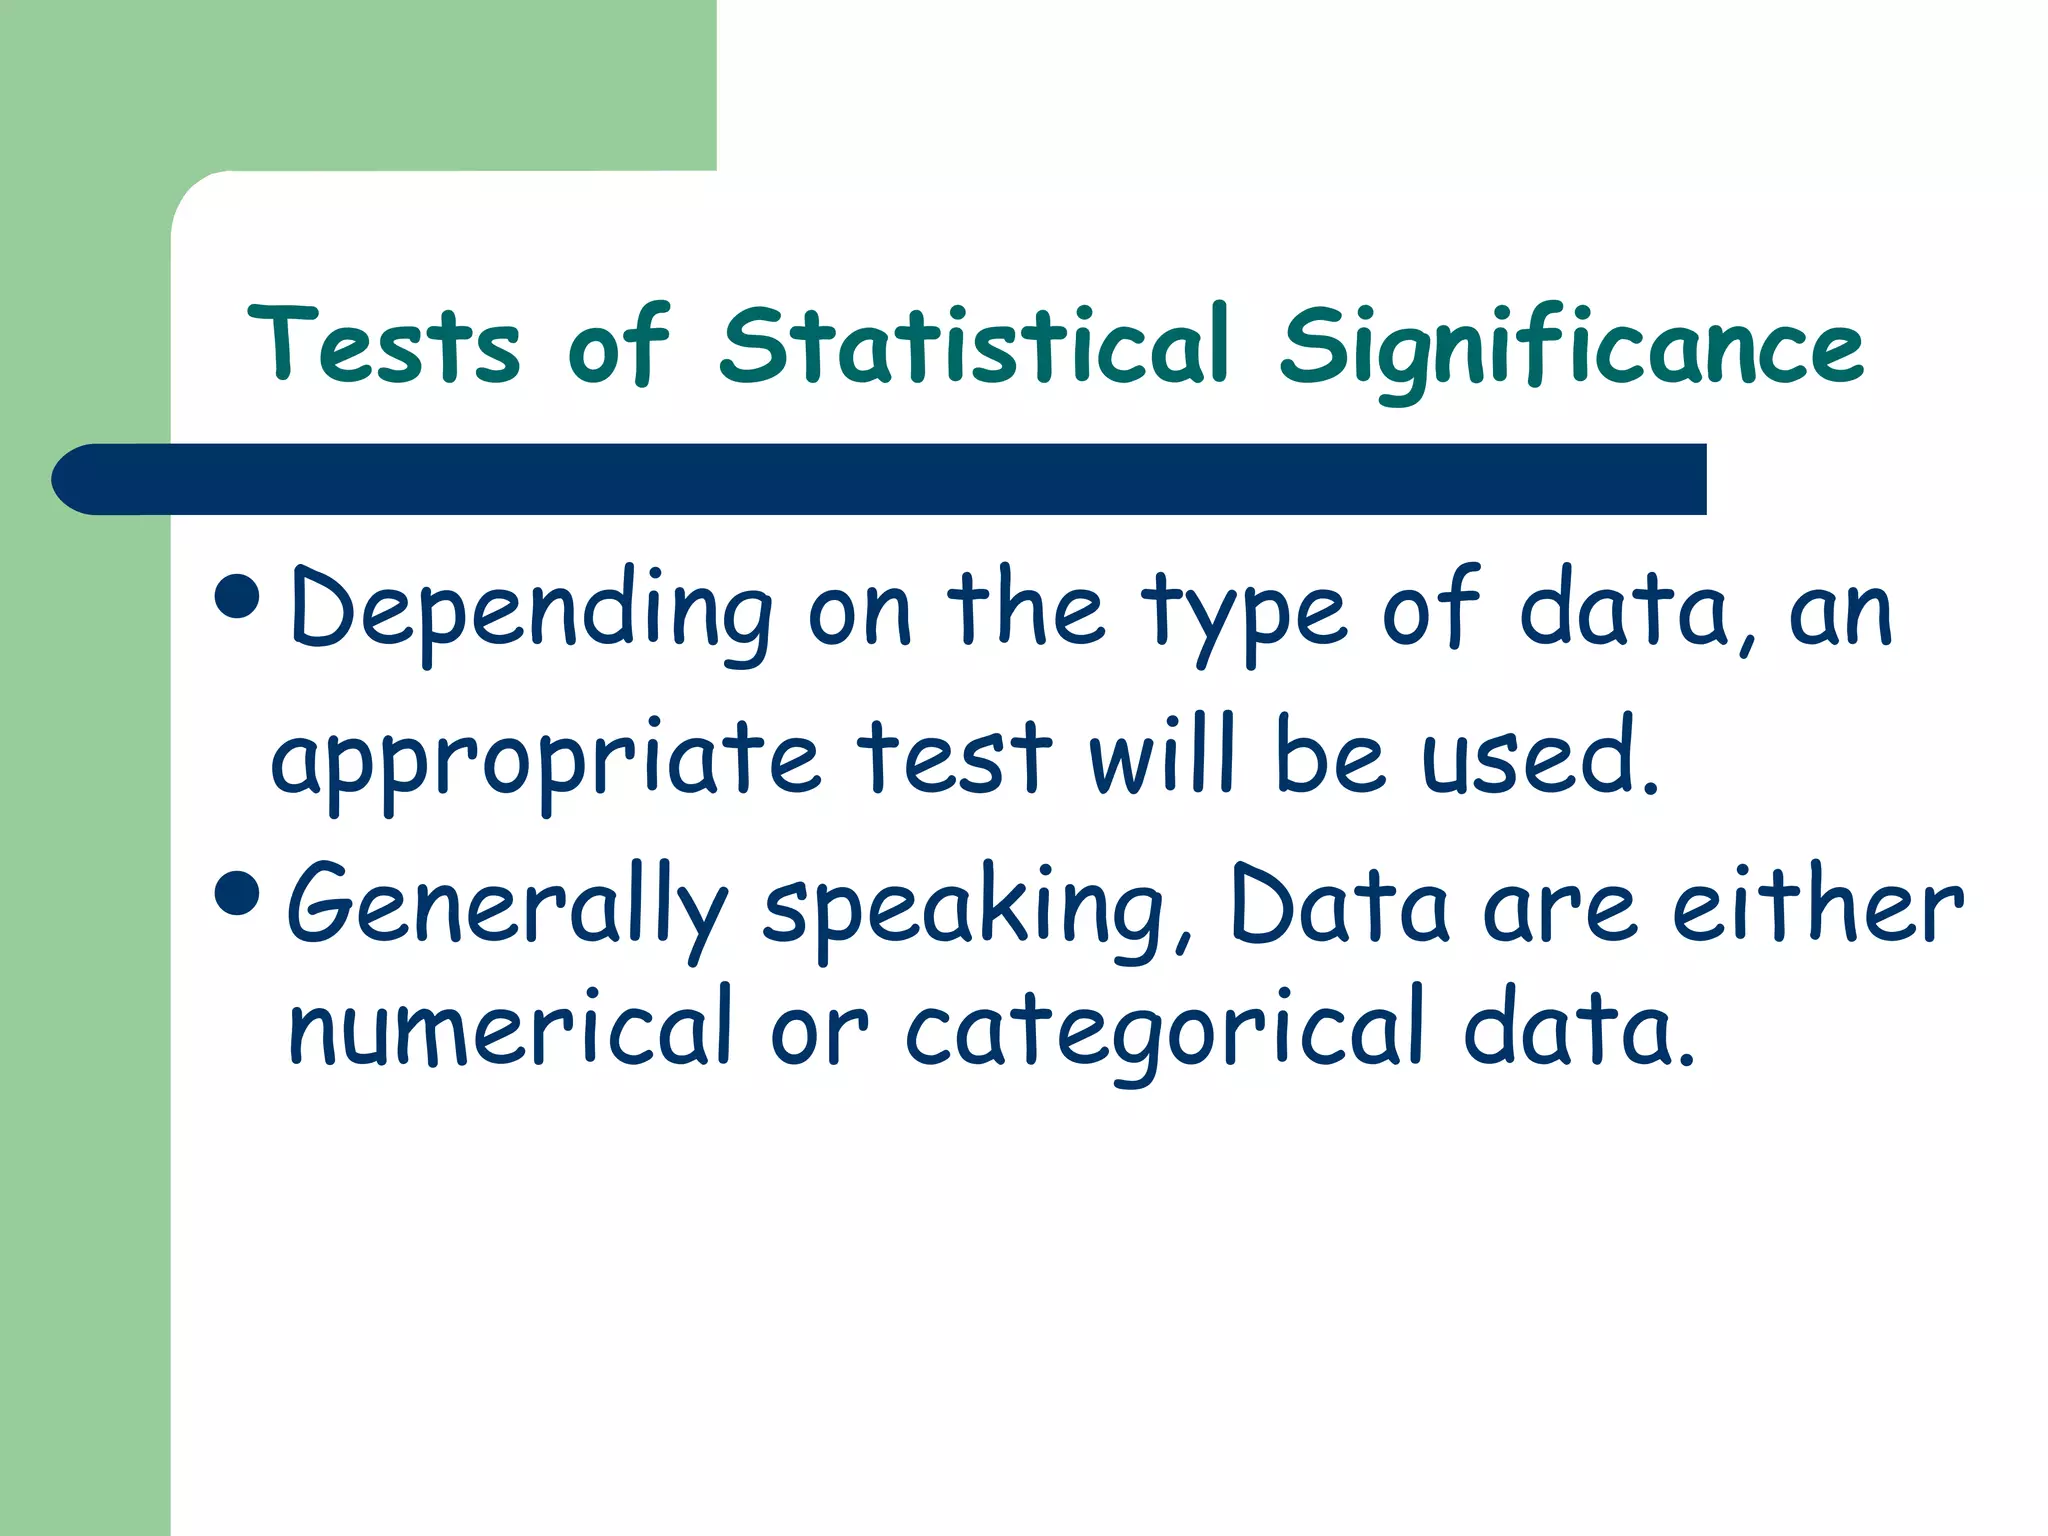
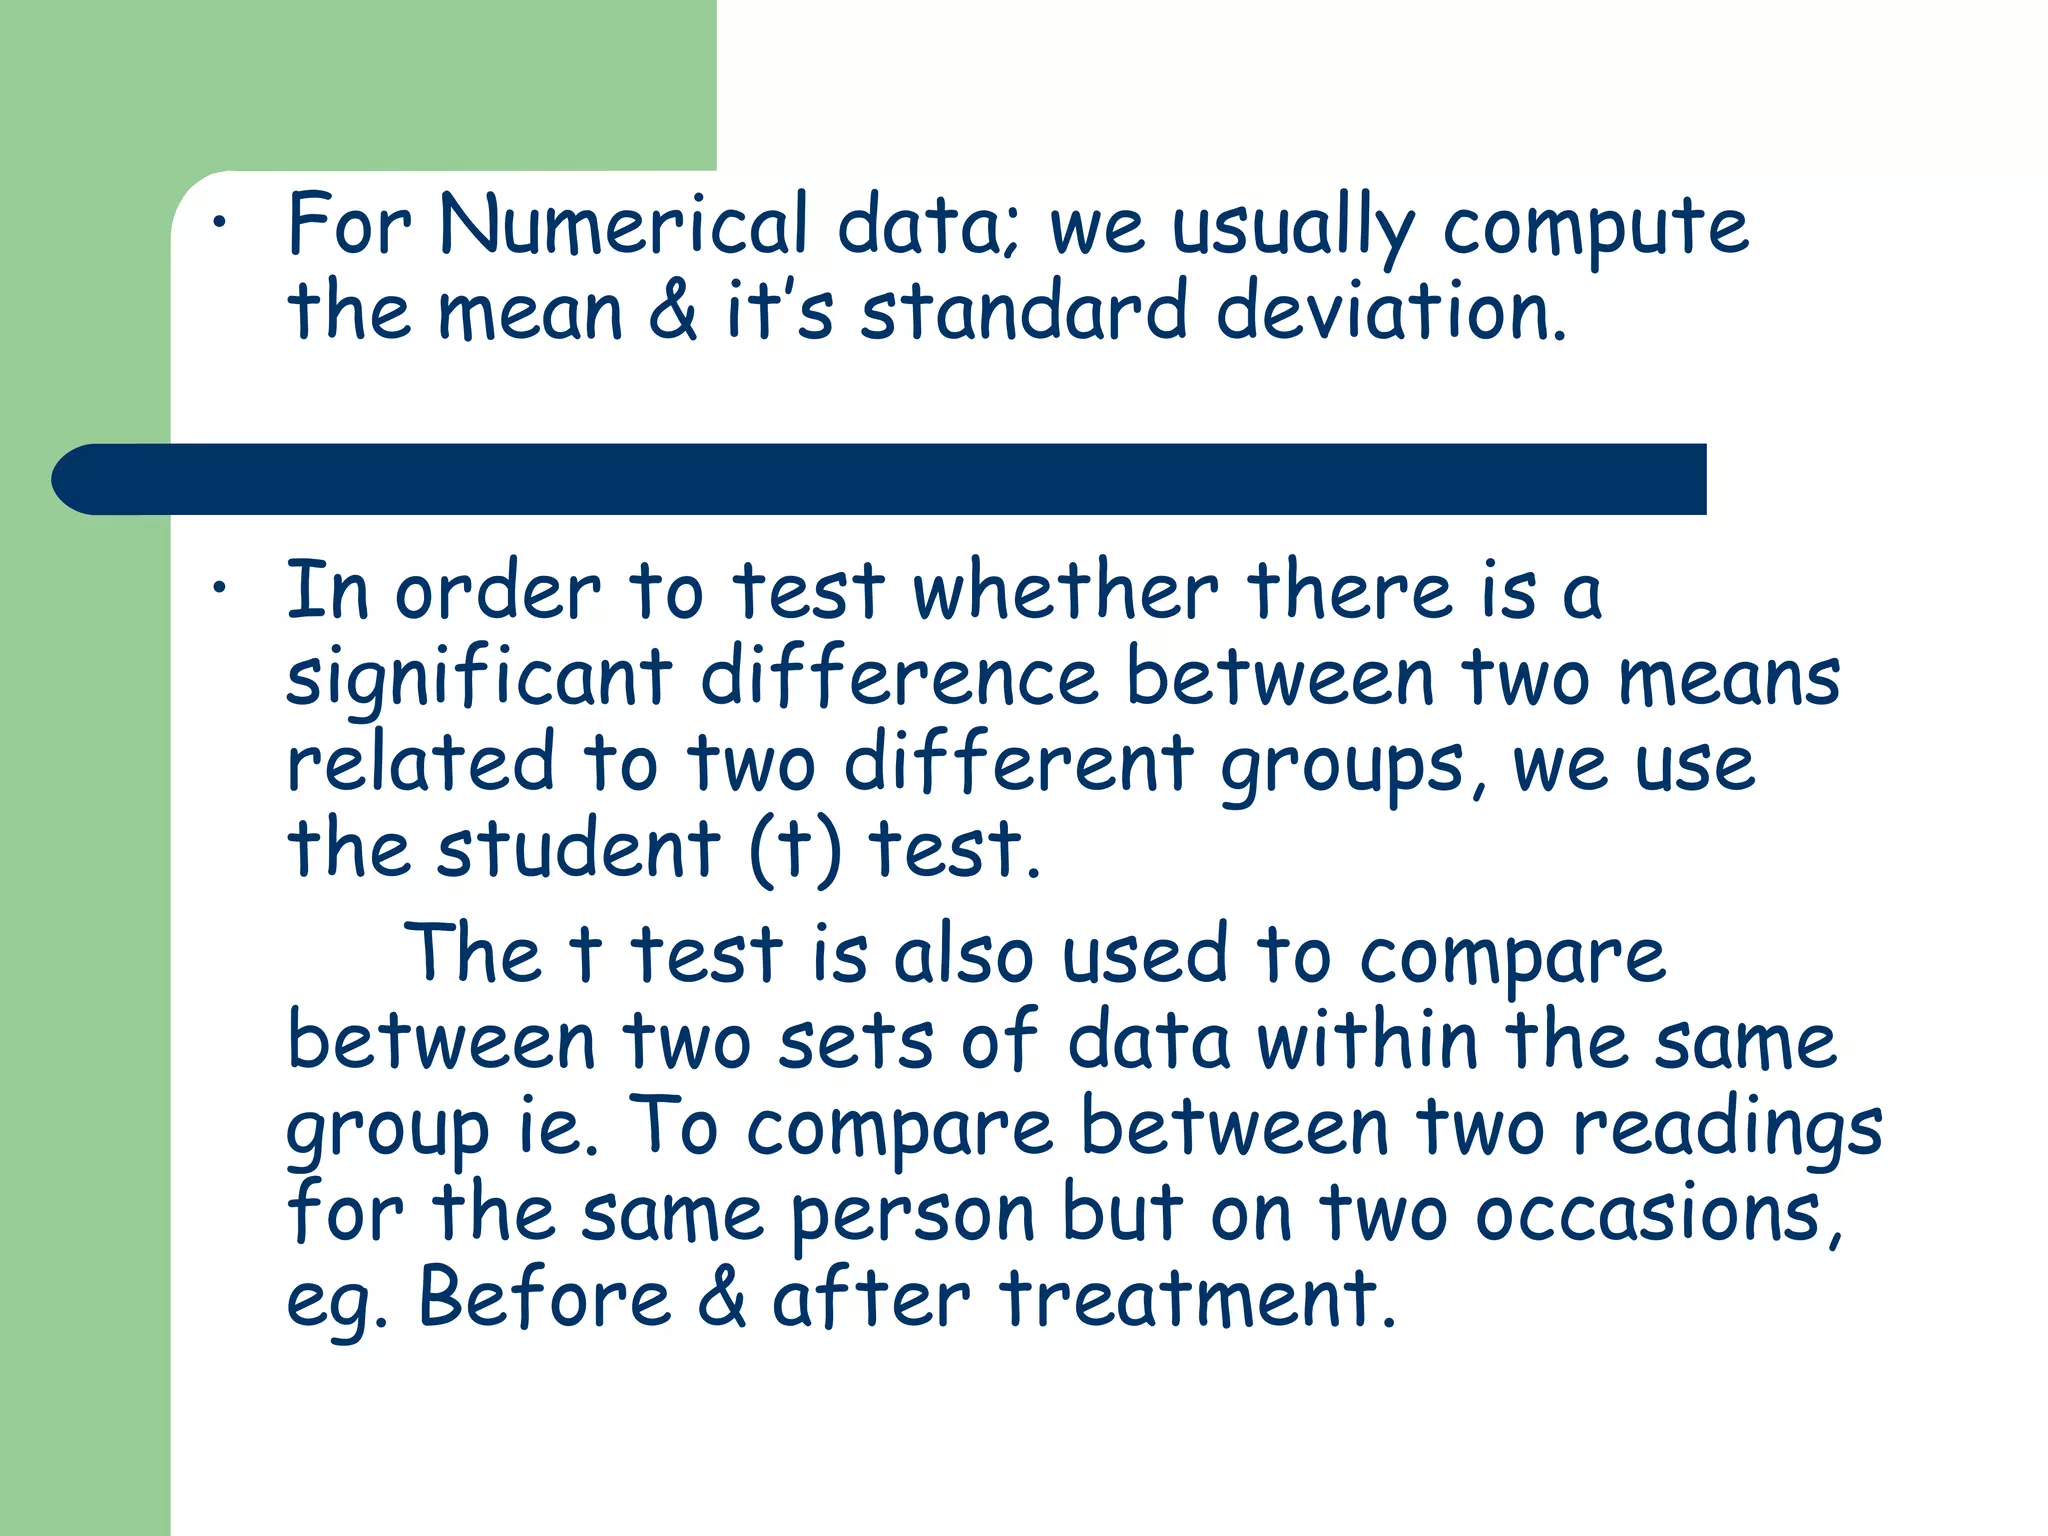
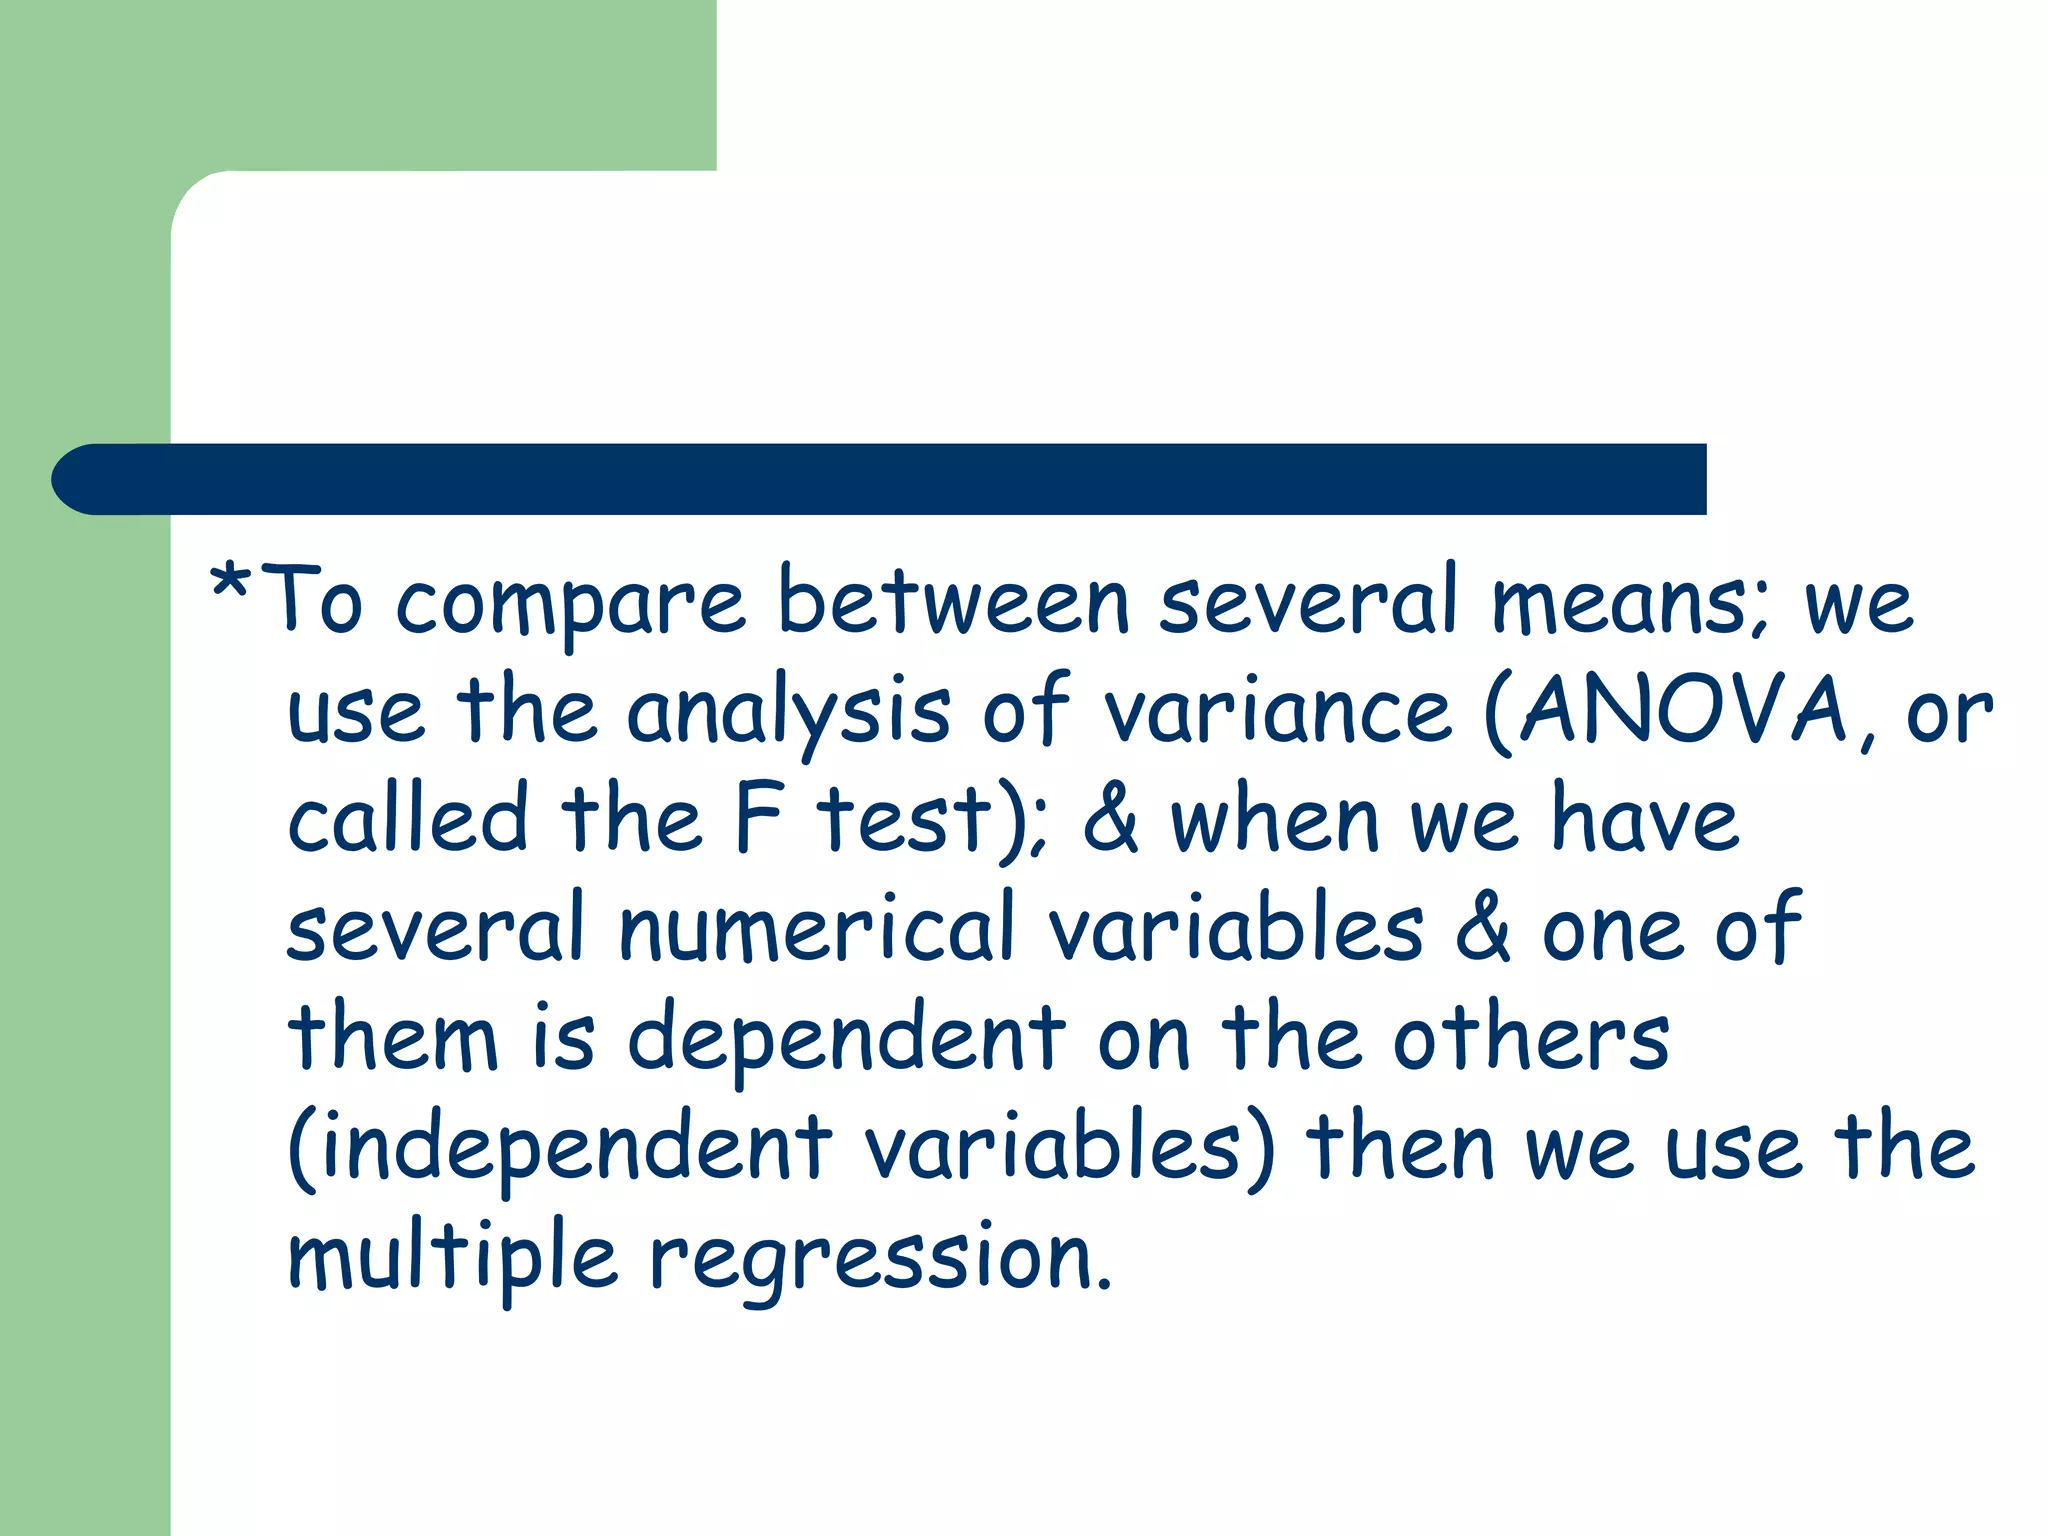
The Normal Distribution
Also called Gaussean Distribution.
Mean = Median = Mode.
Skewness = zero & Kurtosis =
zero.
Total area under the curve = 1.
The Normal Distribution
The Normal Distribution, cont.
 68% of observations lie between minus & plus
one SD. ( -1Z & +1Z ).
 95% of observations lie between minus 1.96 &
plus 1.96 SD units.
 99% of observations lie between minus 2.58 &
plus 2.58 SD units.
 99.7% of observations lie between minus 3 &
plus 3 SD units.
Confidence interval for a mean
 The range with in which the population mean
is likely to lie.
s.d.
95% C.I. = X ± 1.96
√n
s.d.
99% C.I. = X ± 2.58
√n
Confidence interval for a mean
If n ≤ 30
s.d.
C.I. = X ± t
√n
Steps of testing the statistical
hypothesis
*Assumption
We assume that our population(s) are
normally distributed.
*Hypothesis
We put null hypothesis (Ho) &
alternative hypothesis (HA).
*Levels of significance (alpha)
Alpha = the probability of rejecting a true
null hypothesis.
Usually alpha = 0.05 or 0.01
*Degrees of freedom (d.f.): Depends on
the type of the statistical test.
*The statistics
Depends on type of data.
*Statistical decision
Whether to reject or not to reject Ho.
*P value
Whether < or > 0.05
(or whether P < or > 0.01)
Tests of Statistical Significance
Depending on the type of data, an
appropriate test will be used.
Generally speaking, Data are either
numerical or categorical data.
• For Numerical data; we usually compute
the mean & it’s standard deviation.
• In order to test whether there is a
significant difference between two means
related to two different groups, we use
the student (t) test.
The t test is also used to compare
between two sets of data within the same
group ie. To compare between two readings
for the same person but on two occasions,
eg. Before & after treatment.
*To compare between several means; we
use the analysis of variance (ANOVA, or
called the F test); & when we have
several numerical variables & one of
them is dependent on the others
(independent variables) then we use the
multiple regression.
*In order to examine the nature & strength of
the relationship between two variables ( e.g..
Blood pressure & age), simple linear regression
& correlation tests are used.
*The objective of regression analysis is to
predict (estimate) the value of one variable
corresponding to a given value of another
variable.
*Correlation analysis is concerned with measuring
the strength of the relationship between
variables.

Stat 4 the normal distribution & steps of testing hypothesis

  • 1.
    The Normal Distribution Alsocalled Gaussean Distribution. Mean = Median = Mode. Skewness = zero & Kurtosis = zero. Total area under the curve = 1.
  • 3.
  • 4.
    The Normal Distribution,cont.  68% of observations lie between minus & plus one SD. ( -1Z & +1Z ).  95% of observations lie between minus 1.96 & plus 1.96 SD units.  99% of observations lie between minus 2.58 & plus 2.58 SD units.  99.7% of observations lie between minus 3 & plus 3 SD units.
  • 5.
    Confidence interval fora mean  The range with in which the population mean is likely to lie. s.d. 95% C.I. = X ± 1.96 √n s.d. 99% C.I. = X ± 2.58 √n
  • 6.
    Confidence interval fora mean If n ≤ 30 s.d. C.I. = X ± t √n
  • 7.
    Steps of testingthe statistical hypothesis *Assumption We assume that our population(s) are normally distributed. *Hypothesis We put null hypothesis (Ho) & alternative hypothesis (HA).
  • 8.
    *Levels of significance(alpha) Alpha = the probability of rejecting a true null hypothesis. Usually alpha = 0.05 or 0.01 *Degrees of freedom (d.f.): Depends on the type of the statistical test. *The statistics Depends on type of data.
  • 9.
    *Statistical decision Whether toreject or not to reject Ho. *P value Whether < or > 0.05 (or whether P < or > 0.01)
  • 10.
    Tests of StatisticalSignificance Depending on the type of data, an appropriate test will be used. Generally speaking, Data are either numerical or categorical data.
  • 11.
    • For Numericaldata; we usually compute the mean & it’s standard deviation. • In order to test whether there is a significant difference between two means related to two different groups, we use the student (t) test. The t test is also used to compare between two sets of data within the same group ie. To compare between two readings for the same person but on two occasions, eg. Before & after treatment.
  • 12.
    *To compare betweenseveral means; we use the analysis of variance (ANOVA, or called the F test); & when we have several numerical variables & one of them is dependent on the others (independent variables) then we use the multiple regression.
  • 13.
    *In order toexamine the nature & strength of the relationship between two variables ( e.g.. Blood pressure & age), simple linear regression & correlation tests are used. *The objective of regression analysis is to predict (estimate) the value of one variable corresponding to a given value of another variable.
  • 14.
    *Correlation analysis isconcerned with measuring the strength of the relationship between variables.