Stat 4 the normal distribution & steps of testing hypothesis
•Download as PPT, PDF•
3 likes•1,000 views

The normal distribution has several key properties: it is symmetric, with mean, median and mode equal; it has skewness of zero and kurtosis of zero. Most observations fall within 1, 2 or 3 standard deviations of the mean. Confidence intervals for a mean provide a likely range for the true population mean. Hypothesis testing involves assumptions, hypotheses, significance levels, test statistics and p-values to determine whether to reject the null hypothesis. Statistical tests are selected based on numerical or categorical data types.

More Related Content
What's hot
What's hot (20)
Viewers also liked
Similar to Stat 4 the normal distribution & steps of testing hypothesis
Similar to Stat 4 the normal distribution & steps of testing hypothesis (20)
More from Forensic Pathology
More from Forensic Pathology (20)
Stat 4 the normal distribution & steps of testing hypothesis
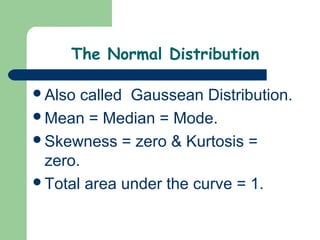
- 1. The Normal Distribution Also called Gaussean Distribution. Mean = Median = Mode. Skewness = zero & Kurtosis = zero. Total area under the curve = 1.
- 4. The Normal Distribution, cont. 68% of observations lie between minus & plus one SD. ( -1Z & +1Z ). 95% of observations lie between minus 1.96 & plus 1.96 SD units. 99% of observations lie between minus 2.58 & plus 2.58 SD units. 99.7% of observations lie between minus 3 & plus 3 SD units.
- 5. Confidence interval for a mean The range with in which the population mean is likely to lie. s.d. 95% C.I. = X ± 1.96 √n s.d. 99% C.I. = X ± 2.58 √n
- 6. Confidence interval for a mean If n ≤ 30 s.d. C.I. = X ± t √n
- 7. Steps of testing the statistical hypothesis *Assumption We assume that our population(s) are normally distributed. *Hypothesis We put null hypothesis (Ho) & alternative hypothesis (HA).
- 8. *Levels of significance (alpha) Alpha = the probability of rejecting a true null hypothesis. Usually alpha = 0.05 or 0.01 *Degrees of freedom (d.f.): Depends on the type of the statistical test. *The statistics Depends on type of data.
- 9. *Statistical decision Whether to reject or not to reject Ho. *P value Whether < or > 0.05 (or whether P < or > 0.01)
- 10. Tests of Statistical Significance Depending on the type of data, an appropriate test will be used. Generally speaking, Data are either numerical or categorical data.
- 11. • For Numerical data; we usually compute the mean & it’s standard deviation. • In order to test whether there is a significant difference between two means related to two different groups, we use the student (t) test. The t test is also used to compare between two sets of data within the same group ie. To compare between two readings for the same person but on two occasions, eg. Before & after treatment.
- 12. *To compare between several means; we use the analysis of variance (ANOVA, or called the F test); & when we have several numerical variables & one of them is dependent on the others (independent variables) then we use the multiple regression.
- 13. *In order to examine the nature & strength of the relationship between two variables ( e.g.. Blood pressure & age), simple linear regression & correlation tests are used. *The objective of regression analysis is to predict (estimate) the value of one variable corresponding to a given value of another variable.
- 14. *Correlation analysis is concerned with measuring the strength of the relationship between variables.