Download to read offline
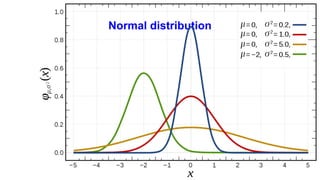
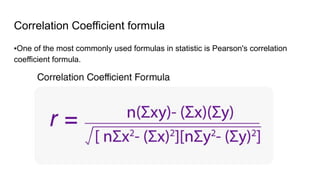
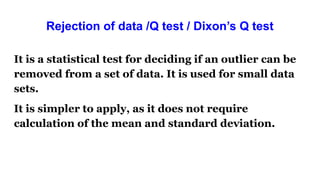
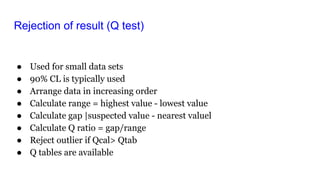
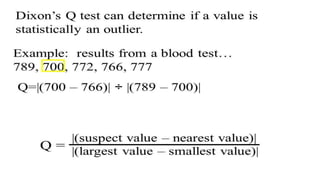
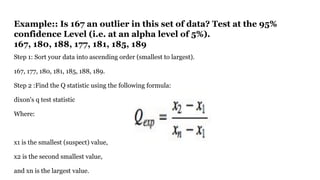


The document discusses the application of statistical methods in pharmaceutical analysis, covering topics like normal distribution, confidence intervals, t-tests, ANOVA, regression analysis, and the correlation coefficient. It highlights the importance of these methods in evaluating drug efficacy, comparing different treatments, and analyzing data in the pharmaceutical industry. Additionally, it provides insights into specific tests for analyzing data sets, including the rejection of outliers using the q-test.


