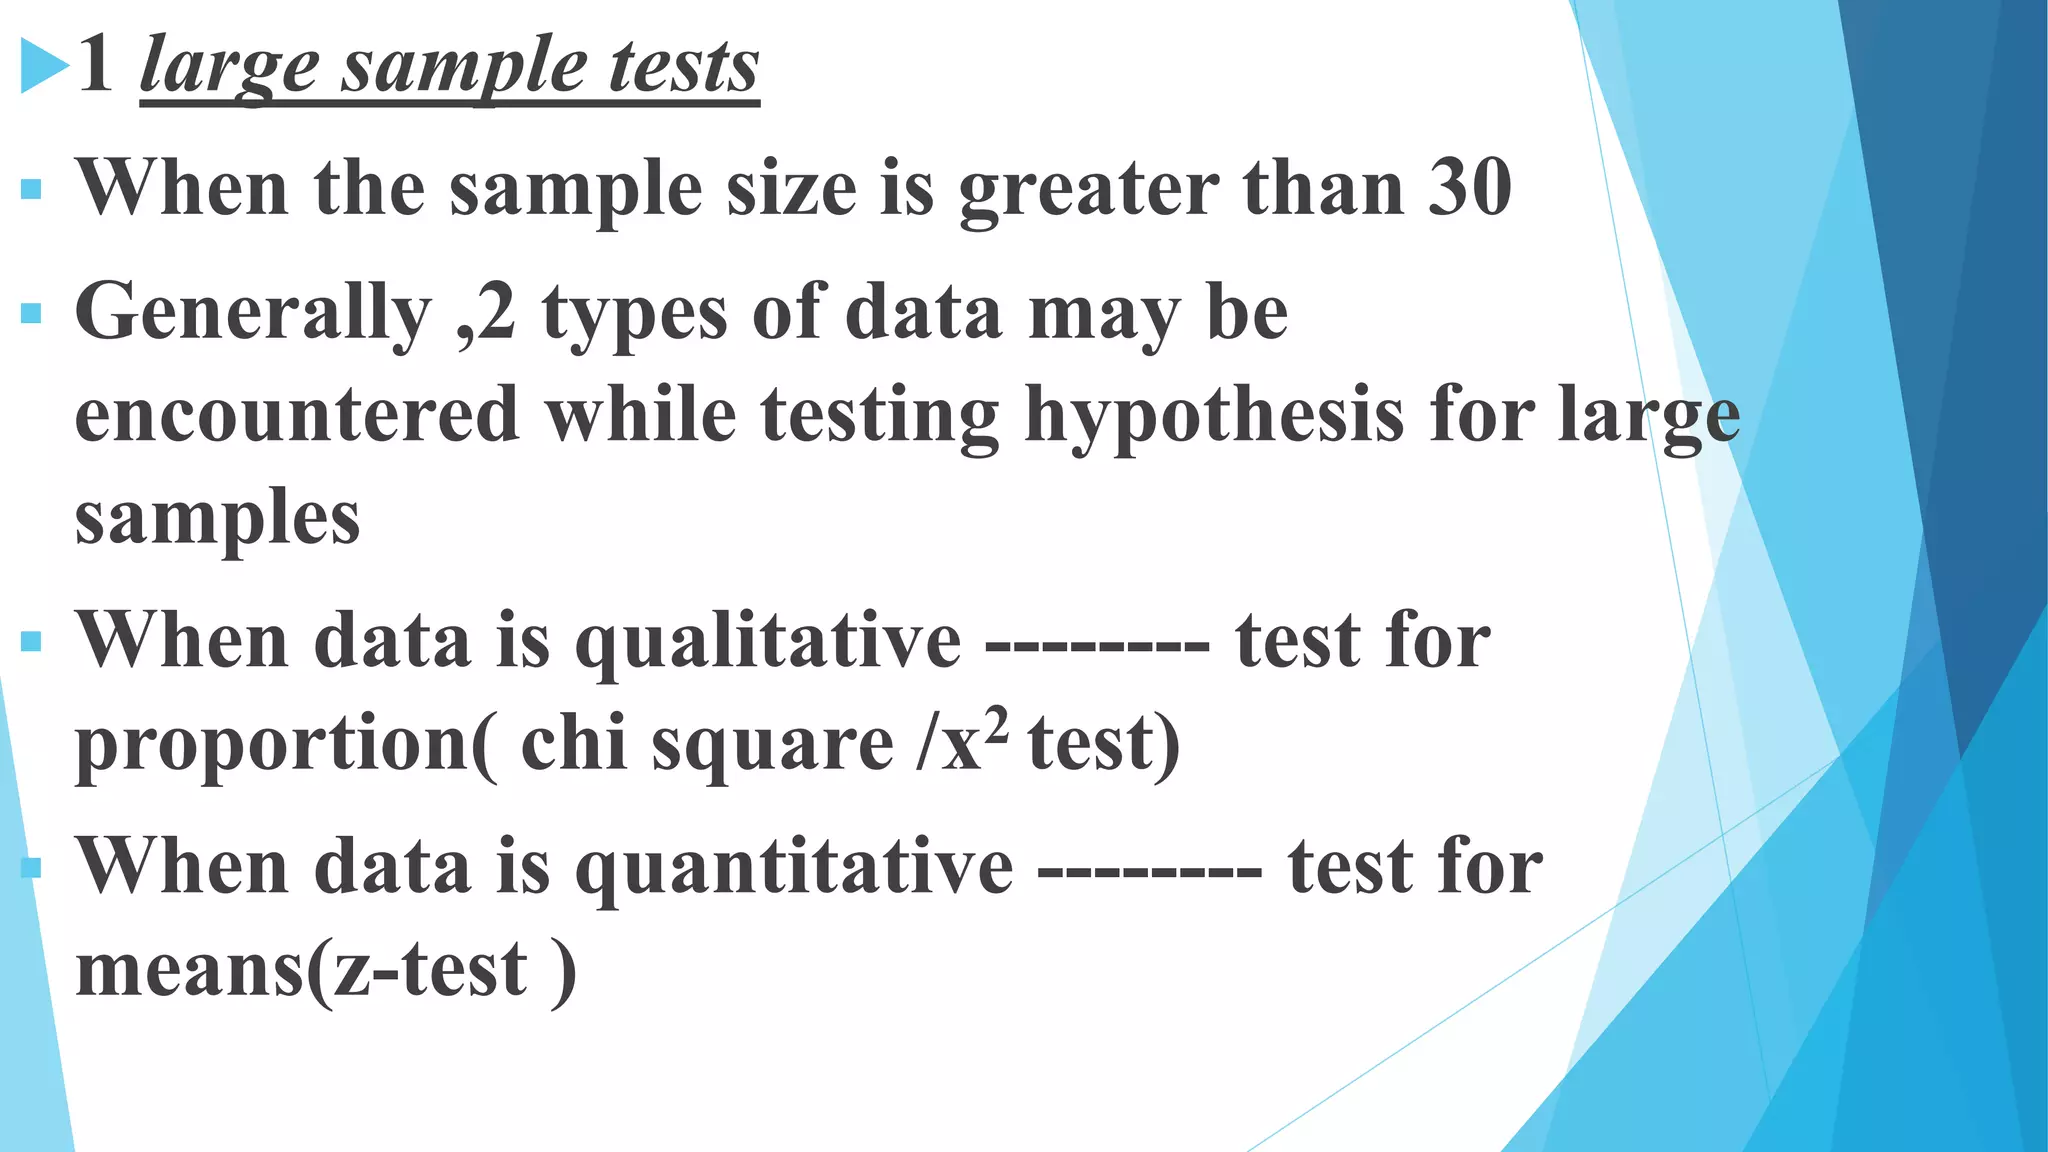
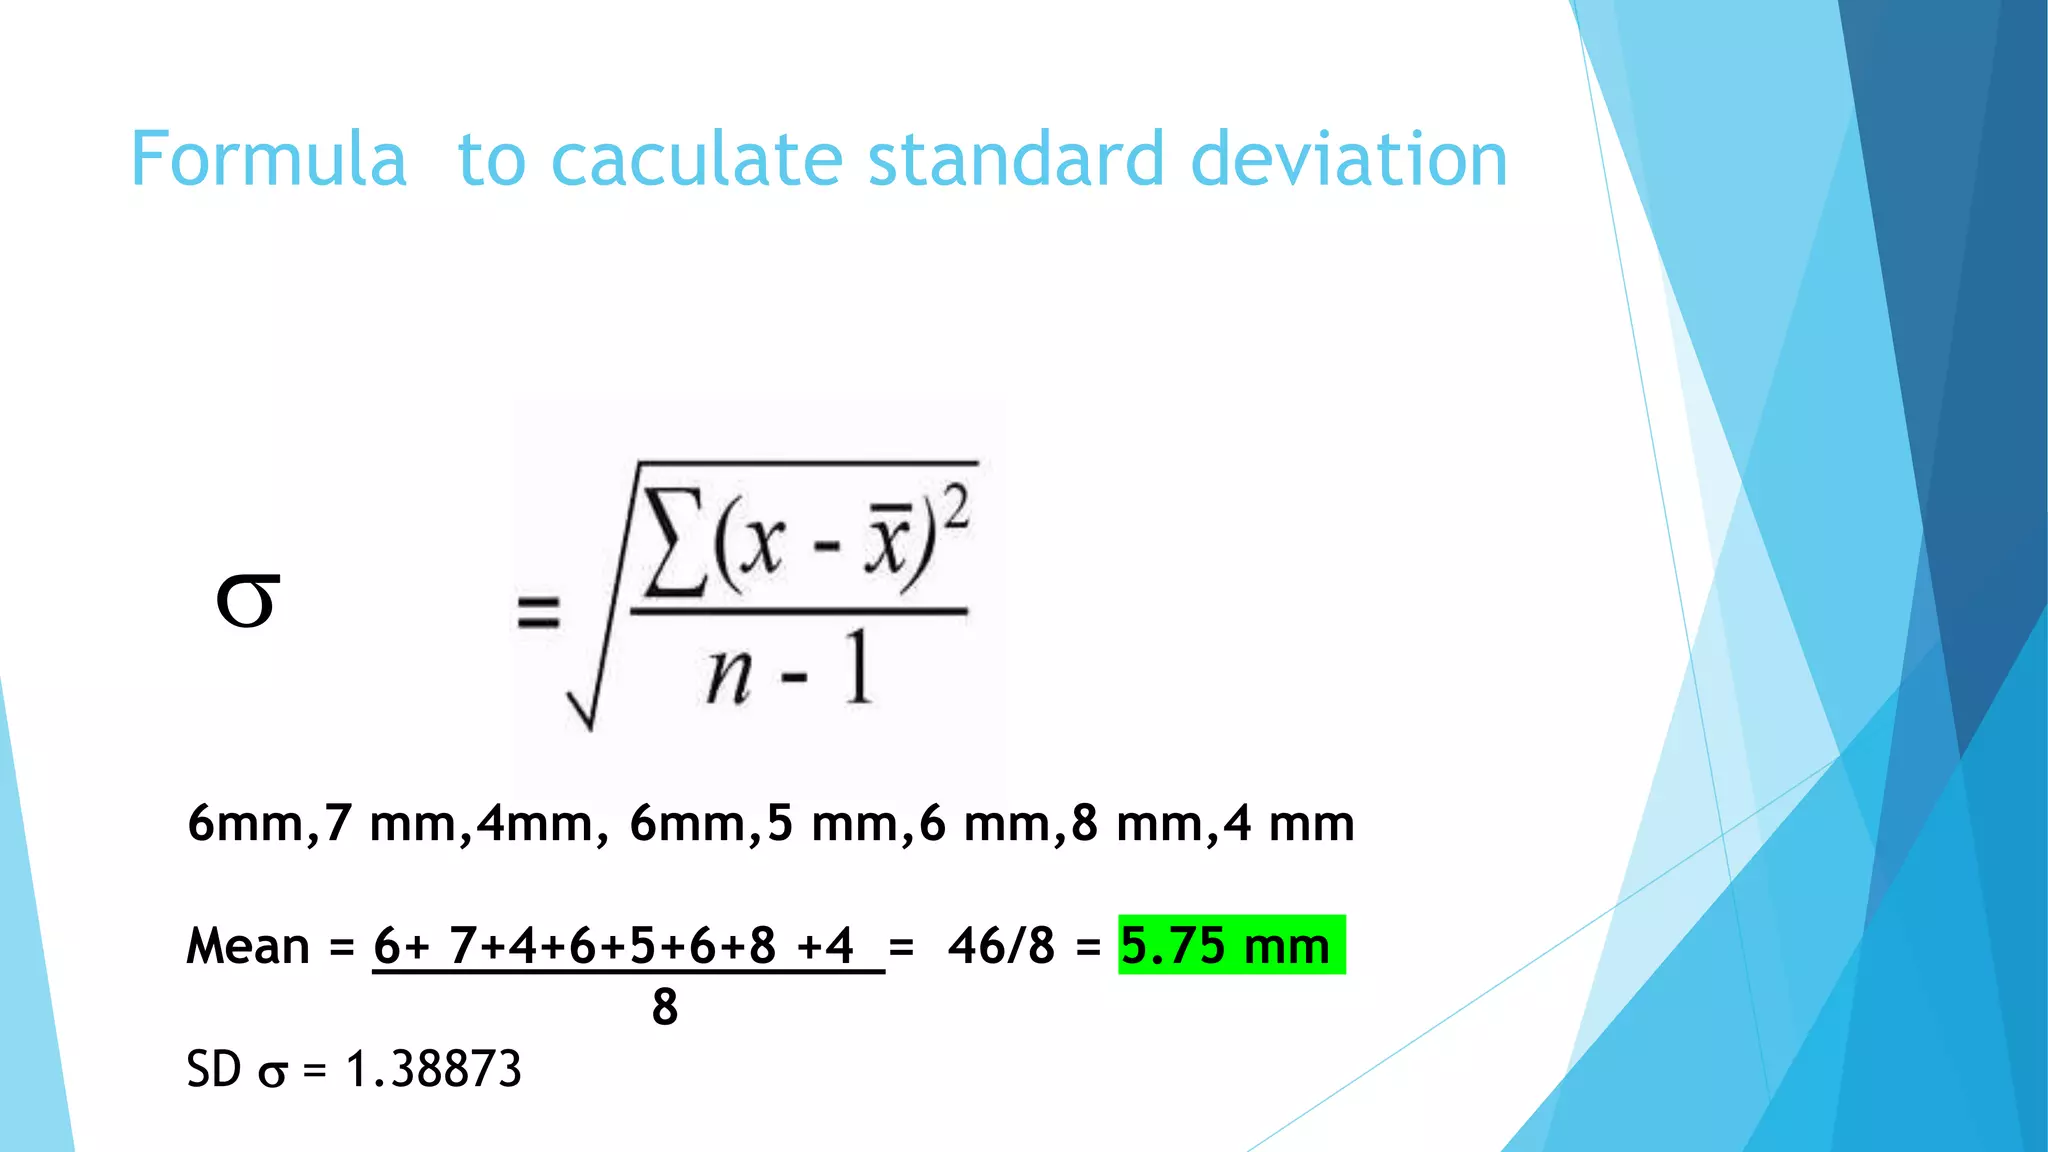
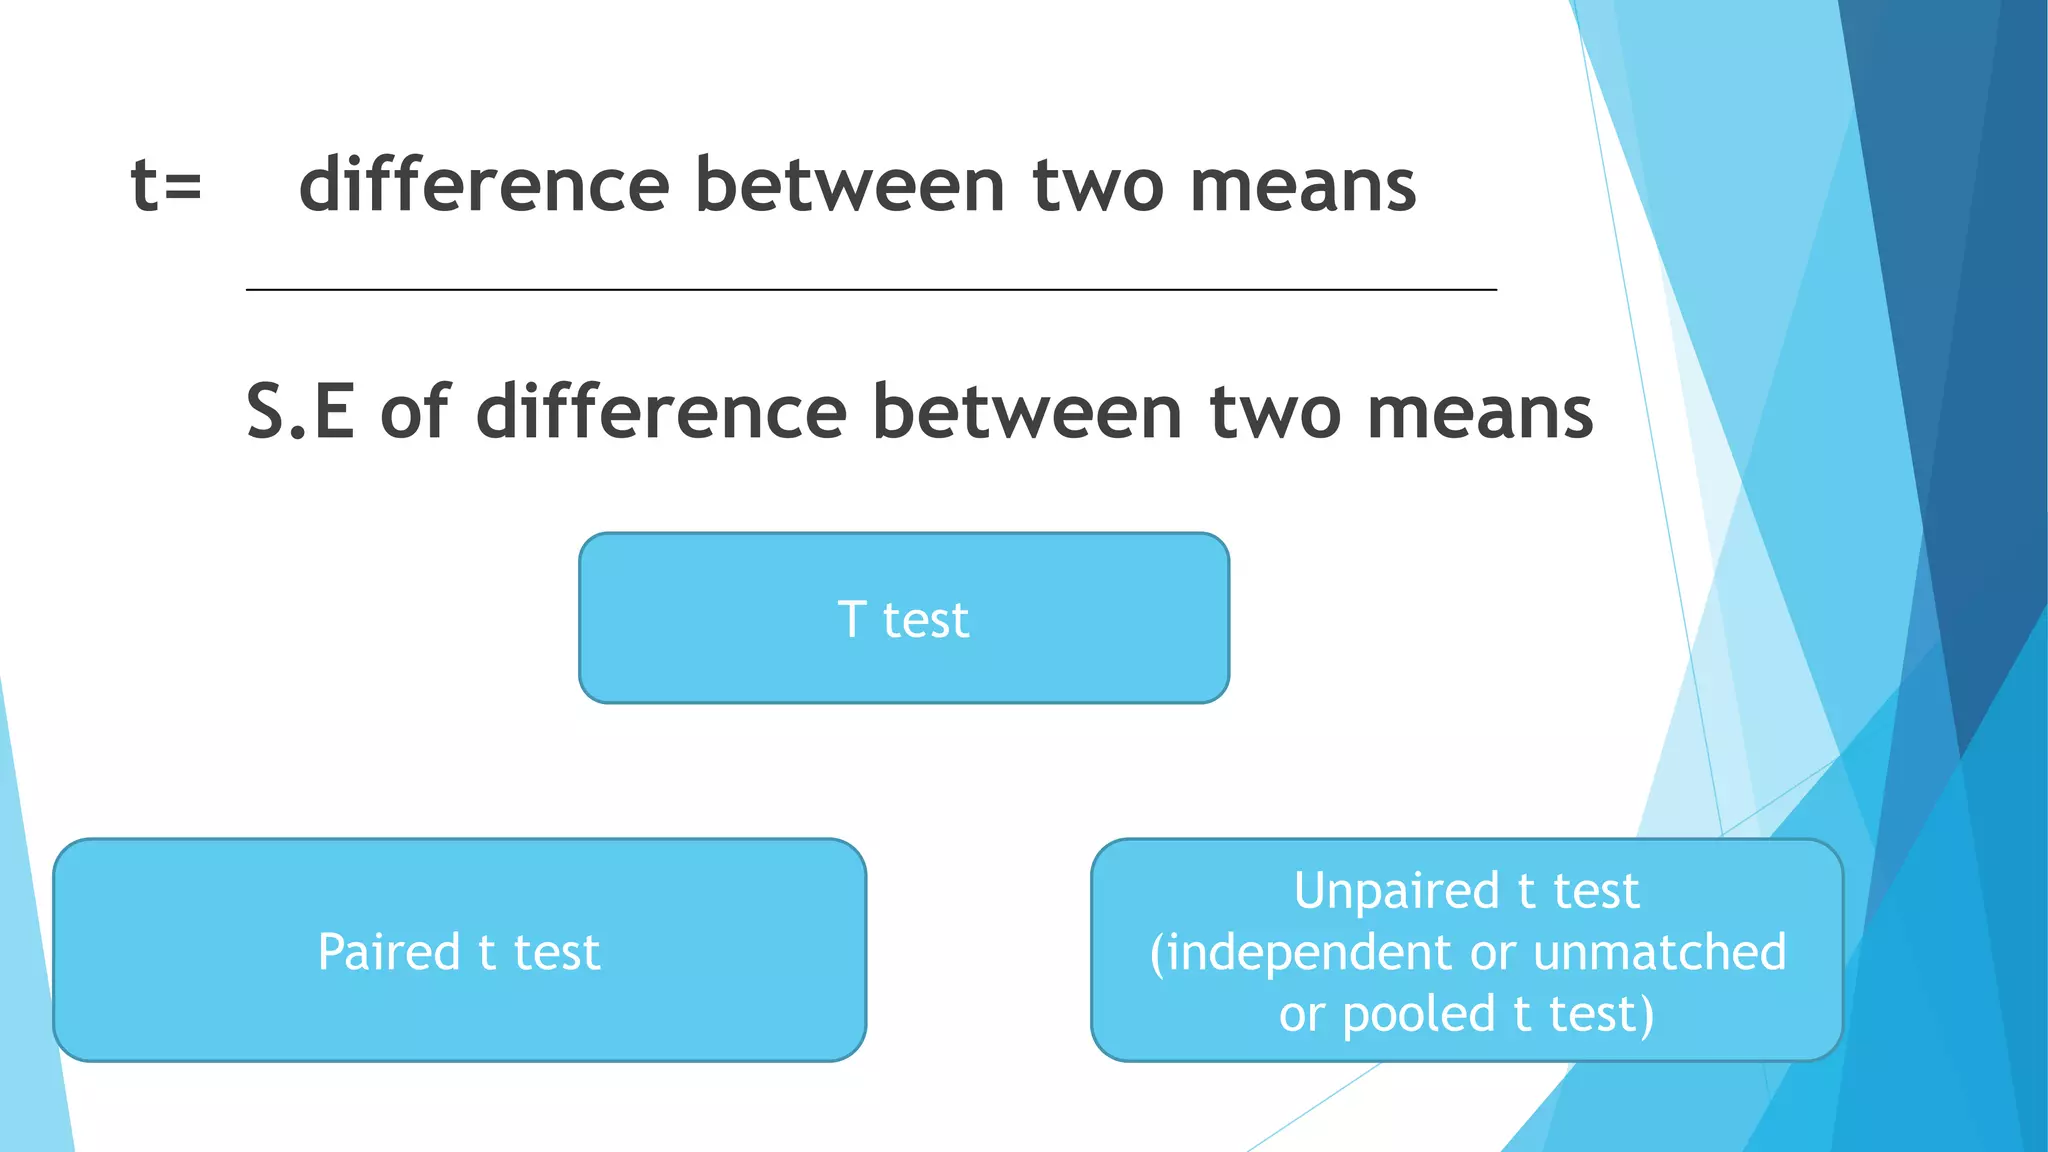
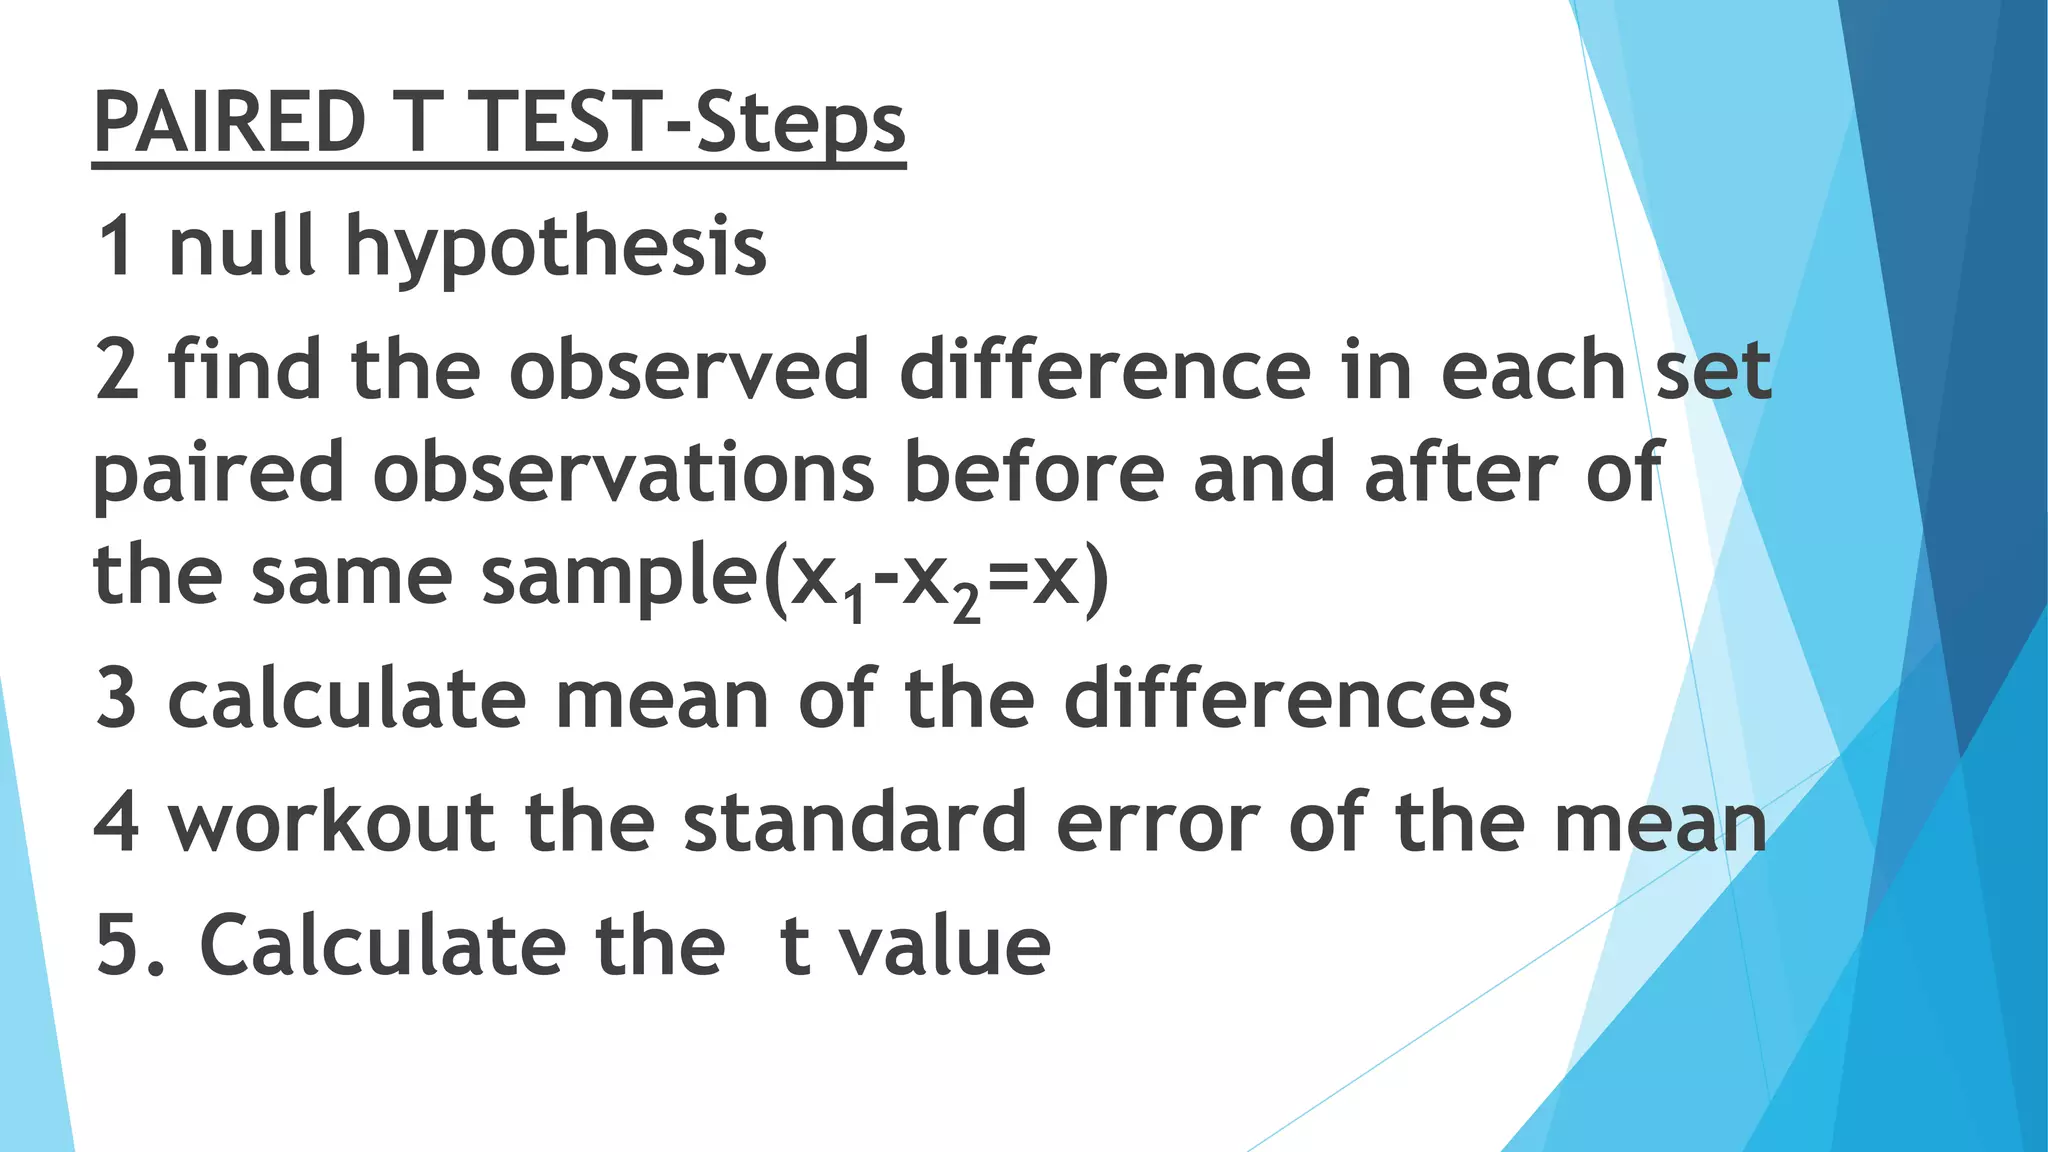
TEST OF
SIGNIFICANCE
Dr Joice P Jiji
MDS first year
GUIDED BY
Dr Sandeep J N
contents
 Introduction
 Common terms in statistics
 Biostatistics
 Hypothesis –null and alternate
 Test of significance
 Parametric and non parametric tests
 Z- test
 Student t- test
 ANOVA
 Chi Square test
 Mc Nemar’s test
 The Wilcoxon signed-rank test
 Mann –Whitney U test
 The Kruskal Wallis test
 The Friedman tests
 Fisher's exact test
 Post hoc rank test
 Conclusion
 references
Introduction
Statistics is the discipline that concerns the collection,
organization, analysis, interpretation, and presentation of data
Statistics is an important and integral part of research
methodology. It is a pervasive force on which the entire
spectrum of clinical decision making is dependent
Test of significance are one of the
central concept in statistics
 These are mathematical method by
which the probability of an observed
difference occurring by chance is
found.
Common terms in
statistics
Variable: A characteristic that takes on
different values in different, places or
things. 2 types dependent and
independent variable
A dependent variable is the variable being
tested in a scientific experiment.
Examples of independent variables are
• Age, sex, race
 Population: It is an entire group of
people or study elements— persons, things
or measurements for which we have an
interest at a particular time. Populations
are determined by our sphere of interest.
It may be infinite or finite.
 Sampling unit: Each member of a
population.
 Sample: It may be defined as a part of a
population. It is a group of sampling units
that form part of a population, generally
selected so as to be representative of the
population whose variables are under
study. There are many kinds of sample
methods in Biostatistics.
Mean This measure implies arithmetic average or
arithmetic mean which is obtained by summing up
all the observations and dividing the total by the
number of observations.
Median When all the observations of a variable are
arranged in either ascending or descending order,
the middle observation is known as median
 Mode This is the most frequently occurring
observation in a se
 6mm,7 mm,4mm, 6mm,5 mm,6 mm,8 mm,4 mm
 Mean = 6+ 7+4+6+5+6+8 +4 = 46/8 = 5.75 mm
8
 Median = 4mm,4mm,5mm,6mm,6mm,6mm,7mm,8mm
 Median 6+6= 12/2= 6 mm
2
 Mode= 6mm
 4mm,4mm,5mm,6mm,6mm,6mm ,7mm,8mm
Normal distribution and Normal curve
• Gaussian distribution,
• First observed by Abraham de Moivre in
1733
• Probability distribution that is symmetric
about the mean.
• A theoretical , continuous, symmetrical
,unimodal distribution of infinite range
• Most of the biological variables follow
normal distribution
 The characteristics of a normal curve are:
 1. It is bell-shaped
 2. It is symmetrical.
 3. Mean, mode and median coincide. =0
 4. It has two inflections
 Total area is =1
 Standard deviation=1
STATISTICAL INFERENCE
Inference means drawing of conclusion from data
It is the process of drawing up conclusions from
quantitative or qualitative information using the
methods of statistics to describe and arrange the data
and to test suitable hypothesis
Statistical inference are based on probabilities and as
such cannot be expressed with full certainty
BIOSTATISTICS
Biostatistics is the term used when tools
of statistics are applied to the data that is
derived from biologic science such as
medicine
Statistical analysis is the back bone of
research
TEST OF SIGNIFICANCE
Whenever two sets of observation
are compared, it become essential
to find out whether difference
observed between the two group is
because of sampling variation or any
other factor
STAGES IN PERFORMING A TEST OF
SIGNIFICANCE
1 Create a null hypothesis
2 Create an alternative hypothesis
3 Determine the significance level
4 Decide on the test we will use
5 Perform a power analysis to find
out your sample size
6 calculate the standard deviation
7 Use the standard deviation
8 Determine the t- score(F,H,P,U)
9 Find the degree of freedom
10.Use a t- table for determining p
value
In Statistics, a hypothesis is defined as a formal
statement, which gives the explanation about the
relationship between the two or more variables of the
specified population. It helps the researcher to translate
the given problem to a clear explanation for the outcome
of the study.
What is a hypothesis ???
20
CHARECTERISTICS OF HYPOTHESIS
1. Hypothesis should be clear and precise.
2. Hypothesis should be capable of being
tested.
3. It should state relationship between
variables.
4 It must be specific.
5 It should be stated as simple as
possible.
6 It should be amenable to testing
within a reasonable time.
7 It should be consistent with
known facts.
classification
Based on their formulation
Null hypothesis and alternate
hypothesis
Null hypothesis
It states that there is no real difference between the
means (or proportions ) of the groups being compared
(or that there is no real association between two
continuous variables).
It is denoted by Ho.
Example- “ There is no difference in the clinical
attachment level with treatment A or treatment B”.
Step 2 Alternate hypothesis
 If null hypothesis is rejected, we need another
hypothesis…..an alternate hypothesis.
 It states that there must be a true difference
between the groups being compared.
 It is denoted by HA or Ha or H1.
 Example- “there is a difference in the clinical
attachment gain with treatment A and
treatment B”.
In Hypothesis testing we proceed on the basis of Null
Hypothesis. We always keep Alternative Hypothesis
in mind.
It seems strange to begin the process by asserting that
something is not true, but it is far easier to disprove
an assertion than to prove that something is true.
The Null Hypothesis and the Alternative Hypothesis
are chosen before the sample is drawn.
Step 3 Determining LEVEL OF
SIGNIFICANCE
 Before the study is started, we have to establish a
criterion called level of significance or alpha level which
is the highest risk of making a false positive error of
rejecting the null hypothesis that the investigator is
willing to accept.
 So the confidence with which the null hypothesis is
rejected or accepted is called as Level of significance
 A common alpha is 0.05 or 5%
The higher the significance level used for
testing a hypothesis, the higher the
probability of rejecting null hypothesis,
when it is true.
If P value is less than alpha ,we will reject
null hypothesis
If P value is more than or equal to alpha we
will not reject null hypothesis
STEP 4 Decide which test we have to use?
Parametric tests
• Their model specifies
certain condition about
the parameters of the
population from the
research sample is drawn
• Used for quantitative data
Non- parametric tests
• Their model does not
specify condition about
the parameters of which
the research sample is
drawn
• Used for qualitative data
Quantitative (or Continuous) Data
The quantitative data have a magnitude. The
characteristics is measured either on an
interval or on a ratio scale.
It got a numerical value
Age
Height, weight
RAL
Qualitative (or Discrete) Data
In such data there is no notion of
magnitude or size of the characteristic
or attribute as the same cannot be
measured.
 Young and old
 Gender
 Social class
 Redness of gingiva
 Efficacy of drug
Parametric tests Non parametric test
Paired t-test Wilcoxon signed rank test
Unpaired t-test
Z test
Mann-Whitney U-test
Chi square test
One way ANOVA Kruskal Wallis test
Fischer exact probability
test
Repeated ANOVA Friedman test
1 large sample tests
 When the sample size is greater than 30
 Generally ,2 types of data may be
encountered while testing hypothesis for large
samples
 When data is qualitative -------- test for
proportion( chi square /x2 test)
 When data is quantitative -------- test for
means(z-test )
 2. small sample tests
 When the sample size is smaller than 30
 Sample does not follow the normal distribution
,hence it is based on the assumption that the
population from which the sample is drawn follows
the normal distribution
 Student T test
unpaired and paired
 ANOVA
 Chi-square test(pronounced as kye)
Choice of an appropriate statistical
significance test to be used
 Association between two variables---- chi-square test
 Correlation between two variables ----- pearson’s or
spearman’s test
 One group on two occasions-------paired test
 One group on 3 or more occasions------------------ ANOVA
 Two separate groups------------unpaired t test, Mann-Whitney
u test
 3 or more separate groups--------ANOVA
step 6- Standard deviation
The standard deviation is the most
important and widely used measure of
studying dispersion.
It is also known as root mean square
deviation
Small standard deviation means a higher
degree of uniformity of observation
Standard deviation expressed with sigma s
Formula to caculate standard deviation
s
6mm,7 mm,4mm, 6mm,5 mm,6 mm,8 mm,4 mm
Mean = 6+ 7+4+6+5+6+8 +4 = 46/8 = 5.75 mm
8
SD s = 1.38873
Student’s t-test
Designed by W.S Gosette, whose pen name was
Student
t is ratio of observed difference between two
means of small samples to the standard error of
difference in the same
Sample here should be less than 30
t= difference between two means
S.E of difference between two means
T test
Paired t test
Unpaired t test
(independent or unmatched
or pooled t test)
Paired test- e.g clinical attachment loss(CAL)
before and after scaling
Unpaired t-test e.g. effect or scaling in males
and females ,The mean PI, GI, PD & CAL
between 02 groups at different time intervals.
 UNPAIRED T TEST-Steps
1 Hypothesis
2 find the observation difference between means of
two samples (x1-x 2)
3 calculate the standard error (SE) of difference
between the two means
4. Calculate t value t= (x1-x 2)
SE
SE= s root of 1/n1 + 1/n2
s - standard deviation
PAIRED T TEST-Steps
1 null hypothesis
2 find the observed difference in each set
paired observations before and after of
the same sample(x1-x2=x)
3 calculate mean of the differences
4 workout the standard error of the mean
5. Calculate the t value
Z test (standard normal test)
z test is done when the population is more than
30 for quantitative data
Used to compare :
1. Two sample means
2. Sample mean with population mean
3. Two sample proportions
4. Sample proportion with population
proportion
X- sample average
m- mean
s- standard deviation
ANOVA
Analysis of variance(F test)
Developed by Professor R A Fisher
Analysis of variance is useful to assess
the significance of difference of
differences between sample means
which are more than two in number
If the independant variable quantitative and
categorical (i.e. nominal, dichomatous, ordinal) the
correct multivariable technique is ANOVA
One way ANOVA
If the design include one independent variable
that technique is called one way ANOVA,
regardless of how many different groups are
compared.
Another term for one-way ANOVA is F- test.
F-test is a kind of super t-test that allows the
investigator to allow more than two means
simultaneously.
The ratio of the between group variance to
the within groups variance is called F(in honor
of Fischer).
F= s2
1 based on variation between the group
s2
2 based on variation between the group
Two way ANOVA
 More than one independent variable present eg
treatment plan A and B , age, sex
 The goal of ANOVA is to explain as much variation
in the continuous variable as possible, by using
one or more categorical variables to predict the
variation………..
 In this the impact of two different factors on the
variations in a specific variable is tested.
 Two way ANOVA is also called N way ANOVA
The chi square test for
quantitative data
Chi square test is used for
comparing a sample variance to
population variance
x2 = s2
s (n-1)
s2
p
Non parametric test
1.Chi square test for qualitative data ,developed by
karl pearson
Used to test the association between two events (to
test a given hypothesis)
e.g. cause and effect like tobacco use and cancer
Χ2 = ∑ (Oi – Ei)2/Ei
Oi observed frequencies Ei excepted frequencies
Frequency means the no of times the value occurrs in the data
Paired samples--The Wilcoxon signed-
rank test
Also known as matched pair test
It is a non-parametric statistical
hypothesis test
used either to test the location of a
population based on a sample of data, or
to compare the locations of two
populations using two matched
samples. Like more aggressive and less aggressive
3.unpaired samples -Mann –Whitney U
test
A non parametric test used to compare the
medians of two independent sample.it is the
non parametric equivalent of the t test
e.g, GCF GF levels between 2 groups at
different time interval
U=n1 n2 + n1(n1+n2) - R1
2
U=Mann-Whitney U test
n1 = sample size one
n2= Sample size two Ri =
Rank of the sample size
4. Fisher's exact test
Fisher's exact test used in the analysis
of contingency tables. Although in practice it
is employed when sample sizes are small, it
is valid for all sample sizes.
Inventor- Ronald Fisher, and is one of a class
of exact tests
Success and failure in group 1 and 2
5.McNemar’s test
A variant of chi squared test ,used when
the data is paired
it can be used to analyze retrospective
case-control studies, where each case is
matched to a particular control. Or it can be
used to analyze experimental studies,
where the two treatments are given to
matched subjects.
6.The Kruskal Wallis test
 The Kruskal Wallis test is the non parametric alternative
to the One Way ANOVA.
 The H test is used when the assumptions for ANOVA
aren’t met (like the assumption of normality). It is
sometimes called the one-way ANOVA on ranks, as the
ranks of the data values are used in the test rather than
the actual data points.
 The test determines whether the medians of two or more
groups are different.
7. The Friedman test
developed by Milton Friedman
The Friedman test is used for one-way
repeated measures analysis of variance by
ranks. In its use of ranks it is similar to
the Kruskal–Wallis one-way analysis of
variance by ranks.
The Friedman test is widely supported by
many statistical software packages.
Post-hoc test (multiple comparisons)
 “AFTER THIS”
 For comparison of three or more group means
we apply the analysis of variance (ANOVA)
method to decide if all means are equal or there
is at least one means are equal or there is at
least one mean which is different from others. If
we get significant result we can conclude that
there is difference in group means
 To know what specific pairs of group means
show differences-Post-hoc test (multiple
comparisons) procedures.
The set of comparison is referred as
a family of test
Bonferroni correction- safe option
Turkey’s HSD procedures- assumption met
Scheffe's procedures
Newman –keuls procedures
Dunnette’s procedures
Step 9 calculating Degree of
freedom
 No of independent members in the
sample
 The degrees of freedom formula is
straightforward. Calculating the degrees
of freedom is often the sample size minus
the number of parameters you’re
estimating:
step10.Use a t- table for determining p
value
The level of statistical significance is often expressed as
a p -value between 0 and 1. The smaller the p-value, the
stronger the evidence that you should reject the null
hypothesis.
 A p -value less than 0.05 (typically 0.05) is statistically
significant.
If P value is less than alpha ,we will reject null
hypothesis
If P value is more than or equal to alpha we will
not reject null hypothesis
Computer in biostatical analysis
The MINITAB ,SPSS,SAS and STATA are the
some well known statistical software
packages for personal computer which are
used for the tabulation and statistical
analysis of data
SPSS(Statistical Package for the Social Sciences) is
commonly used
Limitations of test of significance
1.Test are only useful aids for decision making
not decision making itself
2.Do not explain why does the difference exist
3. Result are based on probabilities and such
cannot expressed in full certainty
4.Inferences based on them cannot be said to
be entirely correct evidence connecting truth
of the hypothesis
Conclusion
 Tests of significance play an important role in conveying the results of
any research and thus the choice of an appropriate statistical test is
very important aa it decides the fate of out come of the study
 The tests are only useful aids for decision-making. Hence “proper
interpretation of statistical evidence is important to intelligent
decisions.”
 If the data deviate strongly from the assumptions of a parametric
procedure, using the parametric procedure could lead to incorrect
conclusions.
References
 Soben Peter Community Dentistry 6th Edition.
 Text book methods in bio statistics 7th edt. B K Majajan
 Jain S, Gupta A, Jain D. Common statistical tests in dental
research. Journal of Advanced Medical and Dental Sciences
Research. 2015 Jul 1;3(3):38.
 Joseph john Preventive and community dentistry 2nd edt
My sincere thanks to
 DR ARUNA D R
 DR VINAYAK S GOWDA
 DR AVINASH J L
 DR RAJIV N P
 DR REKHA JAGADEESH
 DR SANDEEP J N
 DR SOWMYA PRAVEEN
 ALL MY POST GRADUATE COLLEGUES
Previous seminar questions
 COMPONENTS OF LA
 Local anaesthetic drug ----lignocaine hydrochloride
 Vasopressor/vasoconstrictor drug---------Adrenalin
 Preservatives-methylparaben, thymol, chlorbutol
 Sodium chloride/Ringer’s solution
 Distilled water
 General preservative
 Alternative for methylparaben---sodium bisulfite,
metabisulfite
Short acting corticosteroid
Anaphylaxis- treatment
1. The first thing to do is to stop injection of allergen.
2. Call for help, check patient's vitals
3. Use 0.5ml ml of 0.1% of epinephrine intravenously.
4. If the patient pressure would not stabilize after 15
minutes, repeat this procedure. max 3 times
5. corticosteroids are very useful for such cases. IV OR
IM(prednisone, dexamethasone and hydrocortisone)
6. If a patient has signs of asphyxiation you should make an
injection of aminophylline 2.4% – 10-20 ml intravenously
7. Shift the patient to near hospital as early as possible
Signs and symptoms of anaphylactic
shock
•feeling lightheaded or faint.
•breathing difficulties – such as fast, shallow breathing.
•wheezing.
•a fast heartbeat.
•clammy skin.
•confusion and anxiety.
•collapsing or losing consciousness. hypotension
Skin reactions, including hives and itching and flushed or
pale skin.
Blood loss during flap surgery
 Ariaudo 1970 observed that a full mouth flap
surgery under general anesthesia blood loss is
around 300 ml.
 According to D A Baab 59.47+or-38.2ml
 Berdon -gingivectomies involving 5 to 14 teeth -5
ml to 149 ml
 According to Mclvor and Wengraf -10 fold increase
in blood loss per tooth during periodontal flap than
gingivectomies
Other names of lignocaine
Lidocaine
Brand name xylocaine

TEST OF SIGNIFICANCE.pptx

  • 1.
    TEST OF SIGNIFICANCE Dr JoiceP Jiji MDS first year GUIDED BY Dr Sandeep J N
  • 2.
    contents  Introduction  Commonterms in statistics  Biostatistics  Hypothesis –null and alternate  Test of significance  Parametric and non parametric tests  Z- test  Student t- test  ANOVA  Chi Square test
  • 3.
     Mc Nemar’stest  The Wilcoxon signed-rank test  Mann –Whitney U test  The Kruskal Wallis test  The Friedman tests  Fisher's exact test  Post hoc rank test  Conclusion  references
  • 4.
    Introduction Statistics is thediscipline that concerns the collection, organization, analysis, interpretation, and presentation of data Statistics is an important and integral part of research methodology. It is a pervasive force on which the entire spectrum of clinical decision making is dependent
  • 5.
    Test of significanceare one of the central concept in statistics  These are mathematical method by which the probability of an observed difference occurring by chance is found.
  • 6.
  • 7.
    Variable: A characteristicthat takes on different values in different, places or things. 2 types dependent and independent variable A dependent variable is the variable being tested in a scientific experiment. Examples of independent variables are • Age, sex, race
  • 8.
     Population: Itis an entire group of people or study elements— persons, things or measurements for which we have an interest at a particular time. Populations are determined by our sphere of interest. It may be infinite or finite.
  • 9.
     Sampling unit:Each member of a population.  Sample: It may be defined as a part of a population. It is a group of sampling units that form part of a population, generally selected so as to be representative of the population whose variables are under study. There are many kinds of sample methods in Biostatistics.
  • 10.
    Mean This measureimplies arithmetic average or arithmetic mean which is obtained by summing up all the observations and dividing the total by the number of observations. Median When all the observations of a variable are arranged in either ascending or descending order, the middle observation is known as median  Mode This is the most frequently occurring observation in a se
  • 11.
     6mm,7 mm,4mm,6mm,5 mm,6 mm,8 mm,4 mm  Mean = 6+ 7+4+6+5+6+8 +4 = 46/8 = 5.75 mm 8  Median = 4mm,4mm,5mm,6mm,6mm,6mm,7mm,8mm  Median 6+6= 12/2= 6 mm 2  Mode= 6mm  4mm,4mm,5mm,6mm,6mm,6mm ,7mm,8mm
  • 12.
    Normal distribution andNormal curve • Gaussian distribution, • First observed by Abraham de Moivre in 1733 • Probability distribution that is symmetric about the mean. • A theoretical , continuous, symmetrical ,unimodal distribution of infinite range • Most of the biological variables follow normal distribution
  • 13.
     The characteristicsof a normal curve are:  1. It is bell-shaped  2. It is symmetrical.  3. Mean, mode and median coincide. =0  4. It has two inflections  Total area is =1  Standard deviation=1
  • 15.
    STATISTICAL INFERENCE Inference meansdrawing of conclusion from data It is the process of drawing up conclusions from quantitative or qualitative information using the methods of statistics to describe and arrange the data and to test suitable hypothesis Statistical inference are based on probabilities and as such cannot be expressed with full certainty
  • 16.
    BIOSTATISTICS Biostatistics is theterm used when tools of statistics are applied to the data that is derived from biologic science such as medicine Statistical analysis is the back bone of research
  • 17.
    TEST OF SIGNIFICANCE Whenevertwo sets of observation are compared, it become essential to find out whether difference observed between the two group is because of sampling variation or any other factor
  • 18.
    STAGES IN PERFORMINGA TEST OF SIGNIFICANCE 1 Create a null hypothesis 2 Create an alternative hypothesis 3 Determine the significance level 4 Decide on the test we will use 5 Perform a power analysis to find out your sample size
  • 19.
    6 calculate thestandard deviation 7 Use the standard deviation 8 Determine the t- score(F,H,P,U) 9 Find the degree of freedom 10.Use a t- table for determining p value
  • 20.
    In Statistics, ahypothesis is defined as a formal statement, which gives the explanation about the relationship between the two or more variables of the specified population. It helps the researcher to translate the given problem to a clear explanation for the outcome of the study. What is a hypothesis ??? 20
  • 21.
    CHARECTERISTICS OF HYPOTHESIS 1.Hypothesis should be clear and precise. 2. Hypothesis should be capable of being tested. 3. It should state relationship between variables.
  • 22.
    4 It mustbe specific. 5 It should be stated as simple as possible. 6 It should be amenable to testing within a reasonable time. 7 It should be consistent with known facts.
  • 23.
    classification Based on theirformulation Null hypothesis and alternate hypothesis
  • 24.
    Null hypothesis It statesthat there is no real difference between the means (or proportions ) of the groups being compared (or that there is no real association between two continuous variables). It is denoted by Ho. Example- “ There is no difference in the clinical attachment level with treatment A or treatment B”.
  • 25.
    Step 2 Alternatehypothesis  If null hypothesis is rejected, we need another hypothesis…..an alternate hypothesis.  It states that there must be a true difference between the groups being compared.  It is denoted by HA or Ha or H1.  Example- “there is a difference in the clinical attachment gain with treatment A and treatment B”.
  • 26.
    In Hypothesis testingwe proceed on the basis of Null Hypothesis. We always keep Alternative Hypothesis in mind. It seems strange to begin the process by asserting that something is not true, but it is far easier to disprove an assertion than to prove that something is true. The Null Hypothesis and the Alternative Hypothesis are chosen before the sample is drawn.
  • 27.
    Step 3 DeterminingLEVEL OF SIGNIFICANCE  Before the study is started, we have to establish a criterion called level of significance or alpha level which is the highest risk of making a false positive error of rejecting the null hypothesis that the investigator is willing to accept.  So the confidence with which the null hypothesis is rejected or accepted is called as Level of significance  A common alpha is 0.05 or 5%
  • 28.
    The higher thesignificance level used for testing a hypothesis, the higher the probability of rejecting null hypothesis, when it is true. If P value is less than alpha ,we will reject null hypothesis If P value is more than or equal to alpha we will not reject null hypothesis
  • 29.
    STEP 4 Decidewhich test we have to use? Parametric tests • Their model specifies certain condition about the parameters of the population from the research sample is drawn • Used for quantitative data Non- parametric tests • Their model does not specify condition about the parameters of which the research sample is drawn • Used for qualitative data
  • 30.
    Quantitative (or Continuous)Data The quantitative data have a magnitude. The characteristics is measured either on an interval or on a ratio scale. It got a numerical value Age Height, weight RAL
  • 31.
    Qualitative (or Discrete)Data In such data there is no notion of magnitude or size of the characteristic or attribute as the same cannot be measured.  Young and old  Gender  Social class  Redness of gingiva  Efficacy of drug
  • 32.
    Parametric tests Nonparametric test Paired t-test Wilcoxon signed rank test Unpaired t-test Z test Mann-Whitney U-test Chi square test One way ANOVA Kruskal Wallis test Fischer exact probability test Repeated ANOVA Friedman test
  • 33.
    1 large sampletests  When the sample size is greater than 30  Generally ,2 types of data may be encountered while testing hypothesis for large samples  When data is qualitative -------- test for proportion( chi square /x2 test)  When data is quantitative -------- test for means(z-test )
  • 34.
     2. smallsample tests  When the sample size is smaller than 30  Sample does not follow the normal distribution ,hence it is based on the assumption that the population from which the sample is drawn follows the normal distribution  Student T test unpaired and paired  ANOVA  Chi-square test(pronounced as kye)
  • 35.
    Choice of anappropriate statistical significance test to be used  Association between two variables---- chi-square test  Correlation between two variables ----- pearson’s or spearman’s test  One group on two occasions-------paired test  One group on 3 or more occasions------------------ ANOVA  Two separate groups------------unpaired t test, Mann-Whitney u test  3 or more separate groups--------ANOVA
  • 36.
    step 6- Standarddeviation The standard deviation is the most important and widely used measure of studying dispersion. It is also known as root mean square deviation Small standard deviation means a higher degree of uniformity of observation Standard deviation expressed with sigma s
  • 37.
    Formula to caculatestandard deviation s 6mm,7 mm,4mm, 6mm,5 mm,6 mm,8 mm,4 mm Mean = 6+ 7+4+6+5+6+8 +4 = 46/8 = 5.75 mm 8 SD s = 1.38873
  • 38.
    Student’s t-test Designed byW.S Gosette, whose pen name was Student t is ratio of observed difference between two means of small samples to the standard error of difference in the same Sample here should be less than 30
  • 39.
    t= difference betweentwo means S.E of difference between two means T test Paired t test Unpaired t test (independent or unmatched or pooled t test)
  • 40.
    Paired test- e.gclinical attachment loss(CAL) before and after scaling Unpaired t-test e.g. effect or scaling in males and females ,The mean PI, GI, PD & CAL between 02 groups at different time intervals.
  • 41.
     UNPAIRED TTEST-Steps 1 Hypothesis 2 find the observation difference between means of two samples (x1-x 2) 3 calculate the standard error (SE) of difference between the two means 4. Calculate t value t= (x1-x 2) SE SE= s root of 1/n1 + 1/n2 s - standard deviation
  • 42.
    PAIRED T TEST-Steps 1null hypothesis 2 find the observed difference in each set paired observations before and after of the same sample(x1-x2=x) 3 calculate mean of the differences 4 workout the standard error of the mean 5. Calculate the t value
  • 44.
    Z test (standardnormal test) z test is done when the population is more than 30 for quantitative data Used to compare : 1. Two sample means 2. Sample mean with population mean 3. Two sample proportions 4. Sample proportion with population proportion
  • 45.
    X- sample average m-mean s- standard deviation
  • 46.
    ANOVA Analysis of variance(Ftest) Developed by Professor R A Fisher Analysis of variance is useful to assess the significance of difference of differences between sample means which are more than two in number
  • 47.
    If the independantvariable quantitative and categorical (i.e. nominal, dichomatous, ordinal) the correct multivariable technique is ANOVA
  • 48.
    One way ANOVA Ifthe design include one independent variable that technique is called one way ANOVA, regardless of how many different groups are compared. Another term for one-way ANOVA is F- test. F-test is a kind of super t-test that allows the investigator to allow more than two means simultaneously.
  • 49.
    The ratio ofthe between group variance to the within groups variance is called F(in honor of Fischer). F= s2 1 based on variation between the group s2 2 based on variation between the group
  • 50.
    Two way ANOVA More than one independent variable present eg treatment plan A and B , age, sex  The goal of ANOVA is to explain as much variation in the continuous variable as possible, by using one or more categorical variables to predict the variation………..  In this the impact of two different factors on the variations in a specific variable is tested.  Two way ANOVA is also called N way ANOVA
  • 51.
    The chi squaretest for quantitative data Chi square test is used for comparing a sample variance to population variance x2 = s2 s (n-1) s2 p
  • 53.
    Non parametric test 1.Chisquare test for qualitative data ,developed by karl pearson Used to test the association between two events (to test a given hypothesis) e.g. cause and effect like tobacco use and cancer Χ2 = ∑ (Oi – Ei)2/Ei Oi observed frequencies Ei excepted frequencies Frequency means the no of times the value occurrs in the data
  • 54.
    Paired samples--The Wilcoxonsigned- rank test Also known as matched pair test It is a non-parametric statistical hypothesis test used either to test the location of a population based on a sample of data, or to compare the locations of two populations using two matched samples. Like more aggressive and less aggressive
  • 56.
    3.unpaired samples -Mann–Whitney U test A non parametric test used to compare the medians of two independent sample.it is the non parametric equivalent of the t test e.g, GCF GF levels between 2 groups at different time interval
  • 57.
    U=n1 n2 +n1(n1+n2) - R1 2 U=Mann-Whitney U test n1 = sample size one n2= Sample size two Ri = Rank of the sample size
  • 58.
    4. Fisher's exacttest Fisher's exact test used in the analysis of contingency tables. Although in practice it is employed when sample sizes are small, it is valid for all sample sizes. Inventor- Ronald Fisher, and is one of a class of exact tests
  • 59.
    Success and failurein group 1 and 2
  • 60.
    5.McNemar’s test A variantof chi squared test ,used when the data is paired it can be used to analyze retrospective case-control studies, where each case is matched to a particular control. Or it can be used to analyze experimental studies, where the two treatments are given to matched subjects.
  • 61.
    6.The Kruskal Wallistest  The Kruskal Wallis test is the non parametric alternative to the One Way ANOVA.  The H test is used when the assumptions for ANOVA aren’t met (like the assumption of normality). It is sometimes called the one-way ANOVA on ranks, as the ranks of the data values are used in the test rather than the actual data points.  The test determines whether the medians of two or more groups are different.
  • 62.
    7. The Friedmantest developed by Milton Friedman The Friedman test is used for one-way repeated measures analysis of variance by ranks. In its use of ranks it is similar to the Kruskal–Wallis one-way analysis of variance by ranks. The Friedman test is widely supported by many statistical software packages.
  • 63.
    Post-hoc test (multiplecomparisons)  “AFTER THIS”  For comparison of three or more group means we apply the analysis of variance (ANOVA) method to decide if all means are equal or there is at least one means are equal or there is at least one mean which is different from others. If we get significant result we can conclude that there is difference in group means  To know what specific pairs of group means show differences-Post-hoc test (multiple comparisons) procedures.
  • 64.
    The set ofcomparison is referred as a family of test Bonferroni correction- safe option Turkey’s HSD procedures- assumption met Scheffe's procedures Newman –keuls procedures Dunnette’s procedures
  • 65.
    Step 9 calculatingDegree of freedom  No of independent members in the sample  The degrees of freedom formula is straightforward. Calculating the degrees of freedom is often the sample size minus the number of parameters you’re estimating:
  • 66.
    step10.Use a t-table for determining p value
  • 67.
    The level ofstatistical significance is often expressed as a p -value between 0 and 1. The smaller the p-value, the stronger the evidence that you should reject the null hypothesis.  A p -value less than 0.05 (typically 0.05) is statistically significant. If P value is less than alpha ,we will reject null hypothesis If P value is more than or equal to alpha we will not reject null hypothesis
  • 68.
    Computer in biostaticalanalysis The MINITAB ,SPSS,SAS and STATA are the some well known statistical software packages for personal computer which are used for the tabulation and statistical analysis of data SPSS(Statistical Package for the Social Sciences) is commonly used
  • 69.
    Limitations of testof significance 1.Test are only useful aids for decision making not decision making itself 2.Do not explain why does the difference exist 3. Result are based on probabilities and such cannot expressed in full certainty 4.Inferences based on them cannot be said to be entirely correct evidence connecting truth of the hypothesis
  • 70.
    Conclusion  Tests ofsignificance play an important role in conveying the results of any research and thus the choice of an appropriate statistical test is very important aa it decides the fate of out come of the study  The tests are only useful aids for decision-making. Hence “proper interpretation of statistical evidence is important to intelligent decisions.”  If the data deviate strongly from the assumptions of a parametric procedure, using the parametric procedure could lead to incorrect conclusions.
  • 71.
    References  Soben PeterCommunity Dentistry 6th Edition.  Text book methods in bio statistics 7th edt. B K Majajan  Jain S, Gupta A, Jain D. Common statistical tests in dental research. Journal of Advanced Medical and Dental Sciences Research. 2015 Jul 1;3(3):38.  Joseph john Preventive and community dentistry 2nd edt
  • 72.
    My sincere thanksto  DR ARUNA D R  DR VINAYAK S GOWDA  DR AVINASH J L  DR RAJIV N P  DR REKHA JAGADEESH  DR SANDEEP J N  DR SOWMYA PRAVEEN  ALL MY POST GRADUATE COLLEGUES
  • 73.
    Previous seminar questions COMPONENTS OF LA  Local anaesthetic drug ----lignocaine hydrochloride  Vasopressor/vasoconstrictor drug---------Adrenalin  Preservatives-methylparaben, thymol, chlorbutol  Sodium chloride/Ringer’s solution  Distilled water  General preservative  Alternative for methylparaben---sodium bisulfite, metabisulfite
  • 74.
  • 75.
    Anaphylaxis- treatment 1. Thefirst thing to do is to stop injection of allergen. 2. Call for help, check patient's vitals 3. Use 0.5ml ml of 0.1% of epinephrine intravenously. 4. If the patient pressure would not stabilize after 15 minutes, repeat this procedure. max 3 times 5. corticosteroids are very useful for such cases. IV OR IM(prednisone, dexamethasone and hydrocortisone) 6. If a patient has signs of asphyxiation you should make an injection of aminophylline 2.4% – 10-20 ml intravenously 7. Shift the patient to near hospital as early as possible
  • 76.
    Signs and symptomsof anaphylactic shock •feeling lightheaded or faint. •breathing difficulties – such as fast, shallow breathing. •wheezing. •a fast heartbeat. •clammy skin. •confusion and anxiety. •collapsing or losing consciousness. hypotension Skin reactions, including hives and itching and flushed or pale skin.
  • 77.
    Blood loss duringflap surgery  Ariaudo 1970 observed that a full mouth flap surgery under general anesthesia blood loss is around 300 ml.  According to D A Baab 59.47+or-38.2ml  Berdon -gingivectomies involving 5 to 14 teeth -5 ml to 149 ml  According to Mclvor and Wengraf -10 fold increase in blood loss per tooth during periodontal flap than gingivectomies
  • 78.
    Other names oflignocaine Lidocaine Brand name xylocaine