Downloaded 113 times


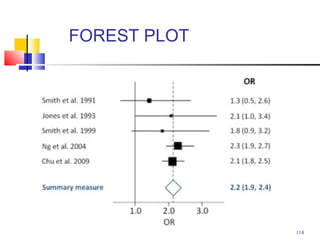
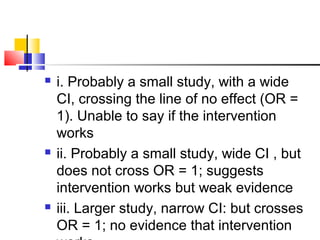
![ A forest plot (or blobbogram[1]
) is a
graphical display designed to illustrate
the relative strength of treatment effects
in multiple quantitative scientific studies
addressing the same question. It was
developed for use in medical research
as a means of graphically representing
a meta-analysis of the results of
randomized controlled trials.
116](https://image.slidesharecdn.com/journalclubdnbstatistics-140715092153-phpapp01/85/bio-statistics-for-clinical-research-116-320.jpg)


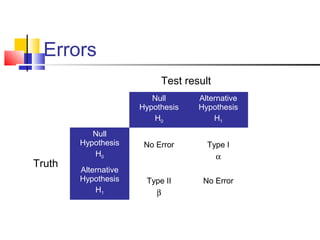
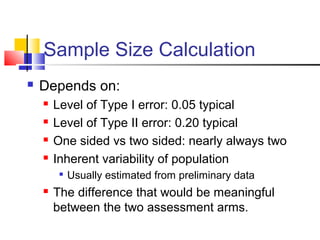
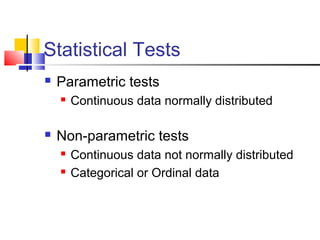
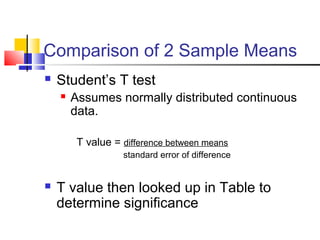
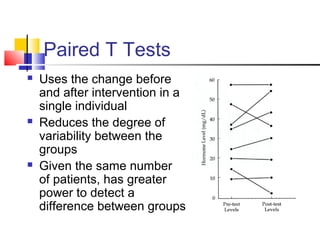
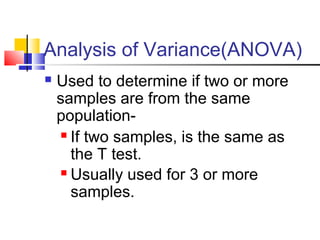
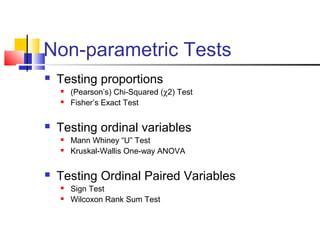
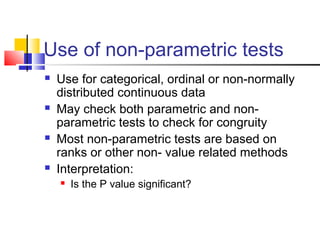
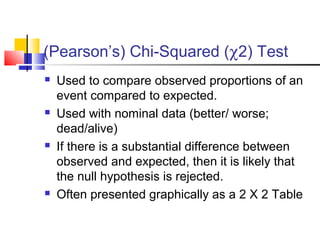
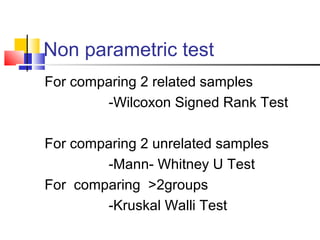
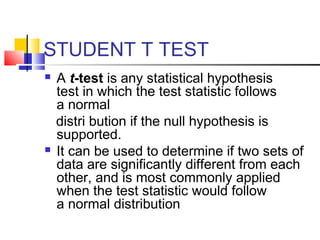
This document provides an overview of statistical methods used in clinical research. It discusses different data types, descriptive statistics for summarizing data, standard error and confidence intervals. It also covers statistical tests such as t-tests, ANOVA, chi-squared tests, and non-parametric tests for comparing groups. Sample size calculations and the concept of type 1 and type 2 errors are also reviewed. The document serves as an introduction to common statistical analyses and concepts in clinical research.


