Download to read offline
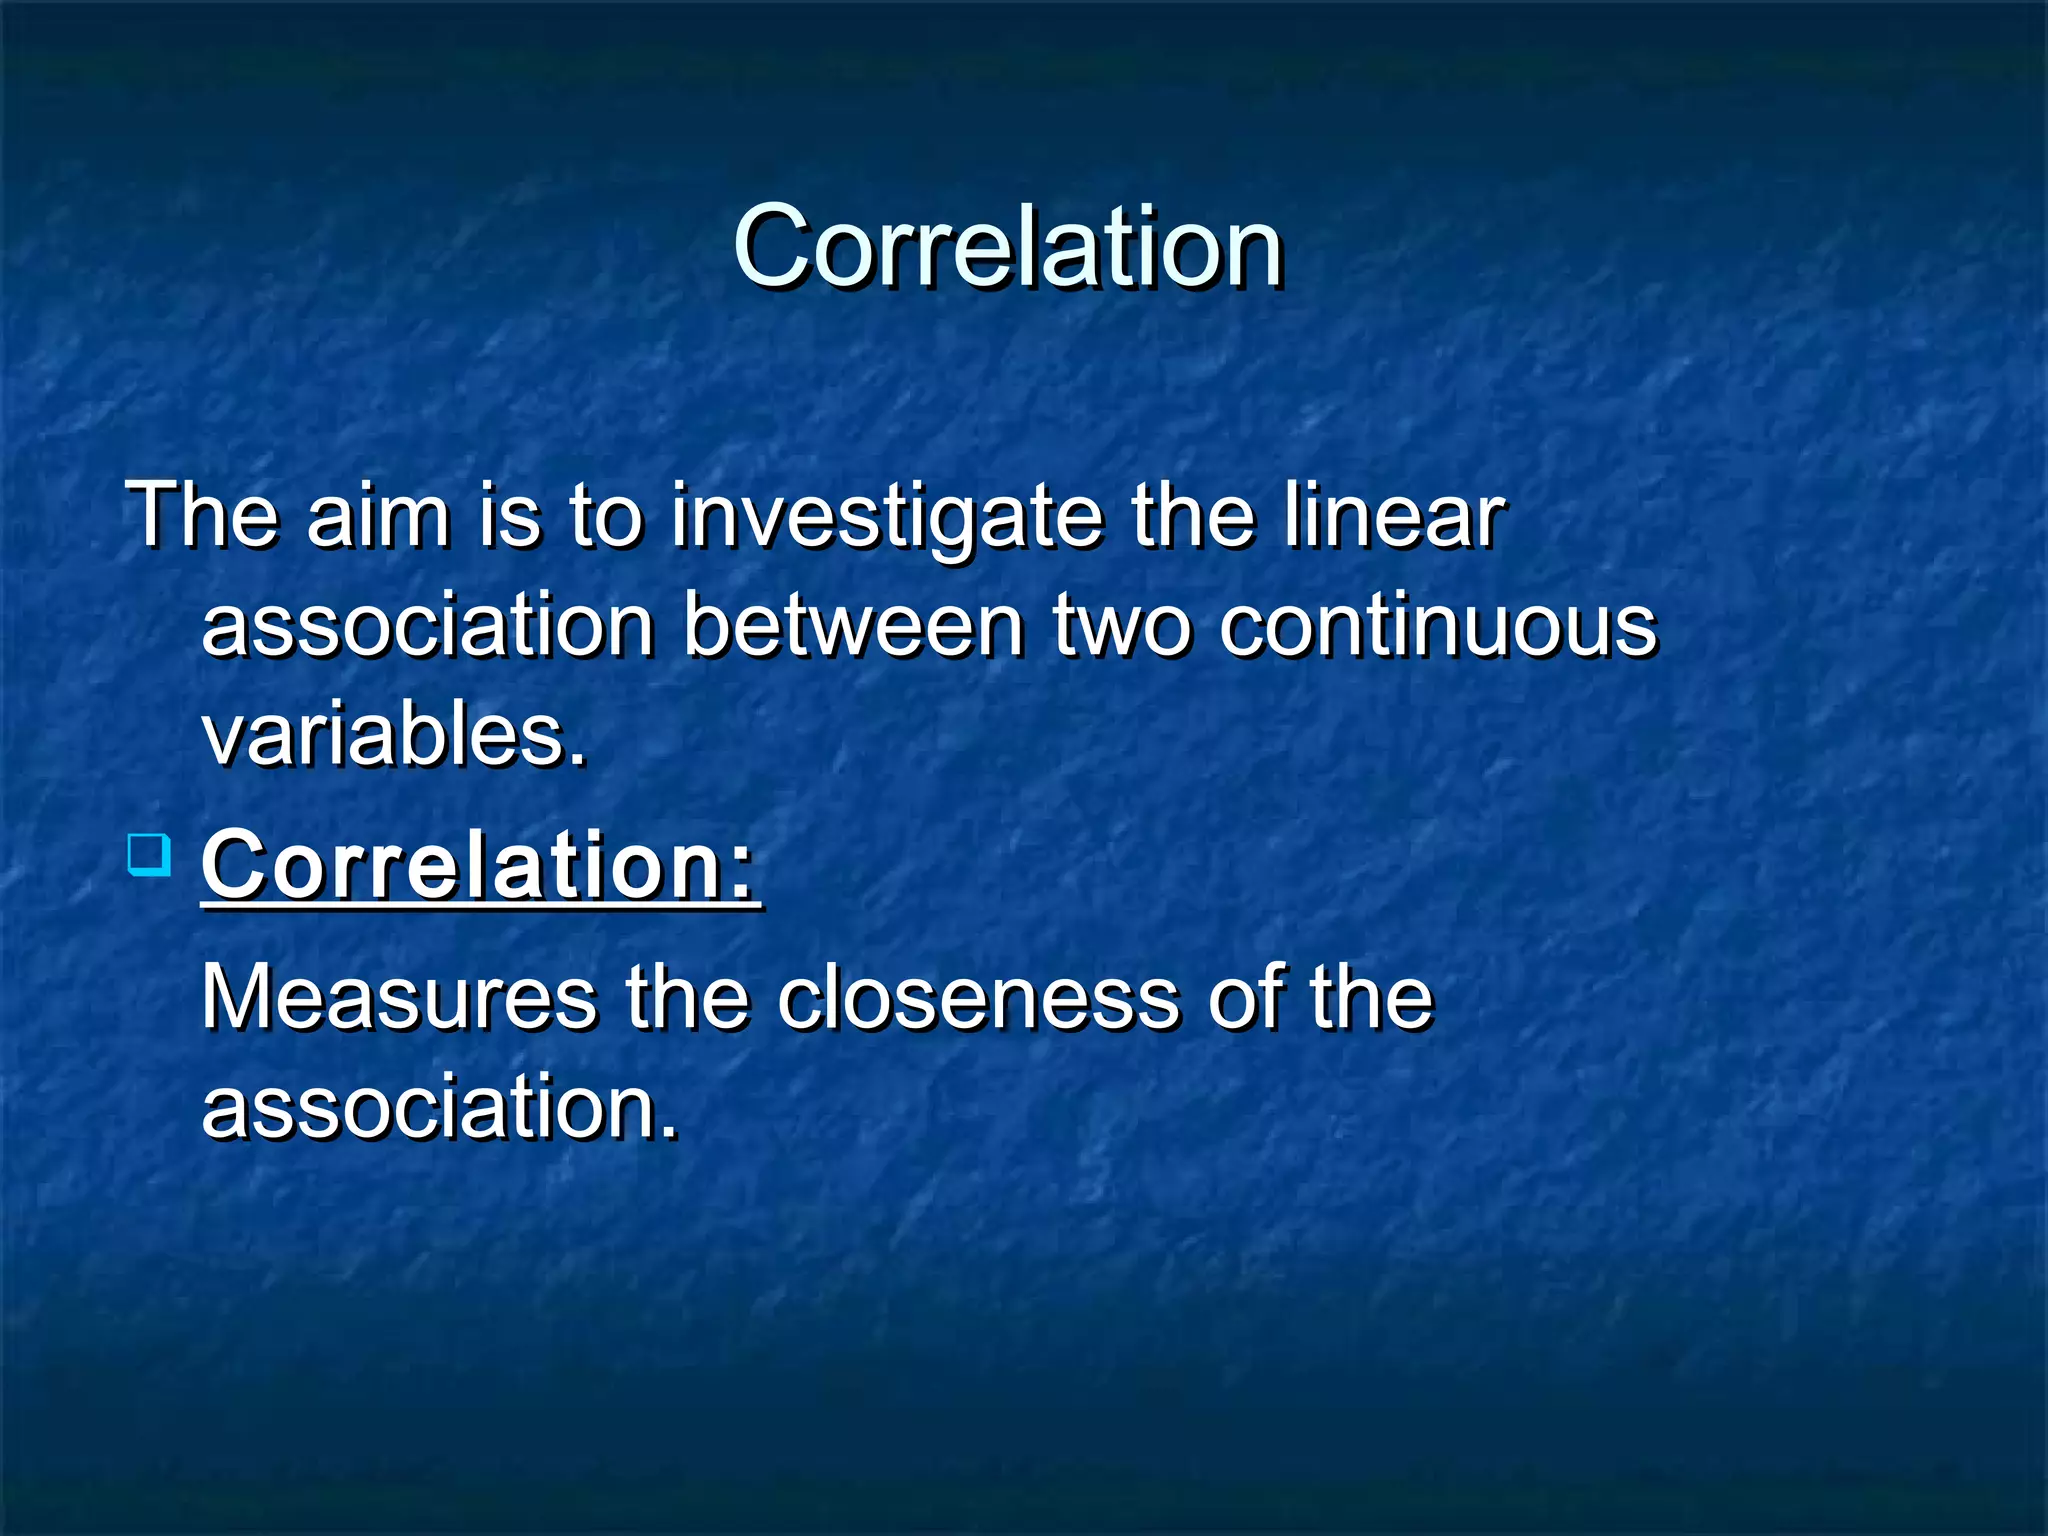
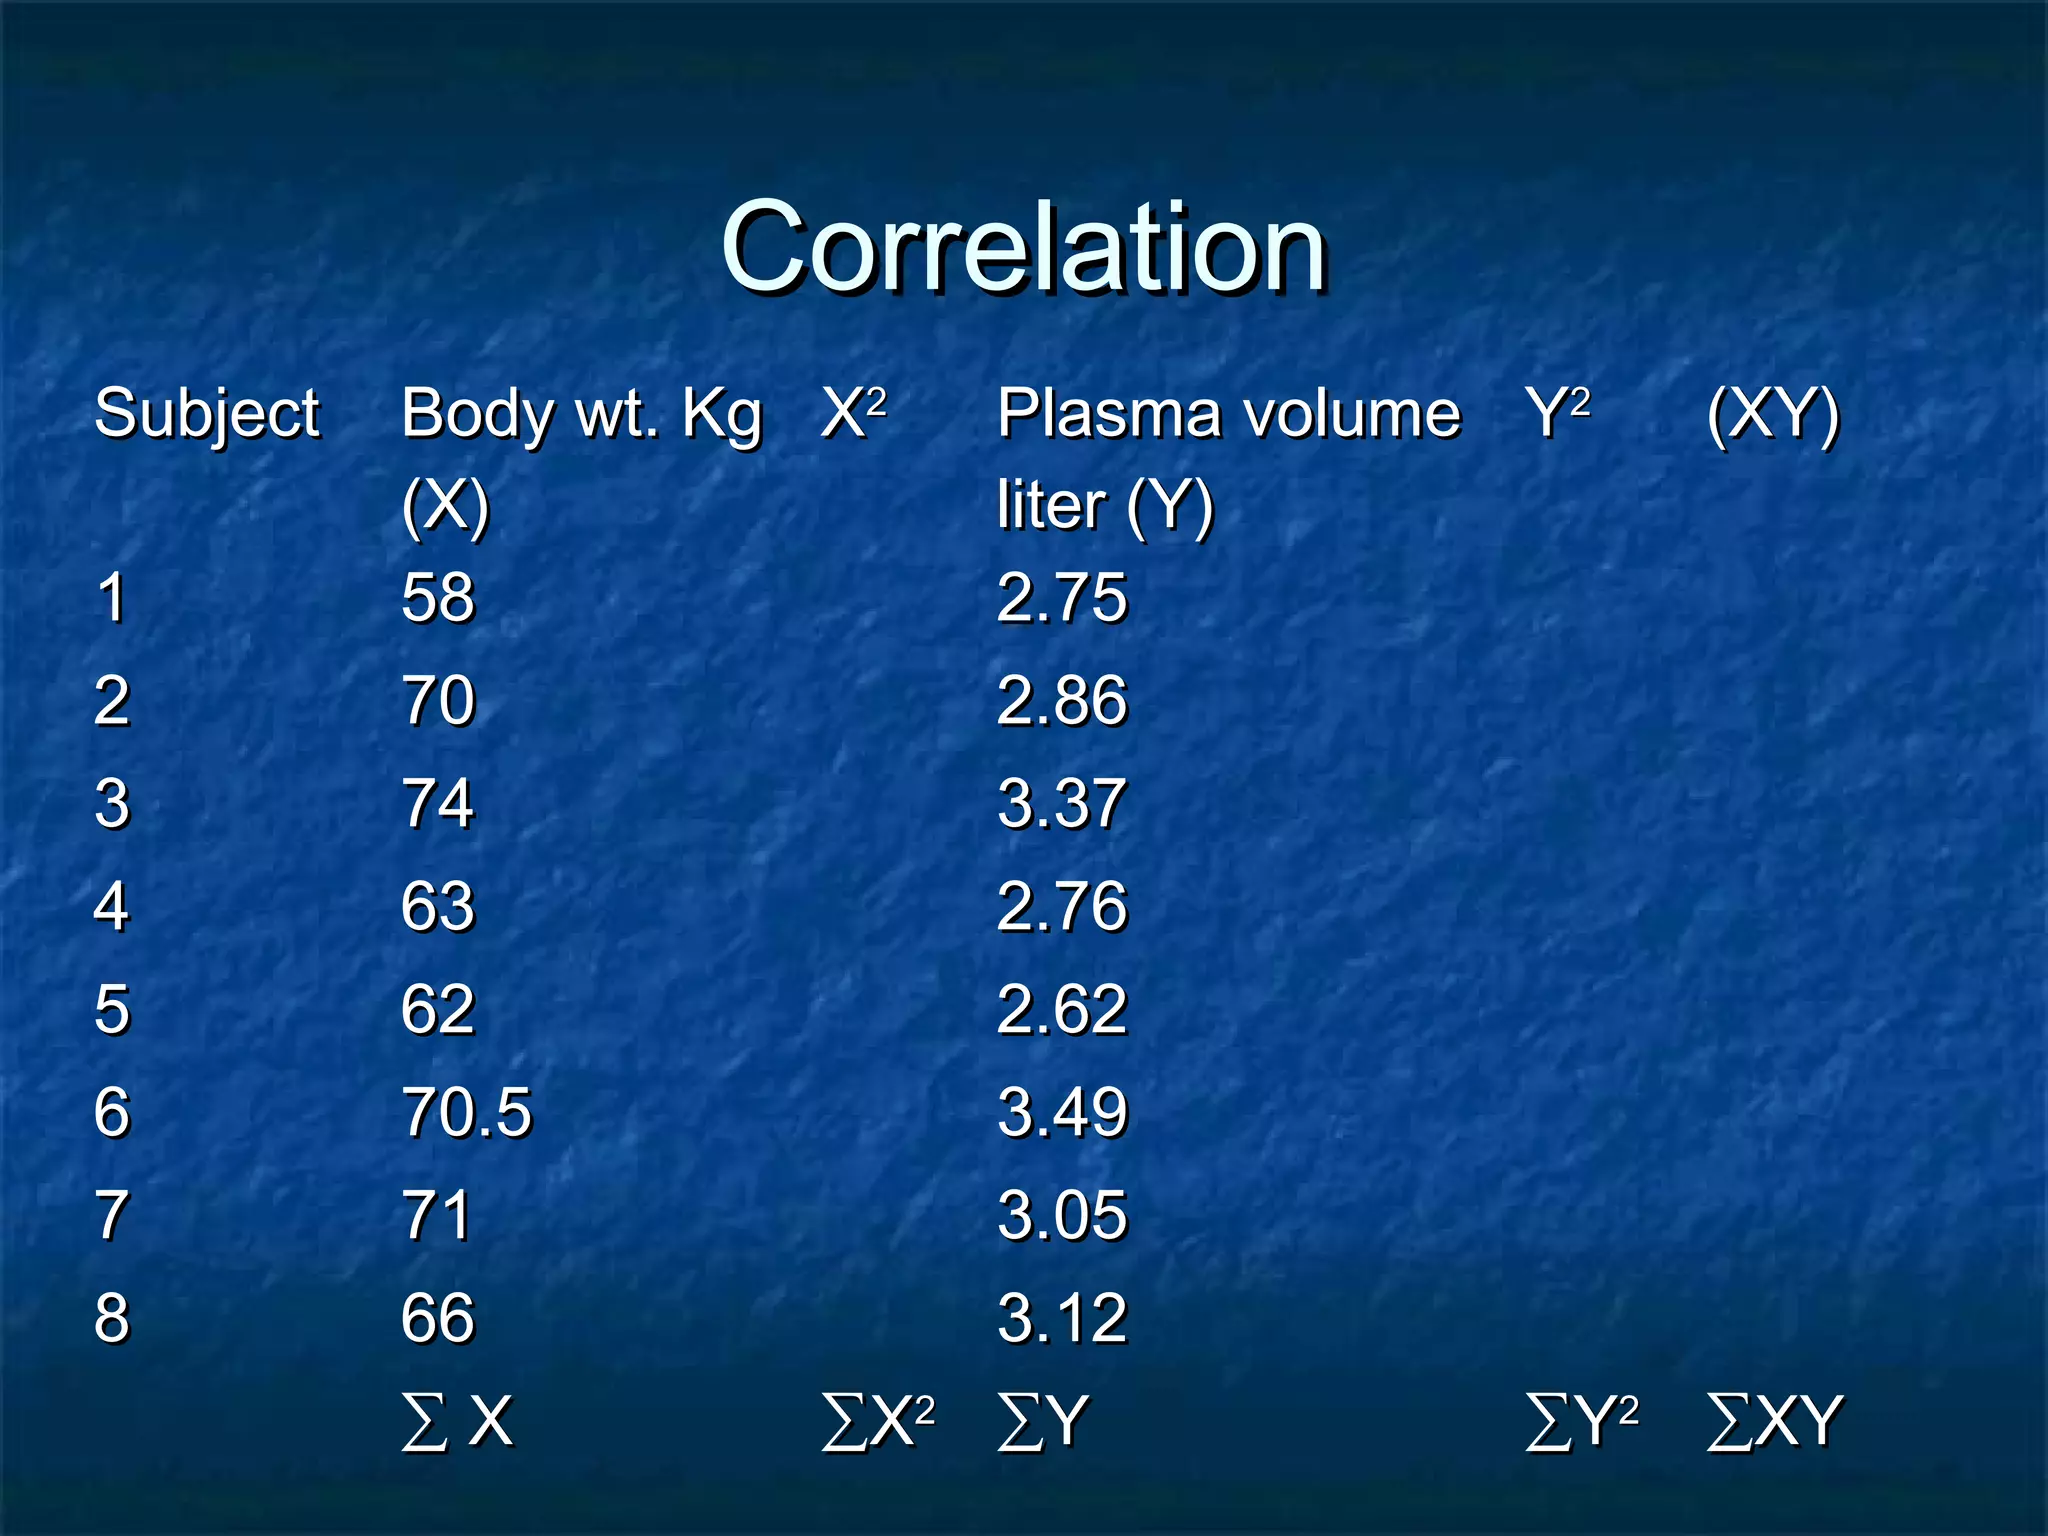
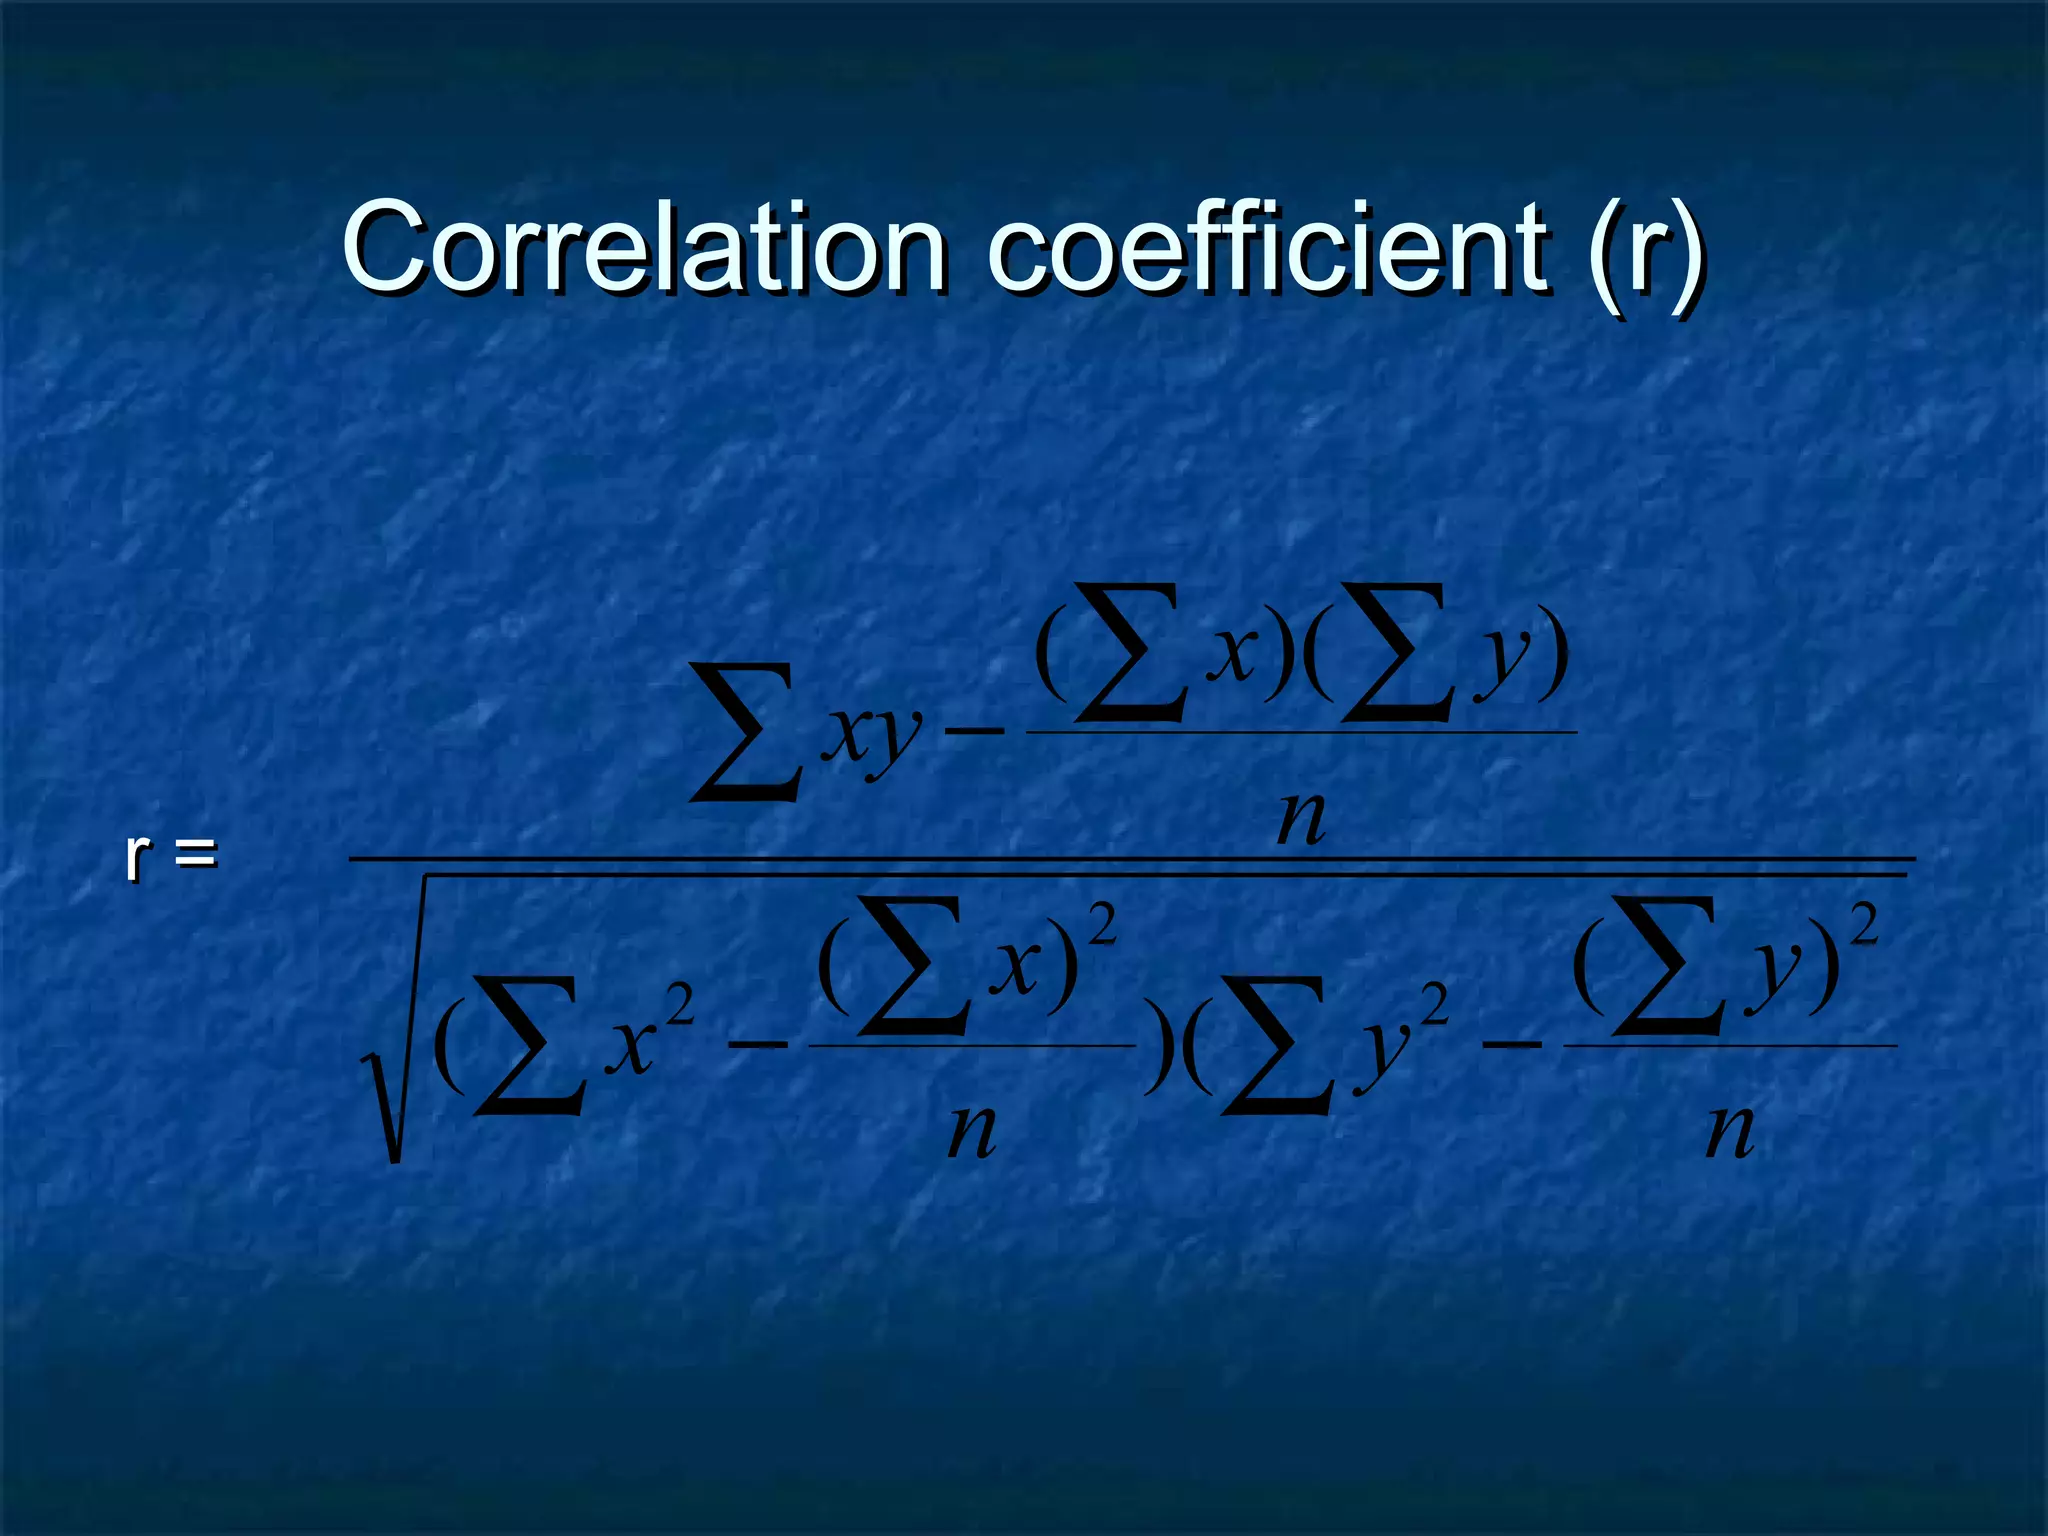
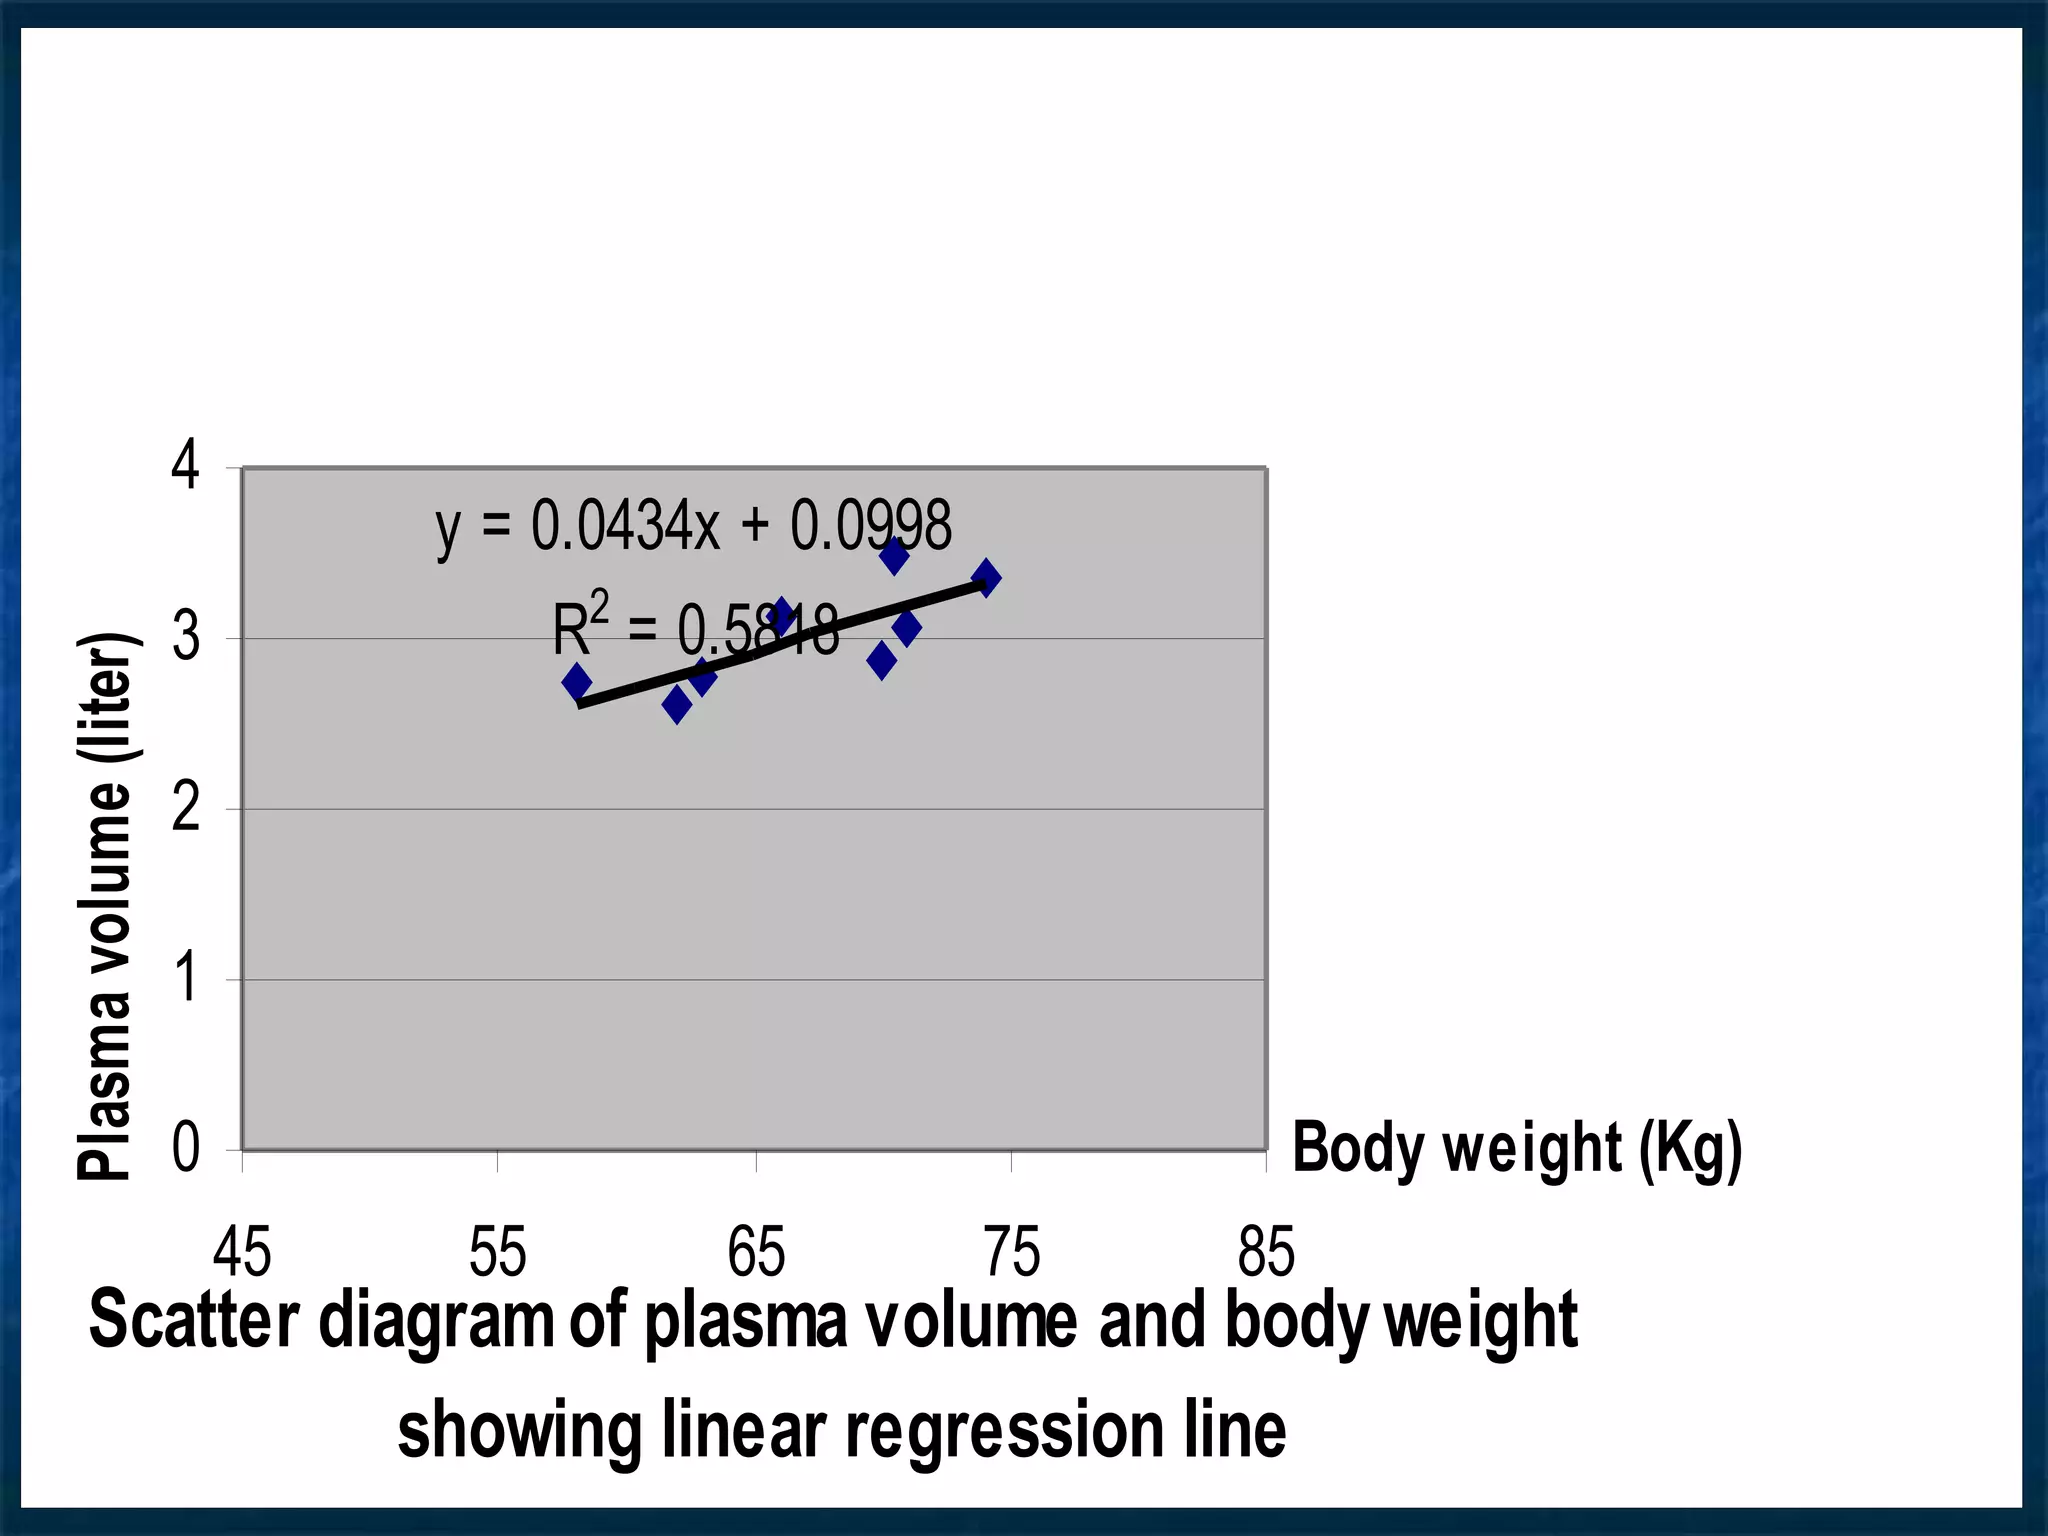
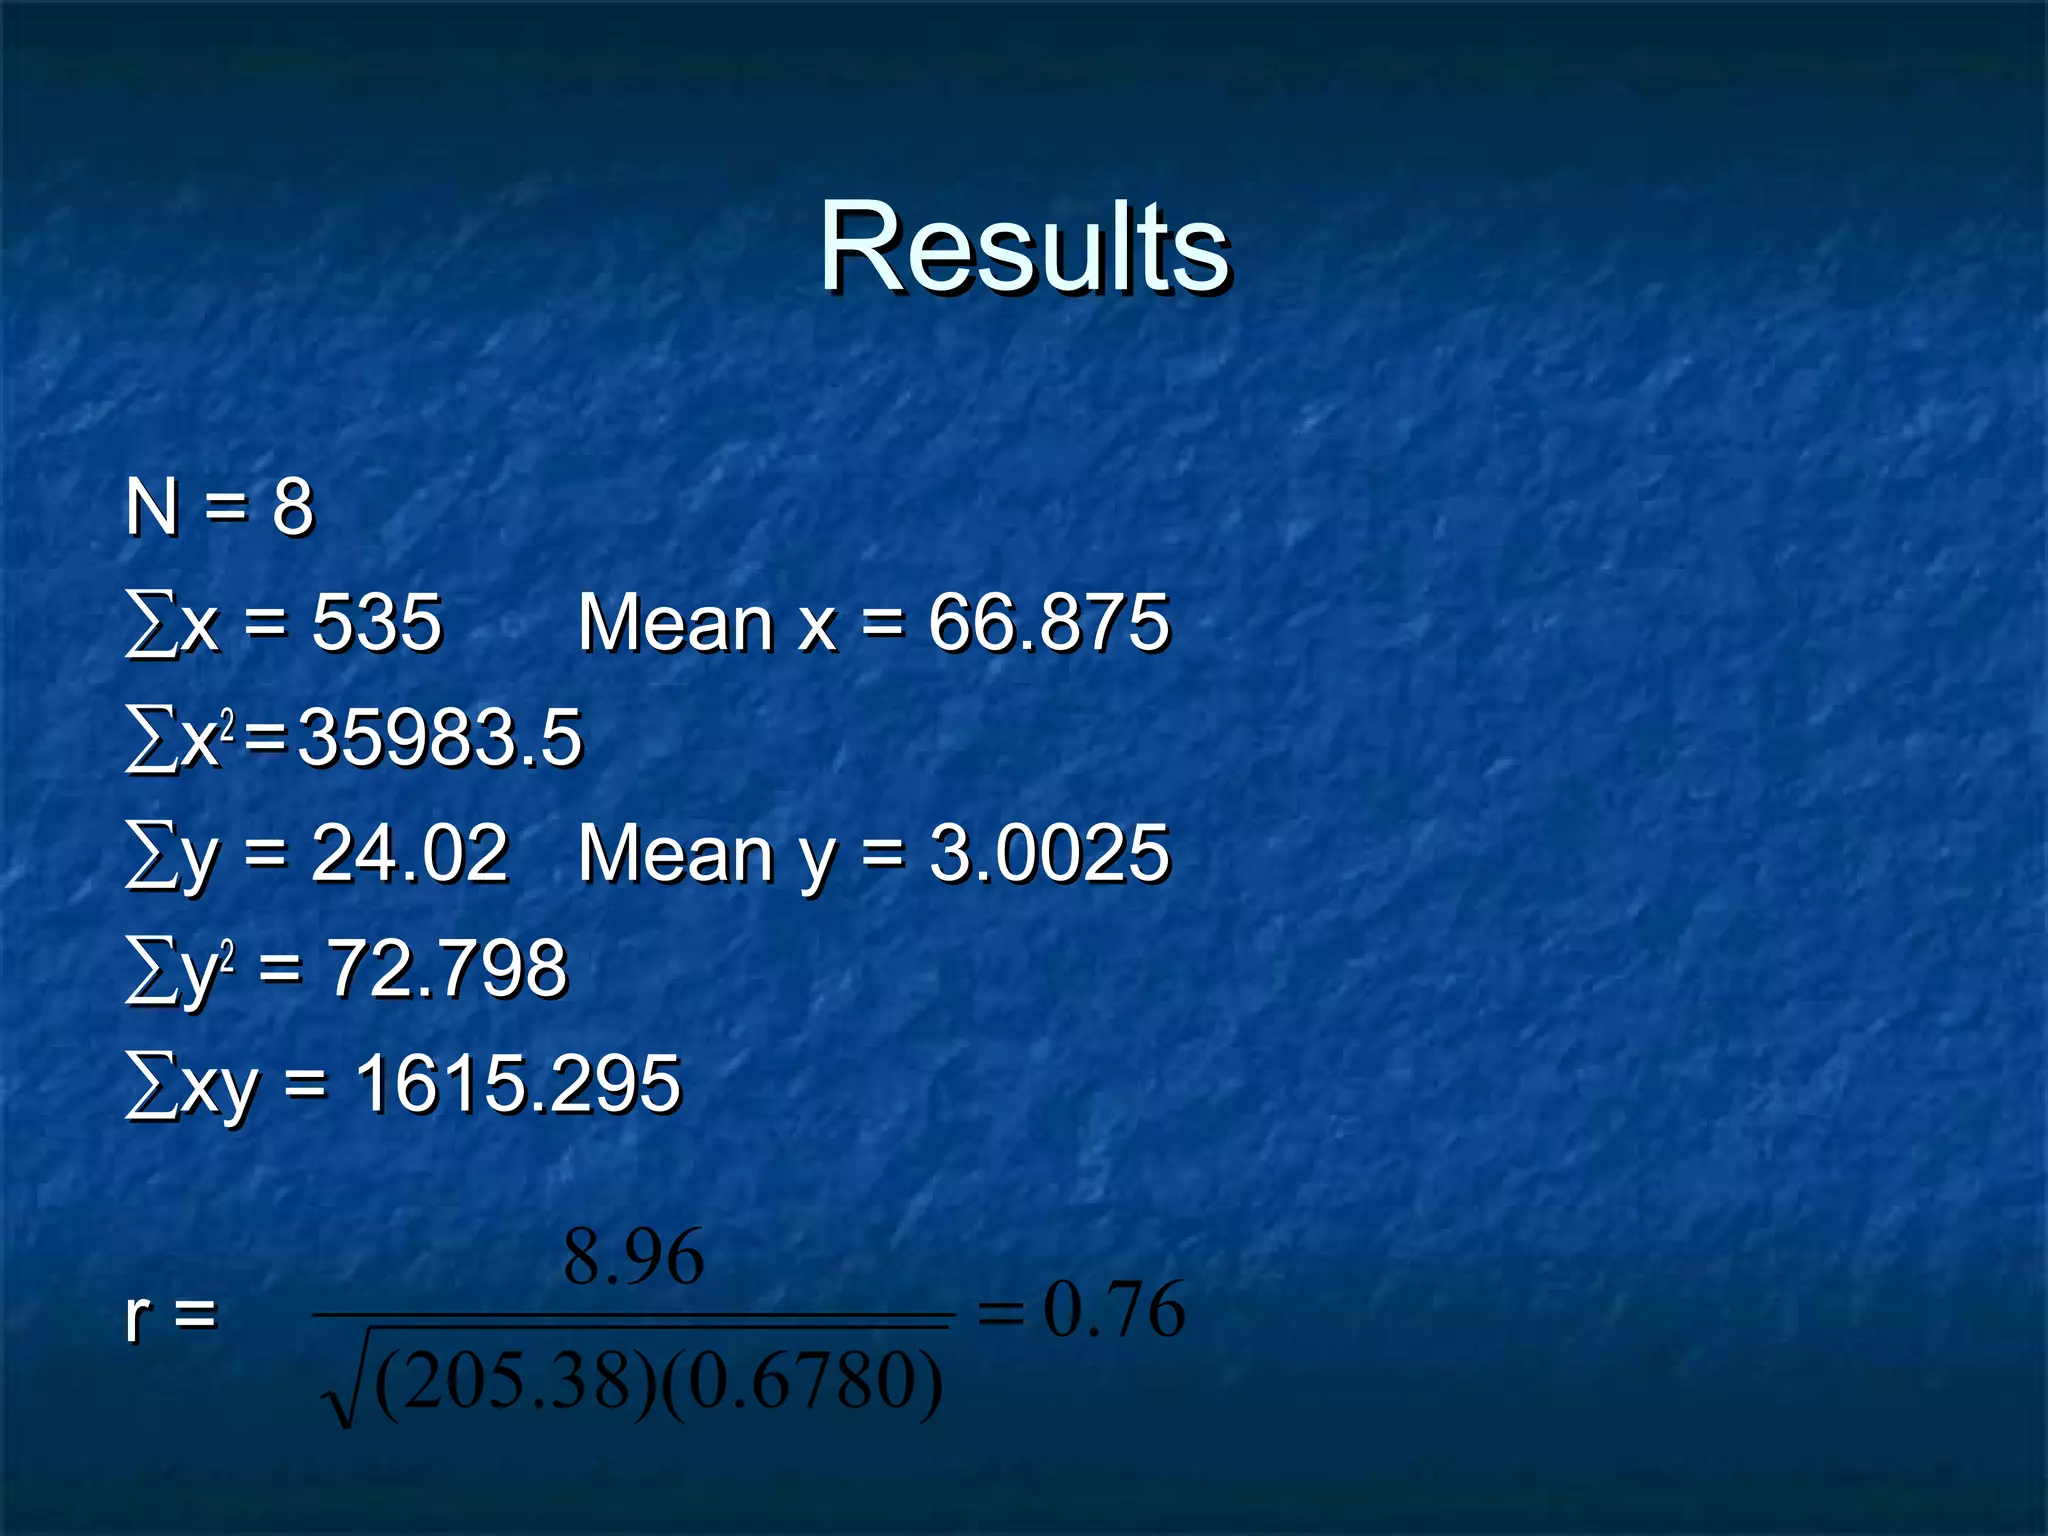
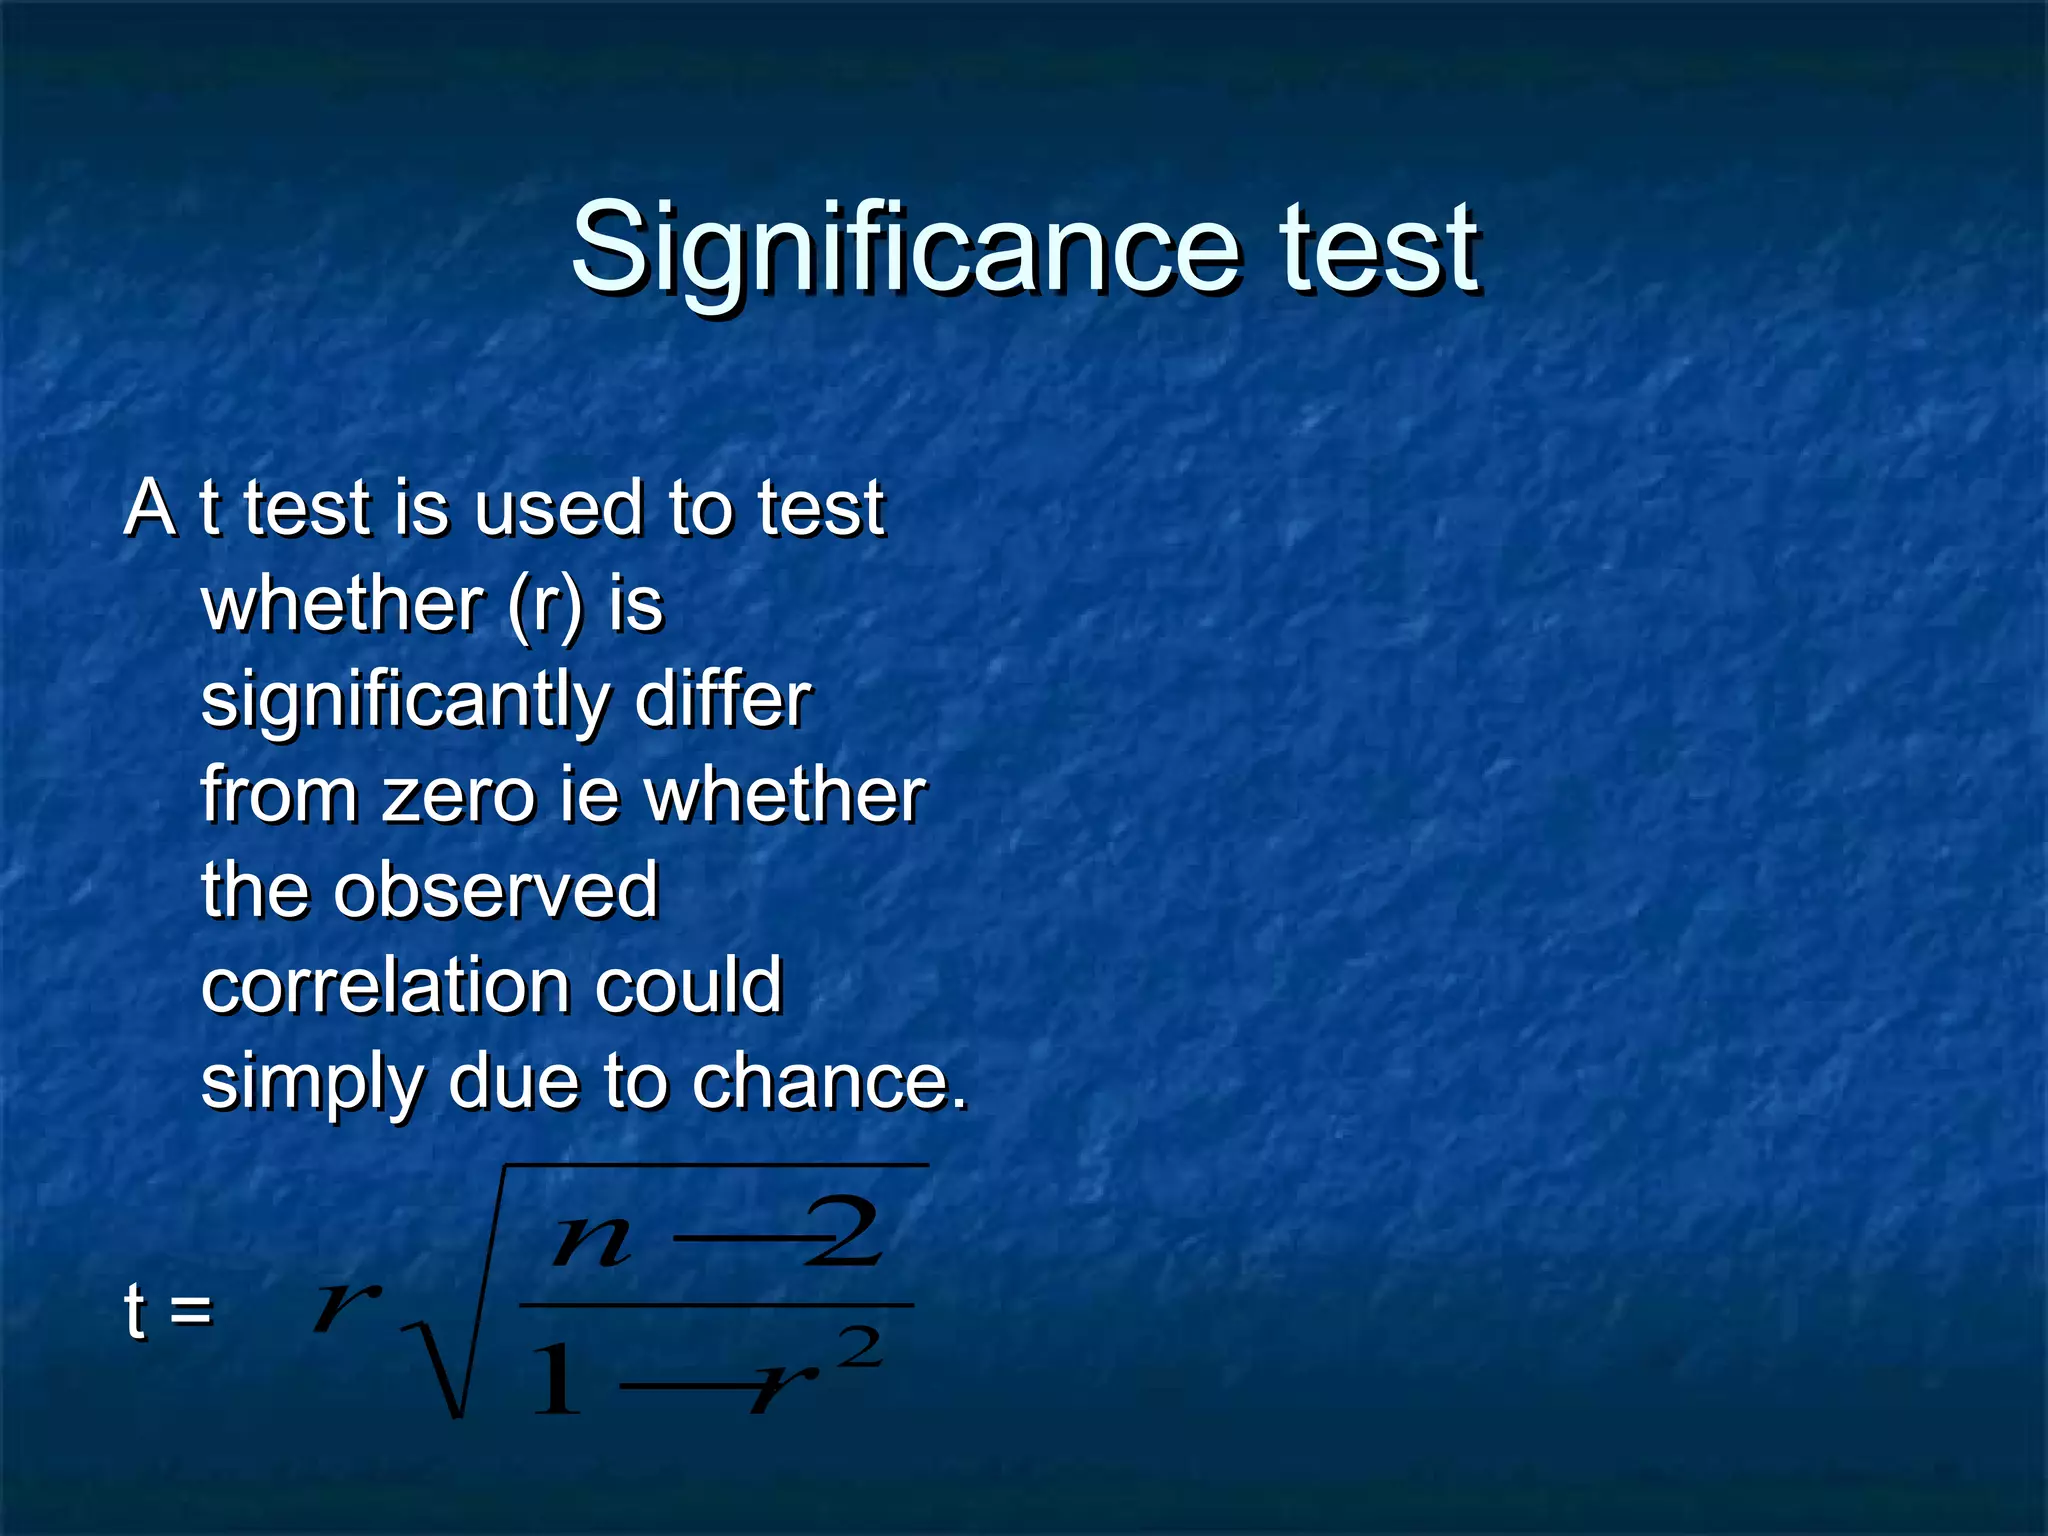
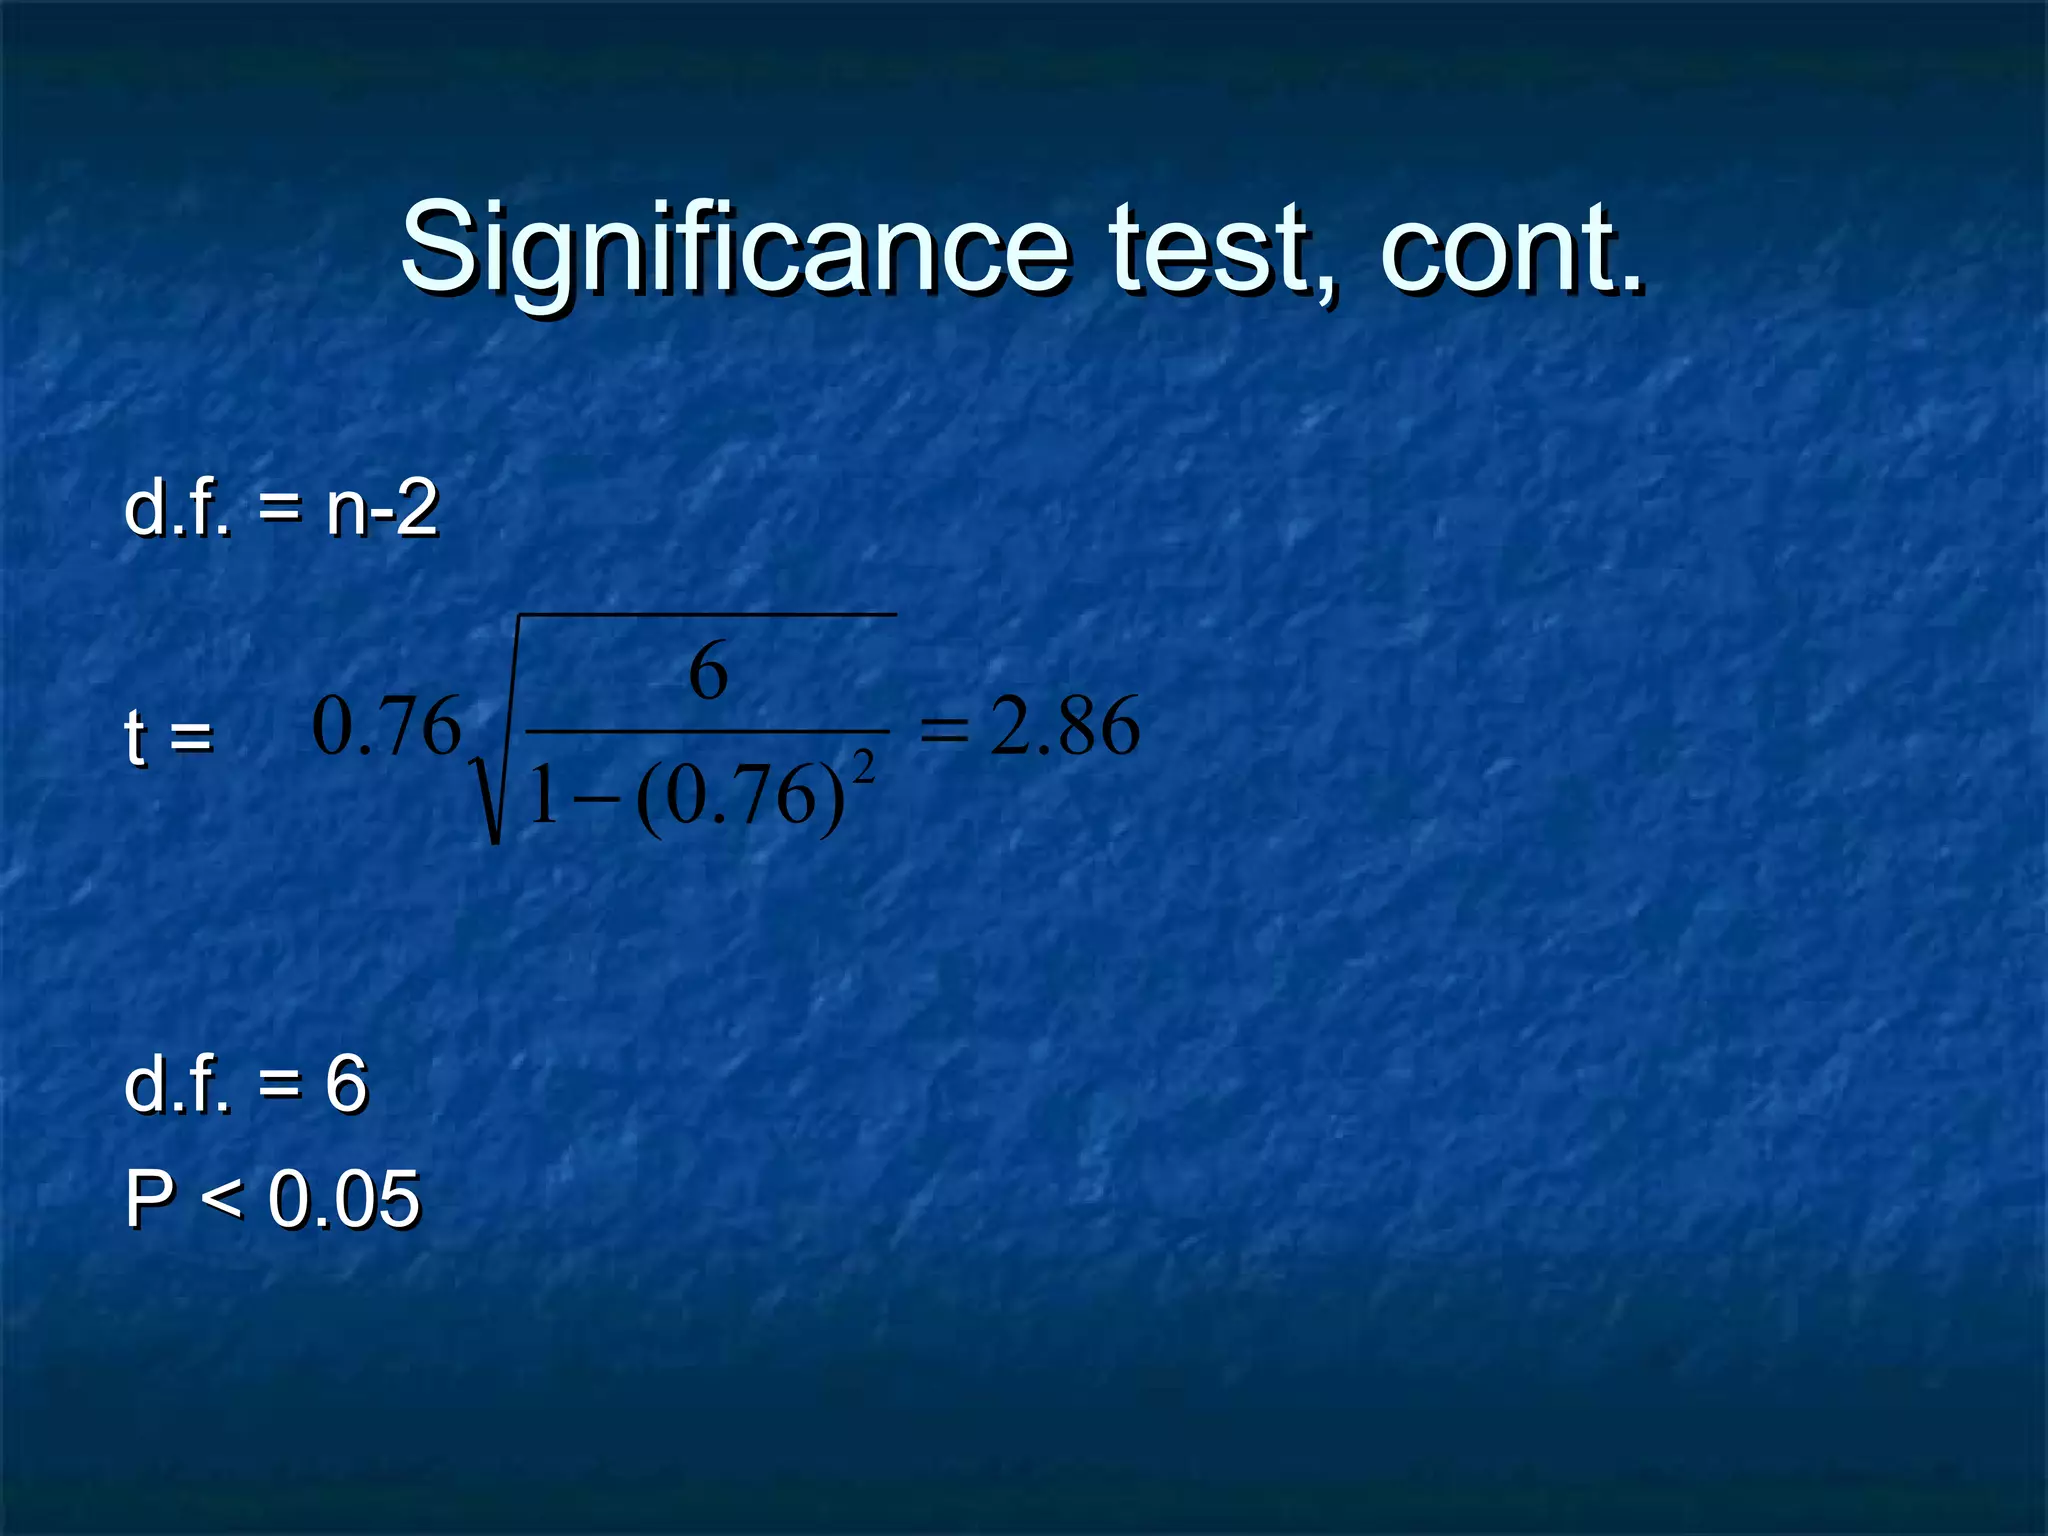
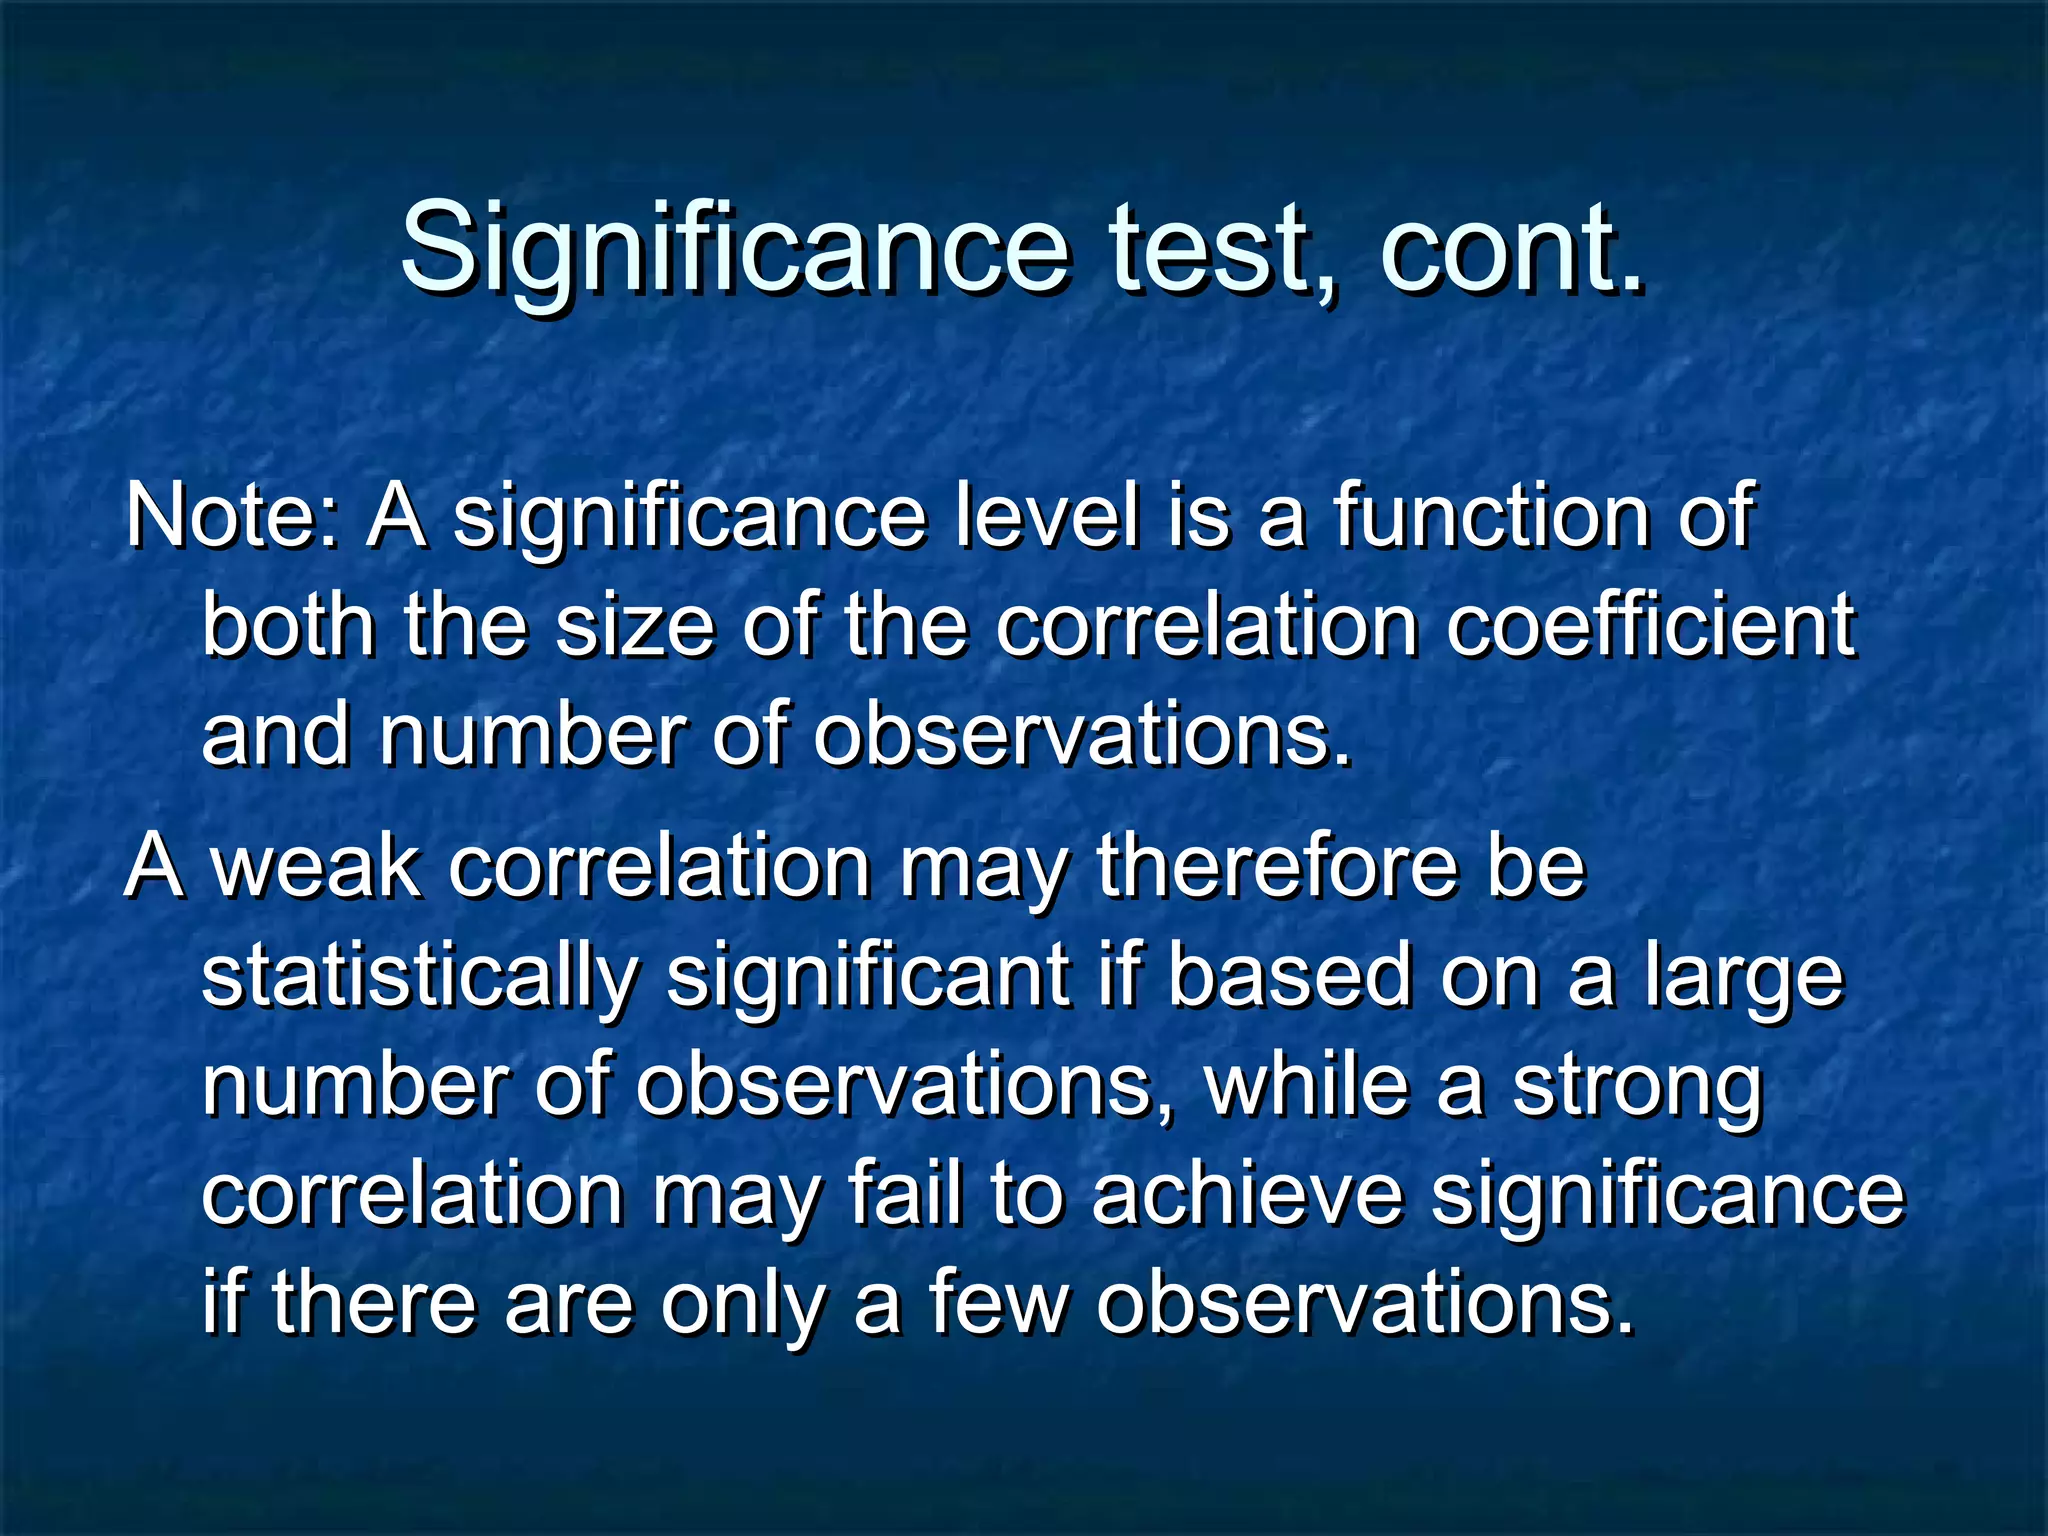
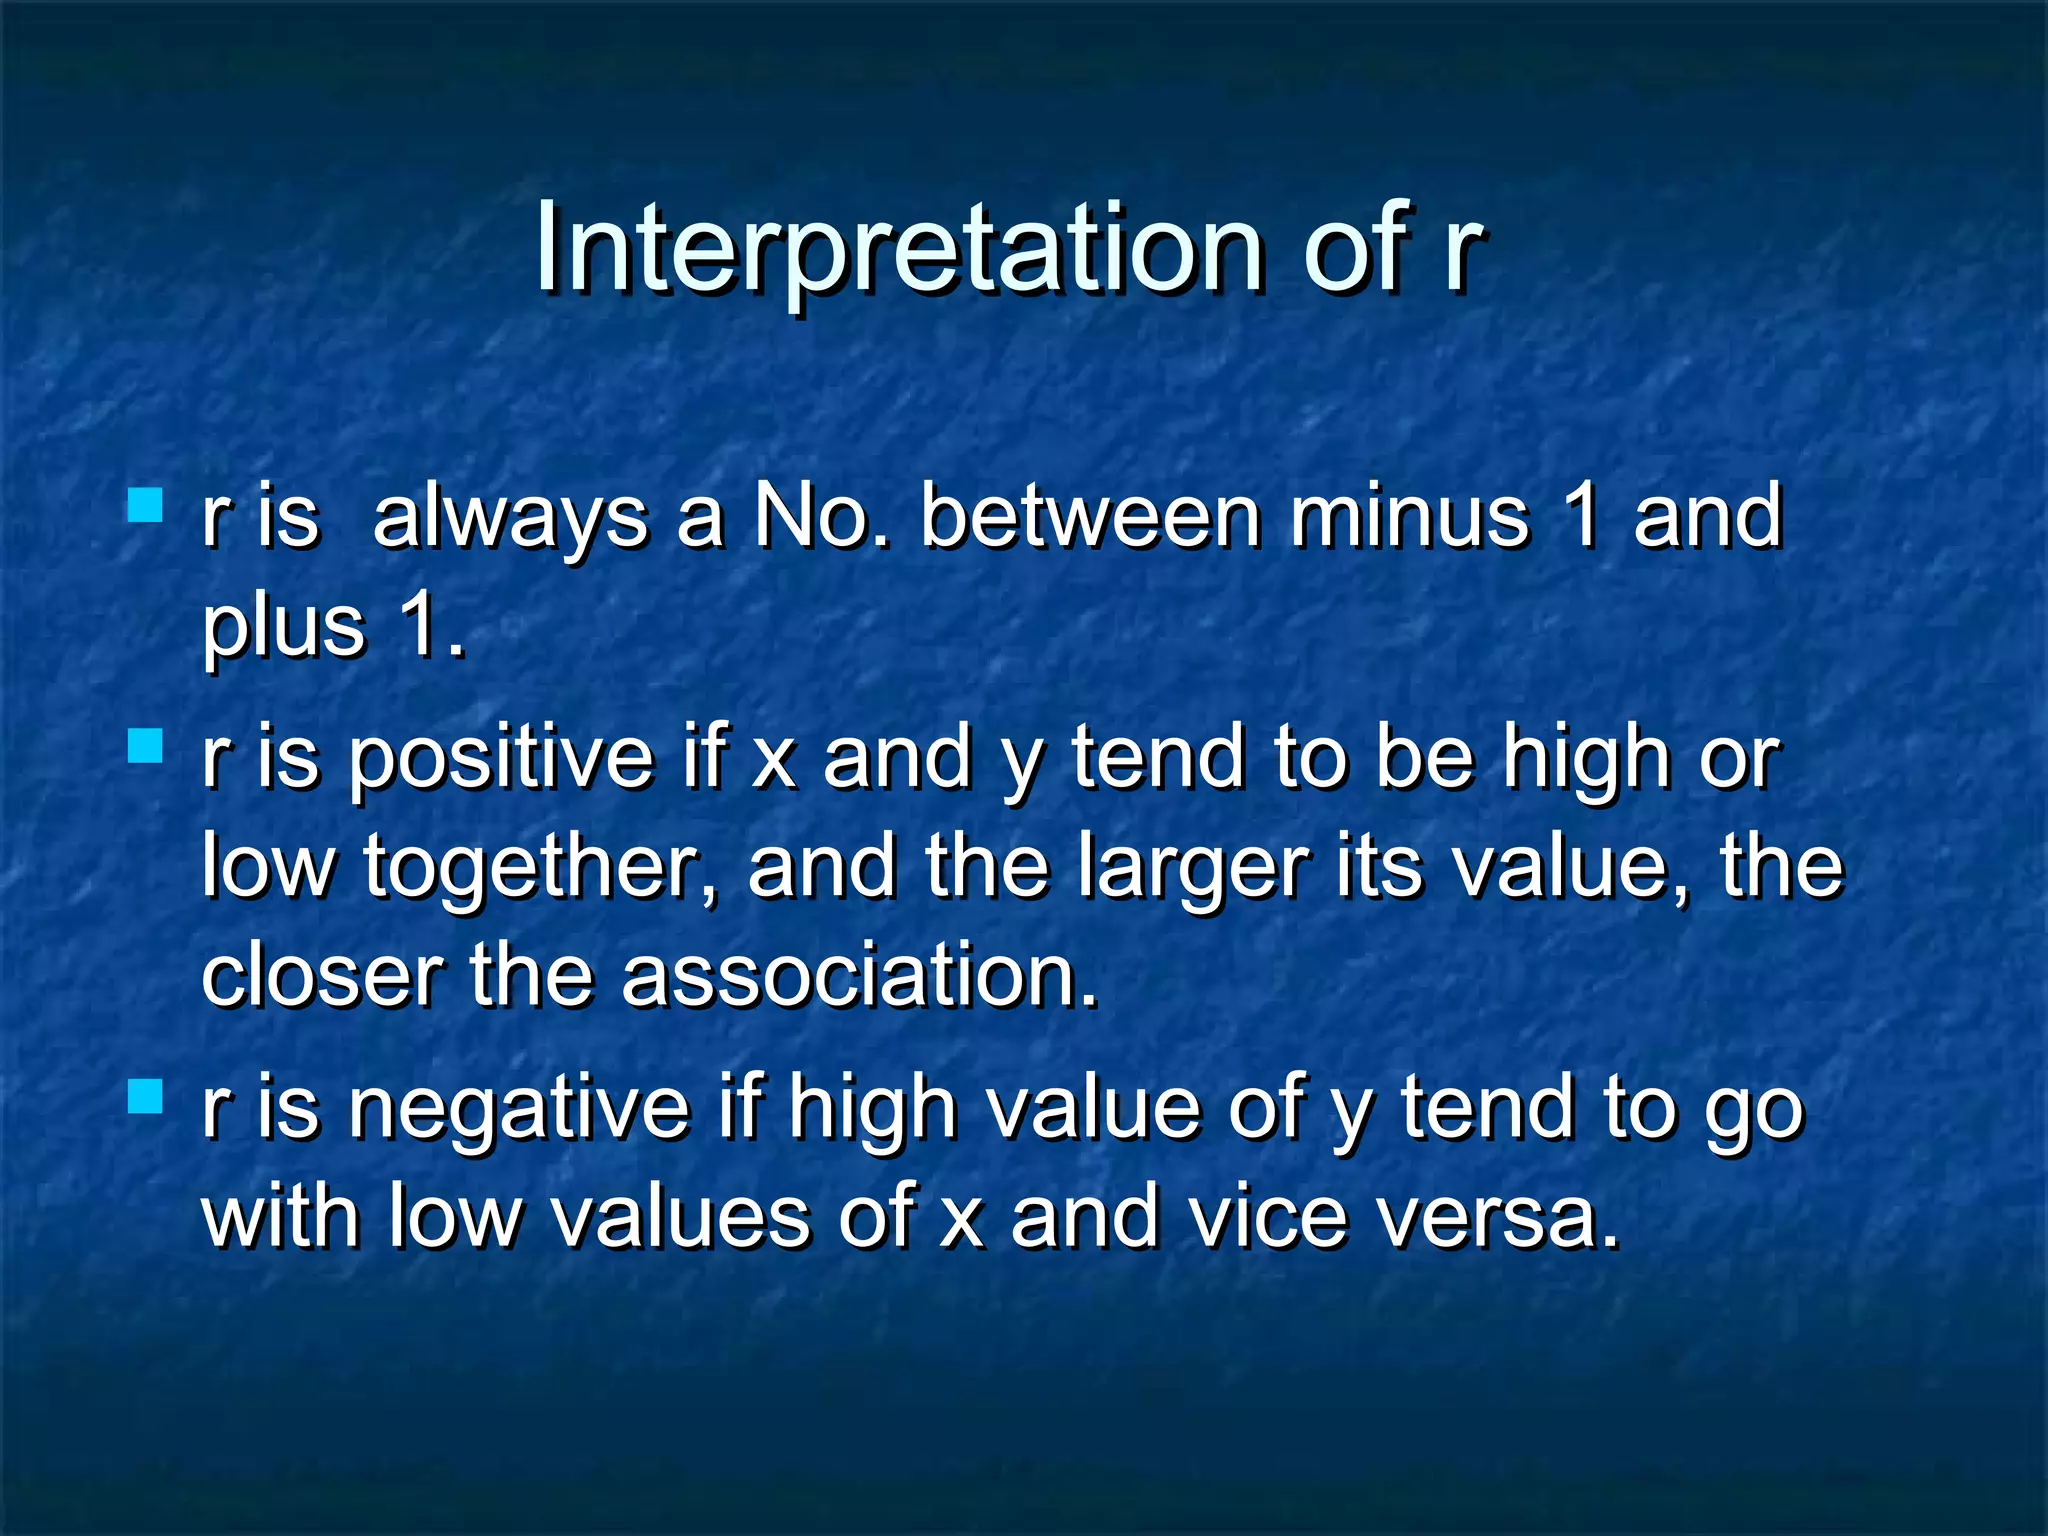
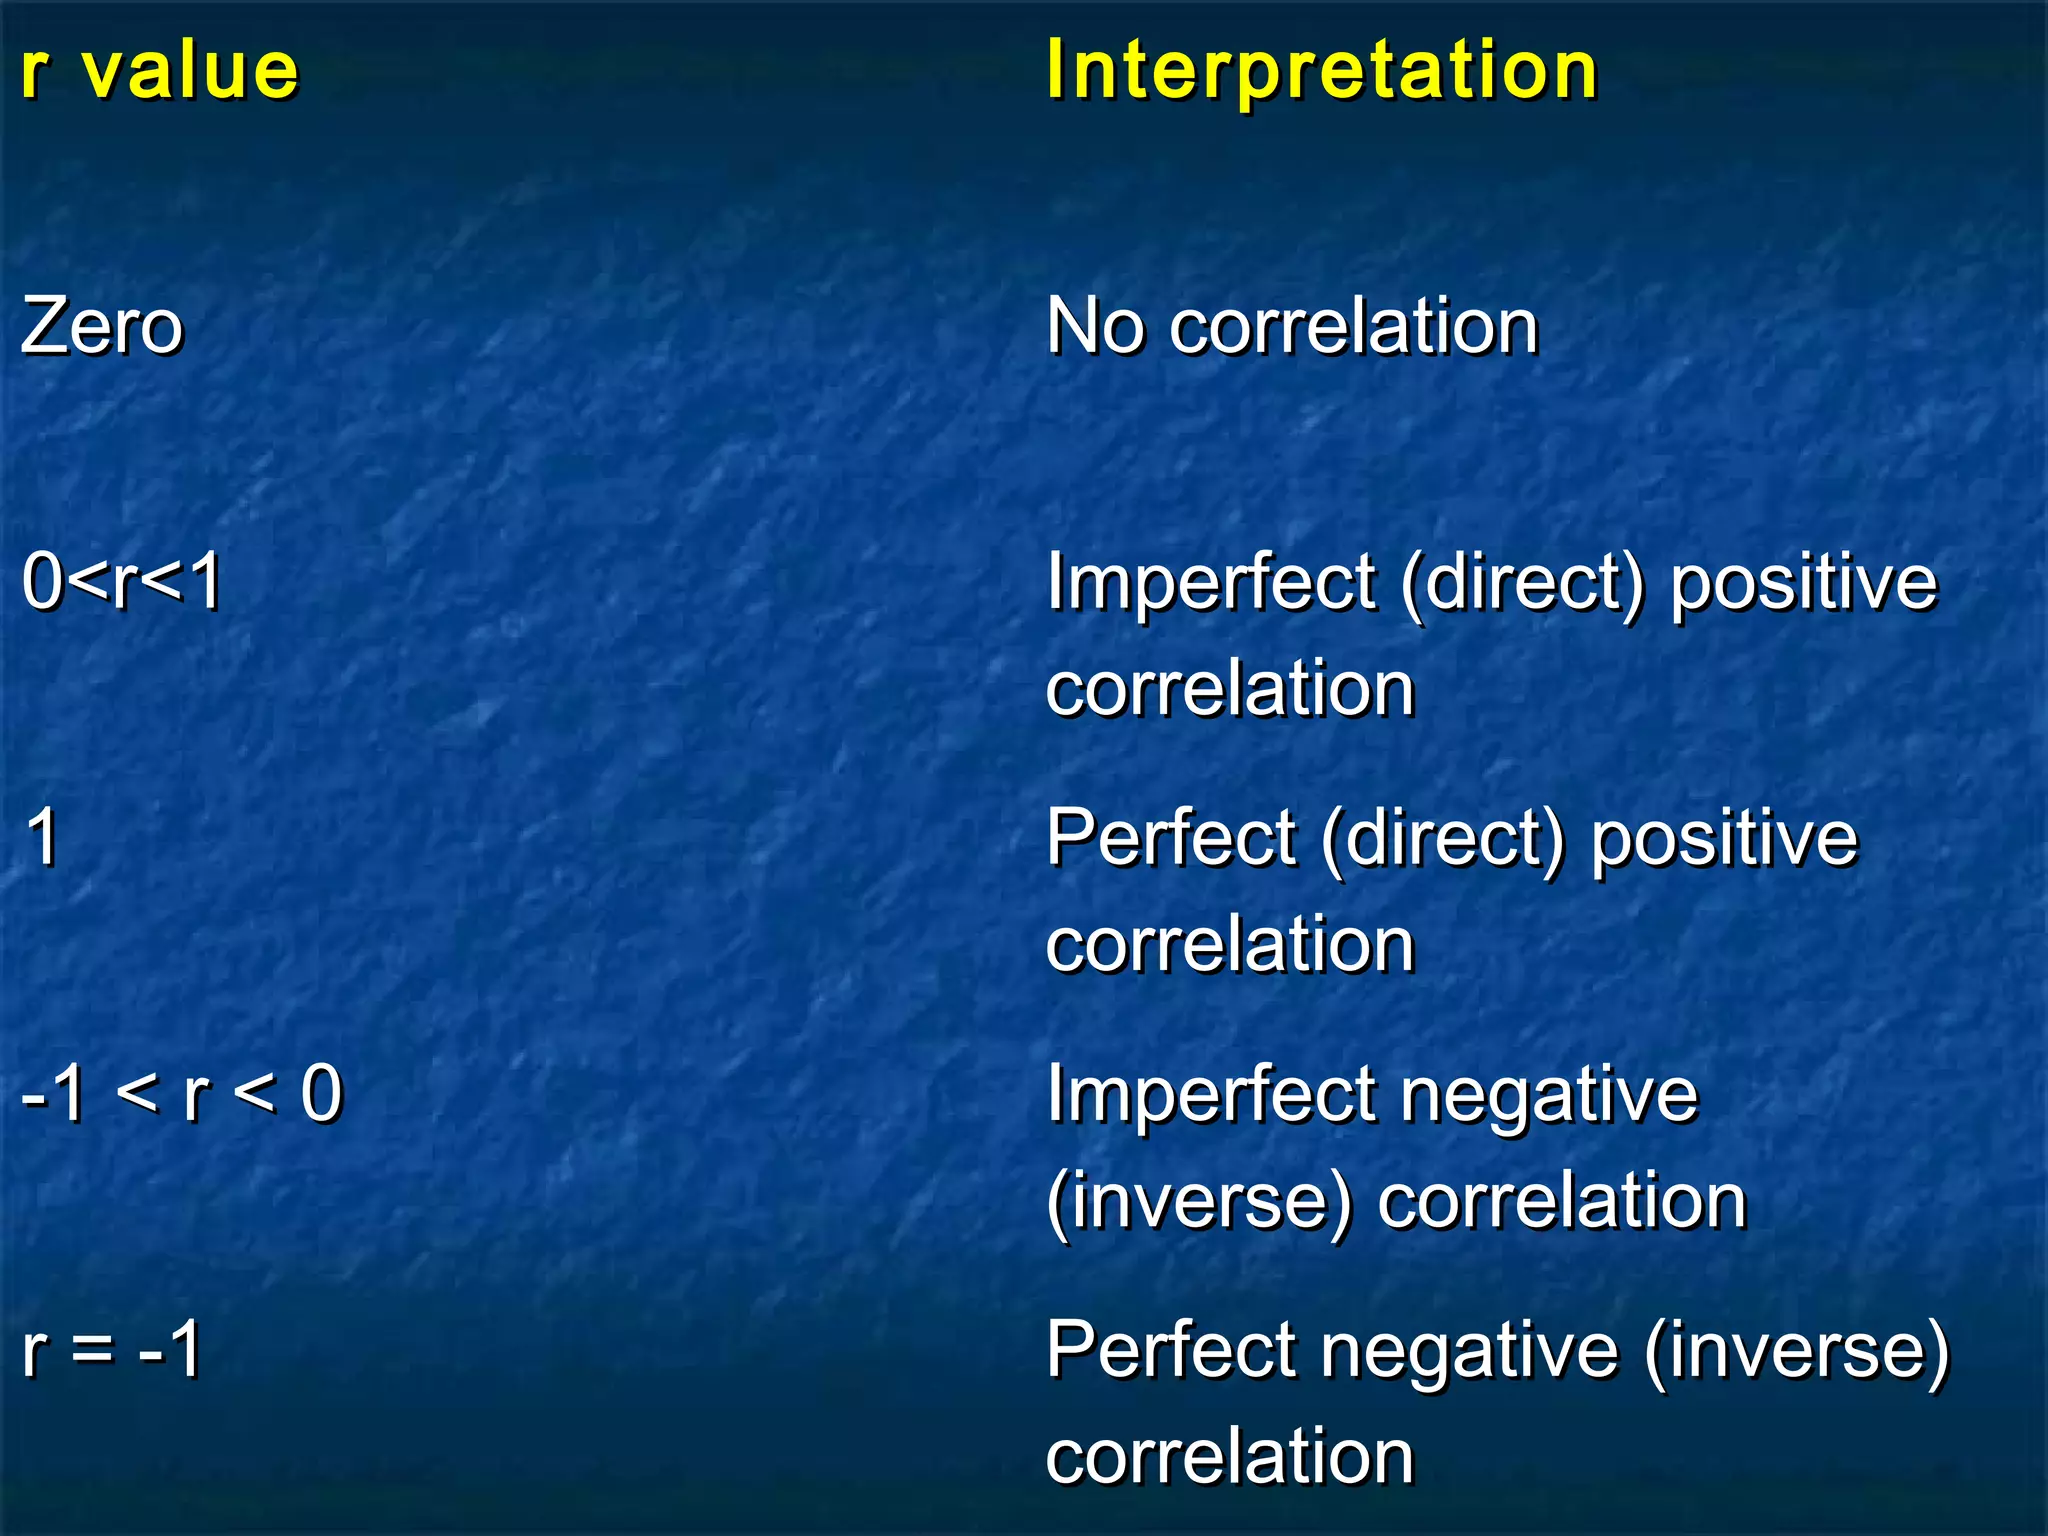
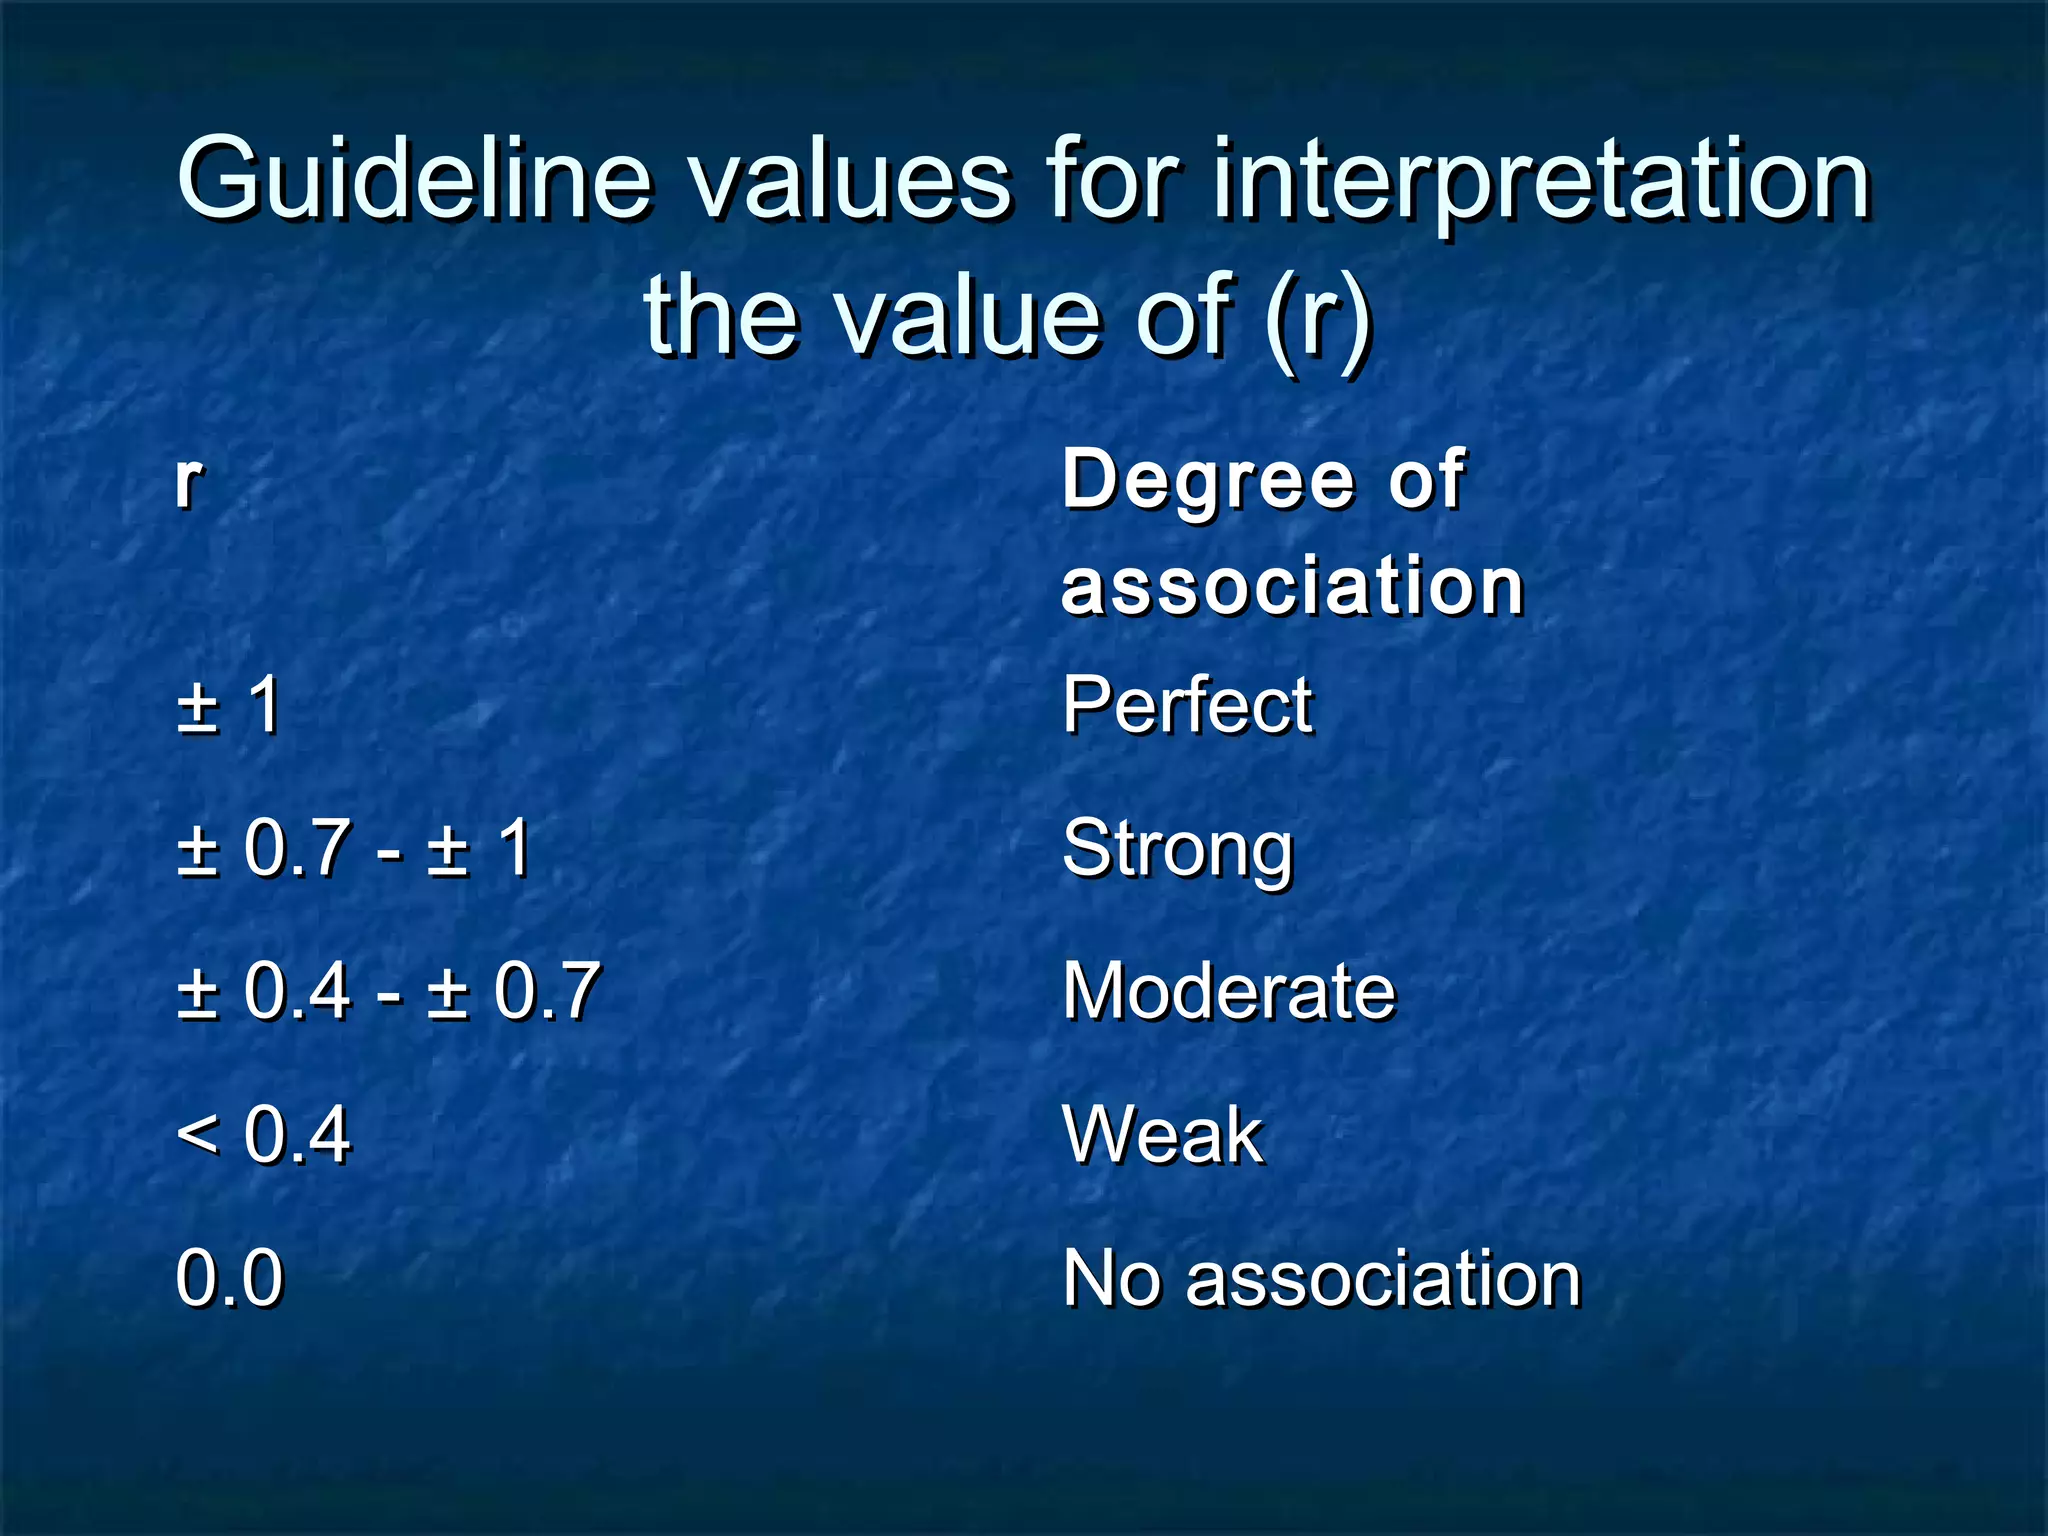


This document discusses correlation and the Pearson correlation coefficient (r). It investigates the linear association between body weight and plasma volume in 8 subjects. The correlation coefficient (r) between weight and plasma volume is calculated to be 0.76, indicating a strong positive correlation. A t-test shows this correlation is statistically significant. Values of r range from -1 to 1, where higher positive or negative values indicate stronger linear relationships.


![Prac excises 3[1].5](https://cdn.slidesharecdn.com/ss_thumbnails/pracexcises31-150331131154-conversion-gate01-thumbnail.jpg?width=640&height=640&fit=bounds)


