Download to read offline

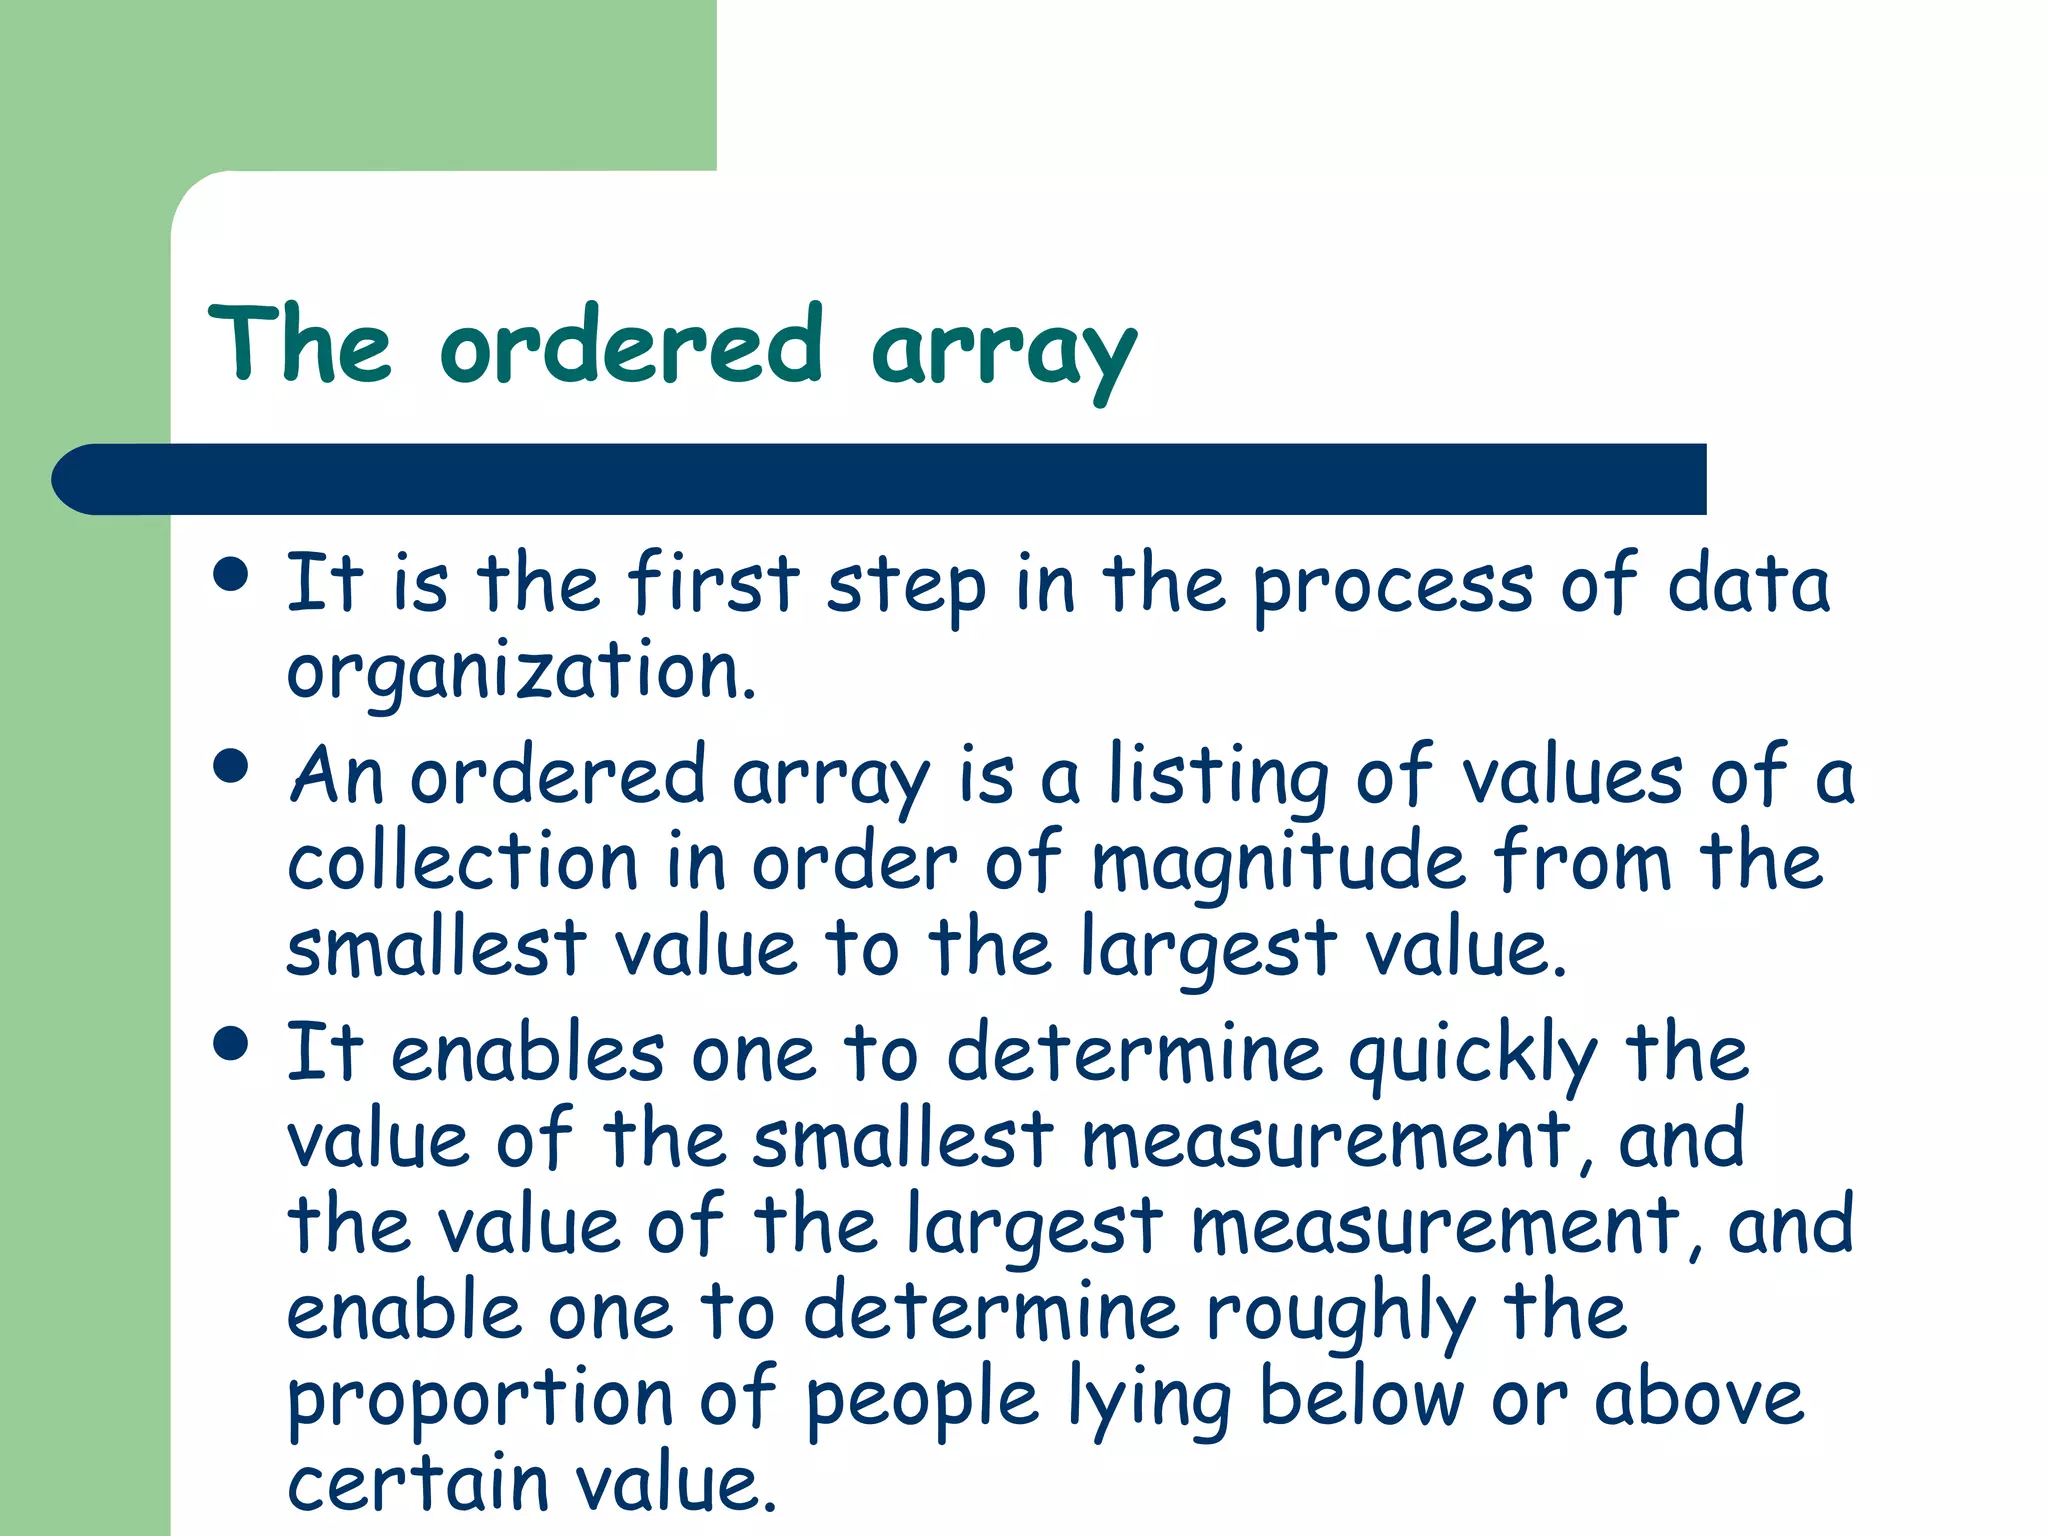
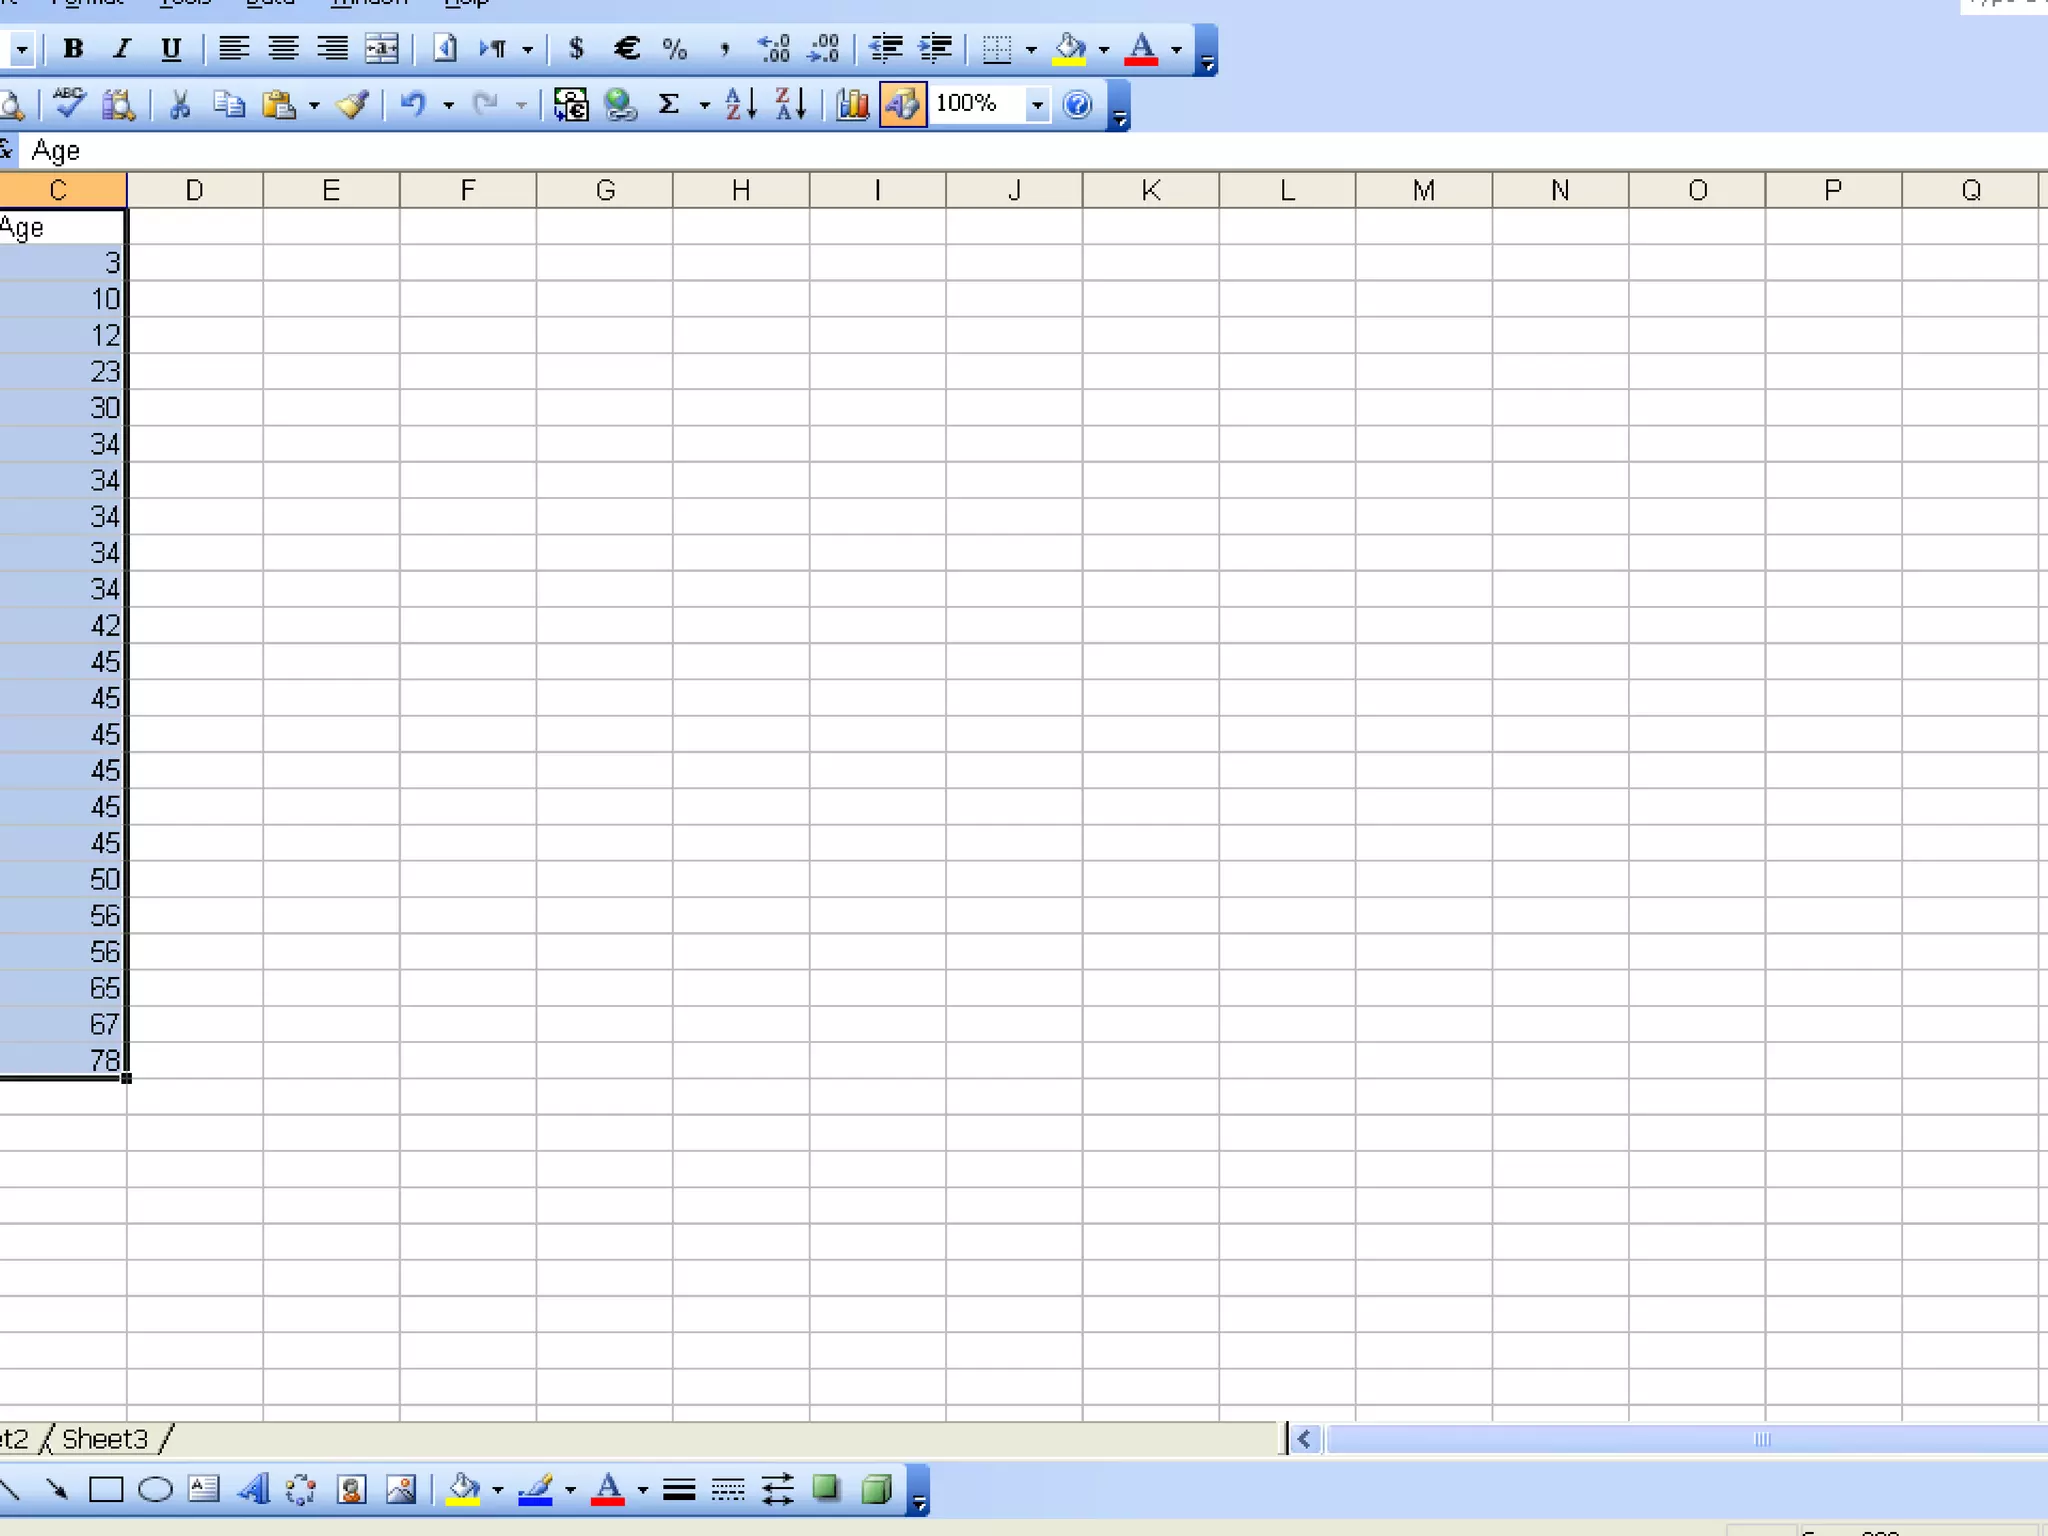
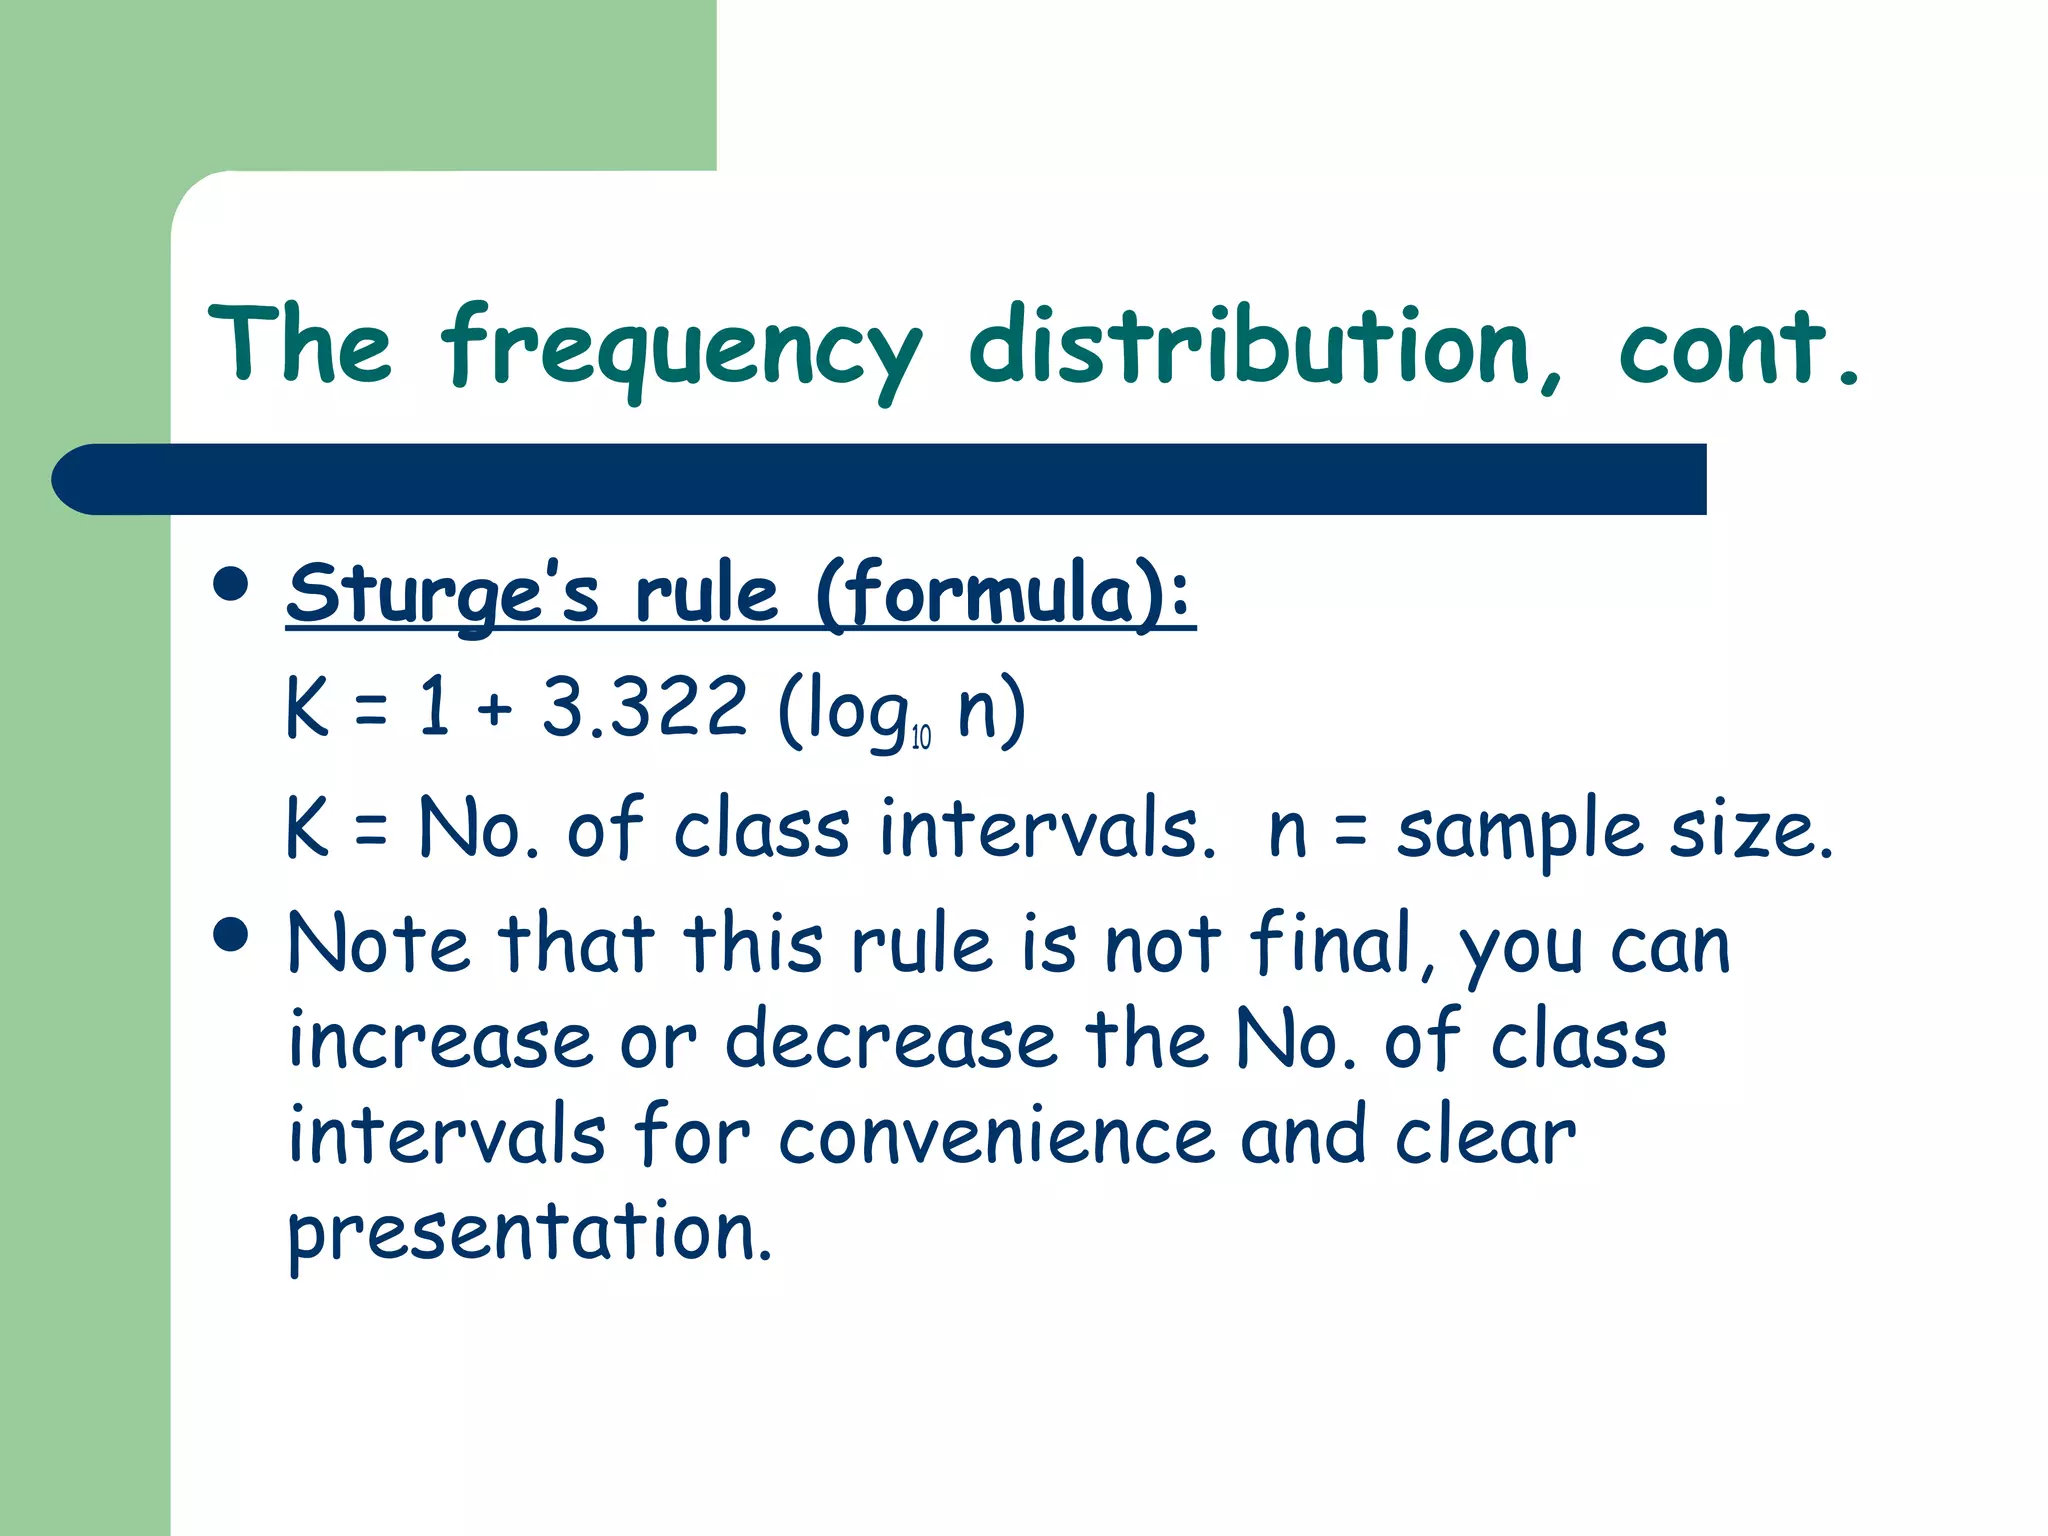
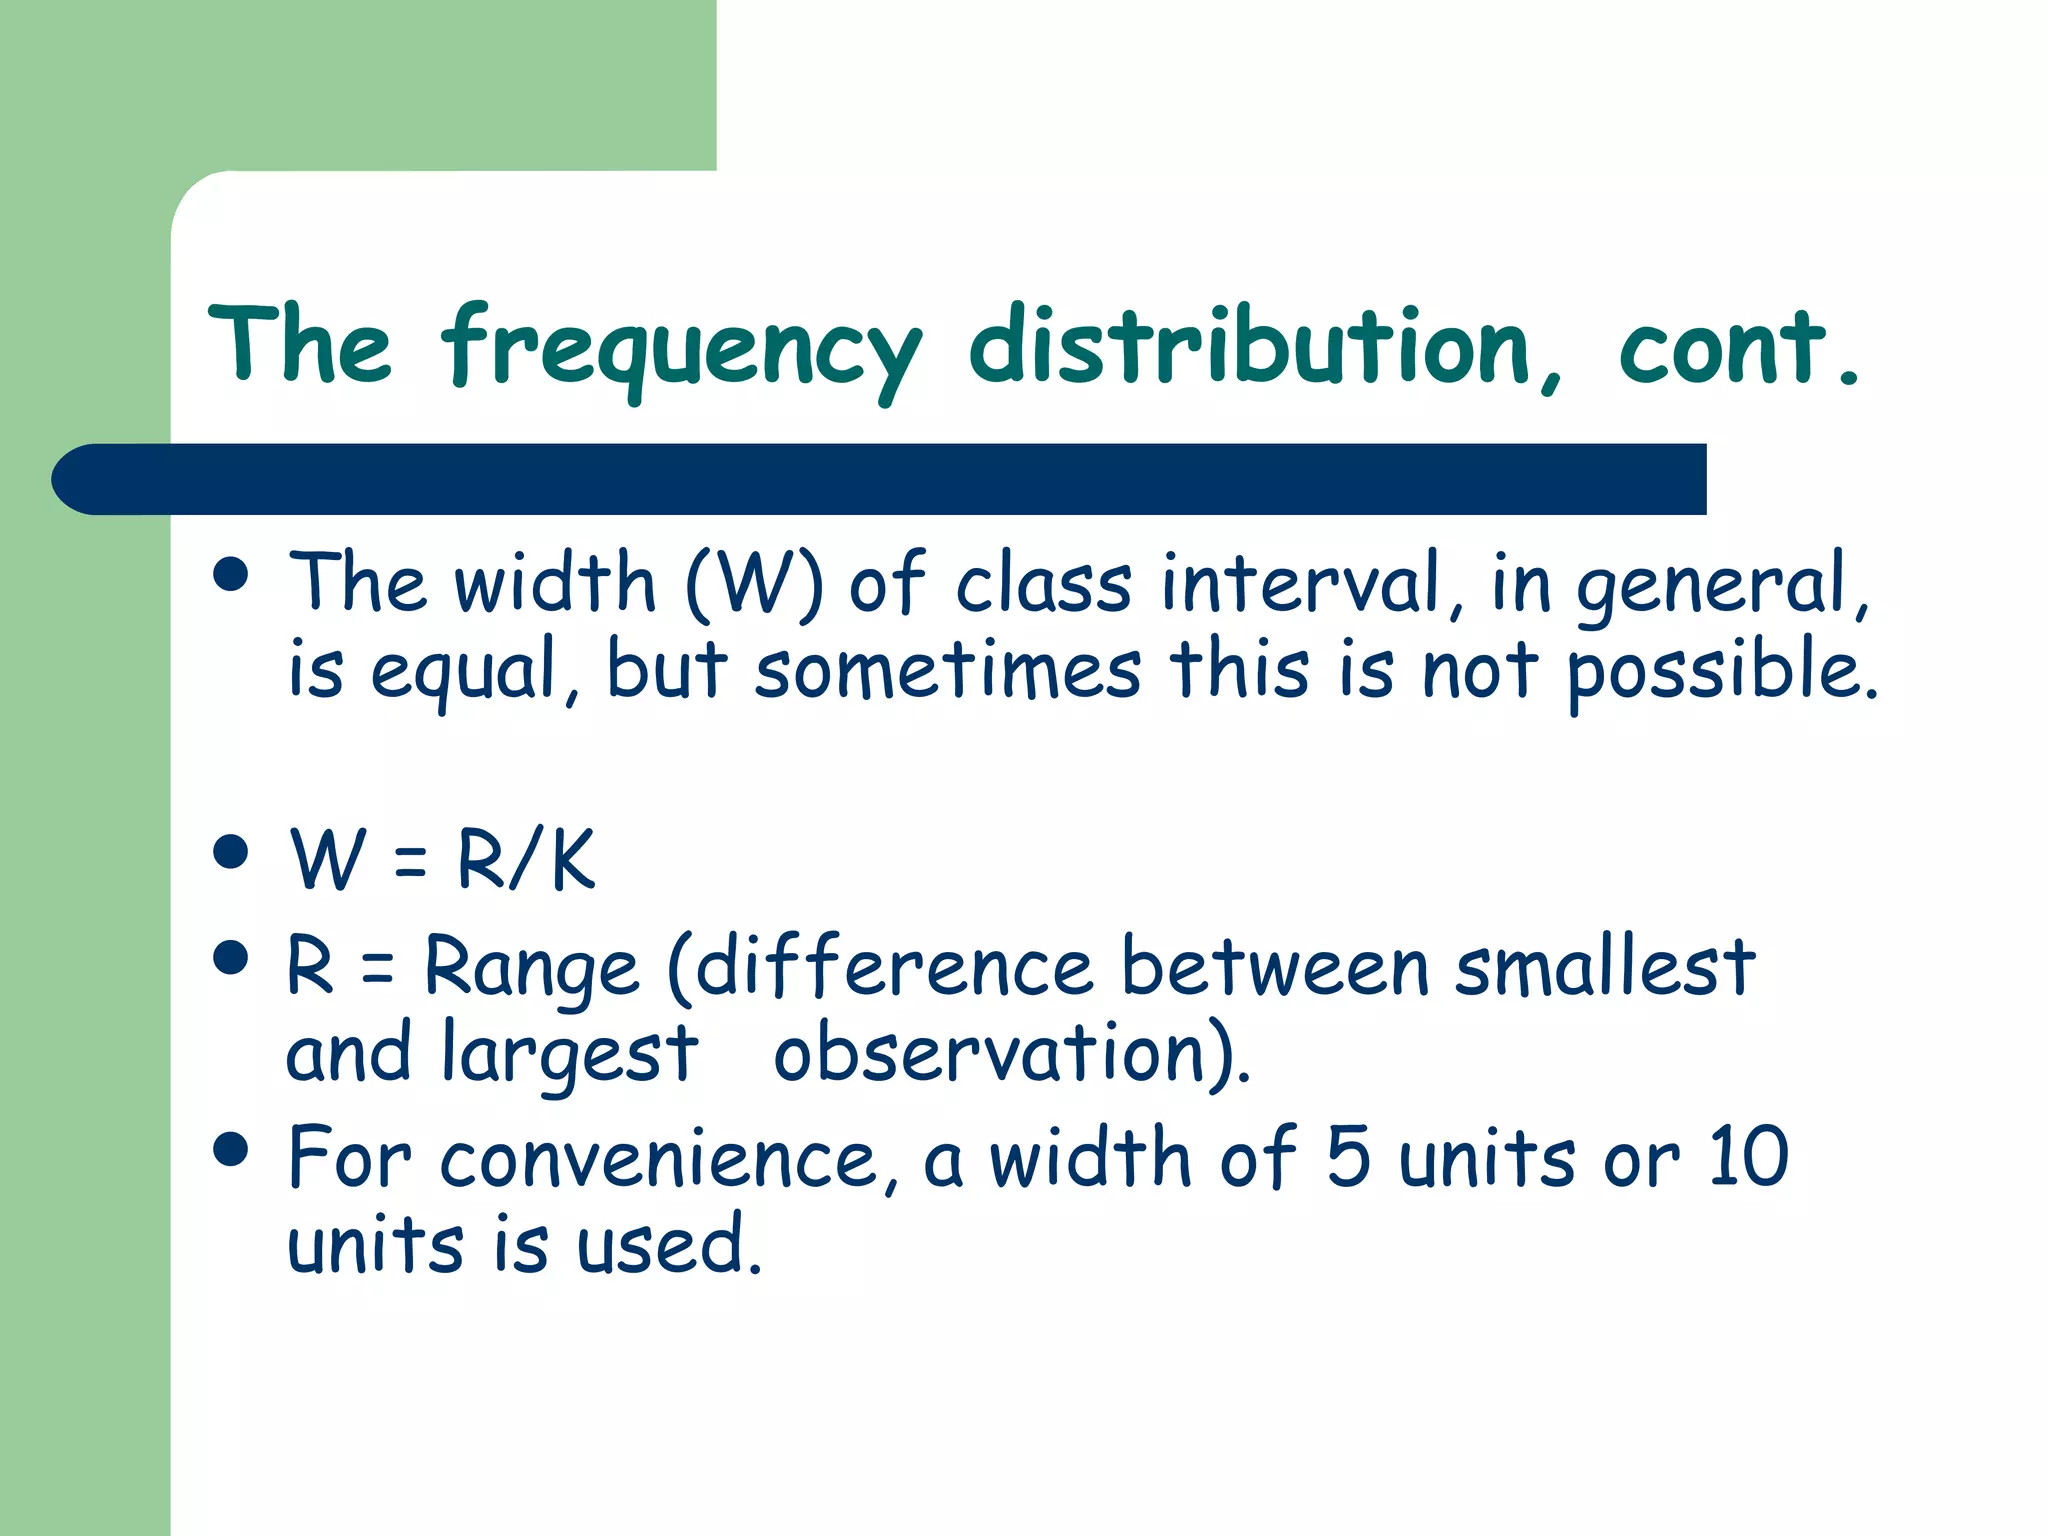
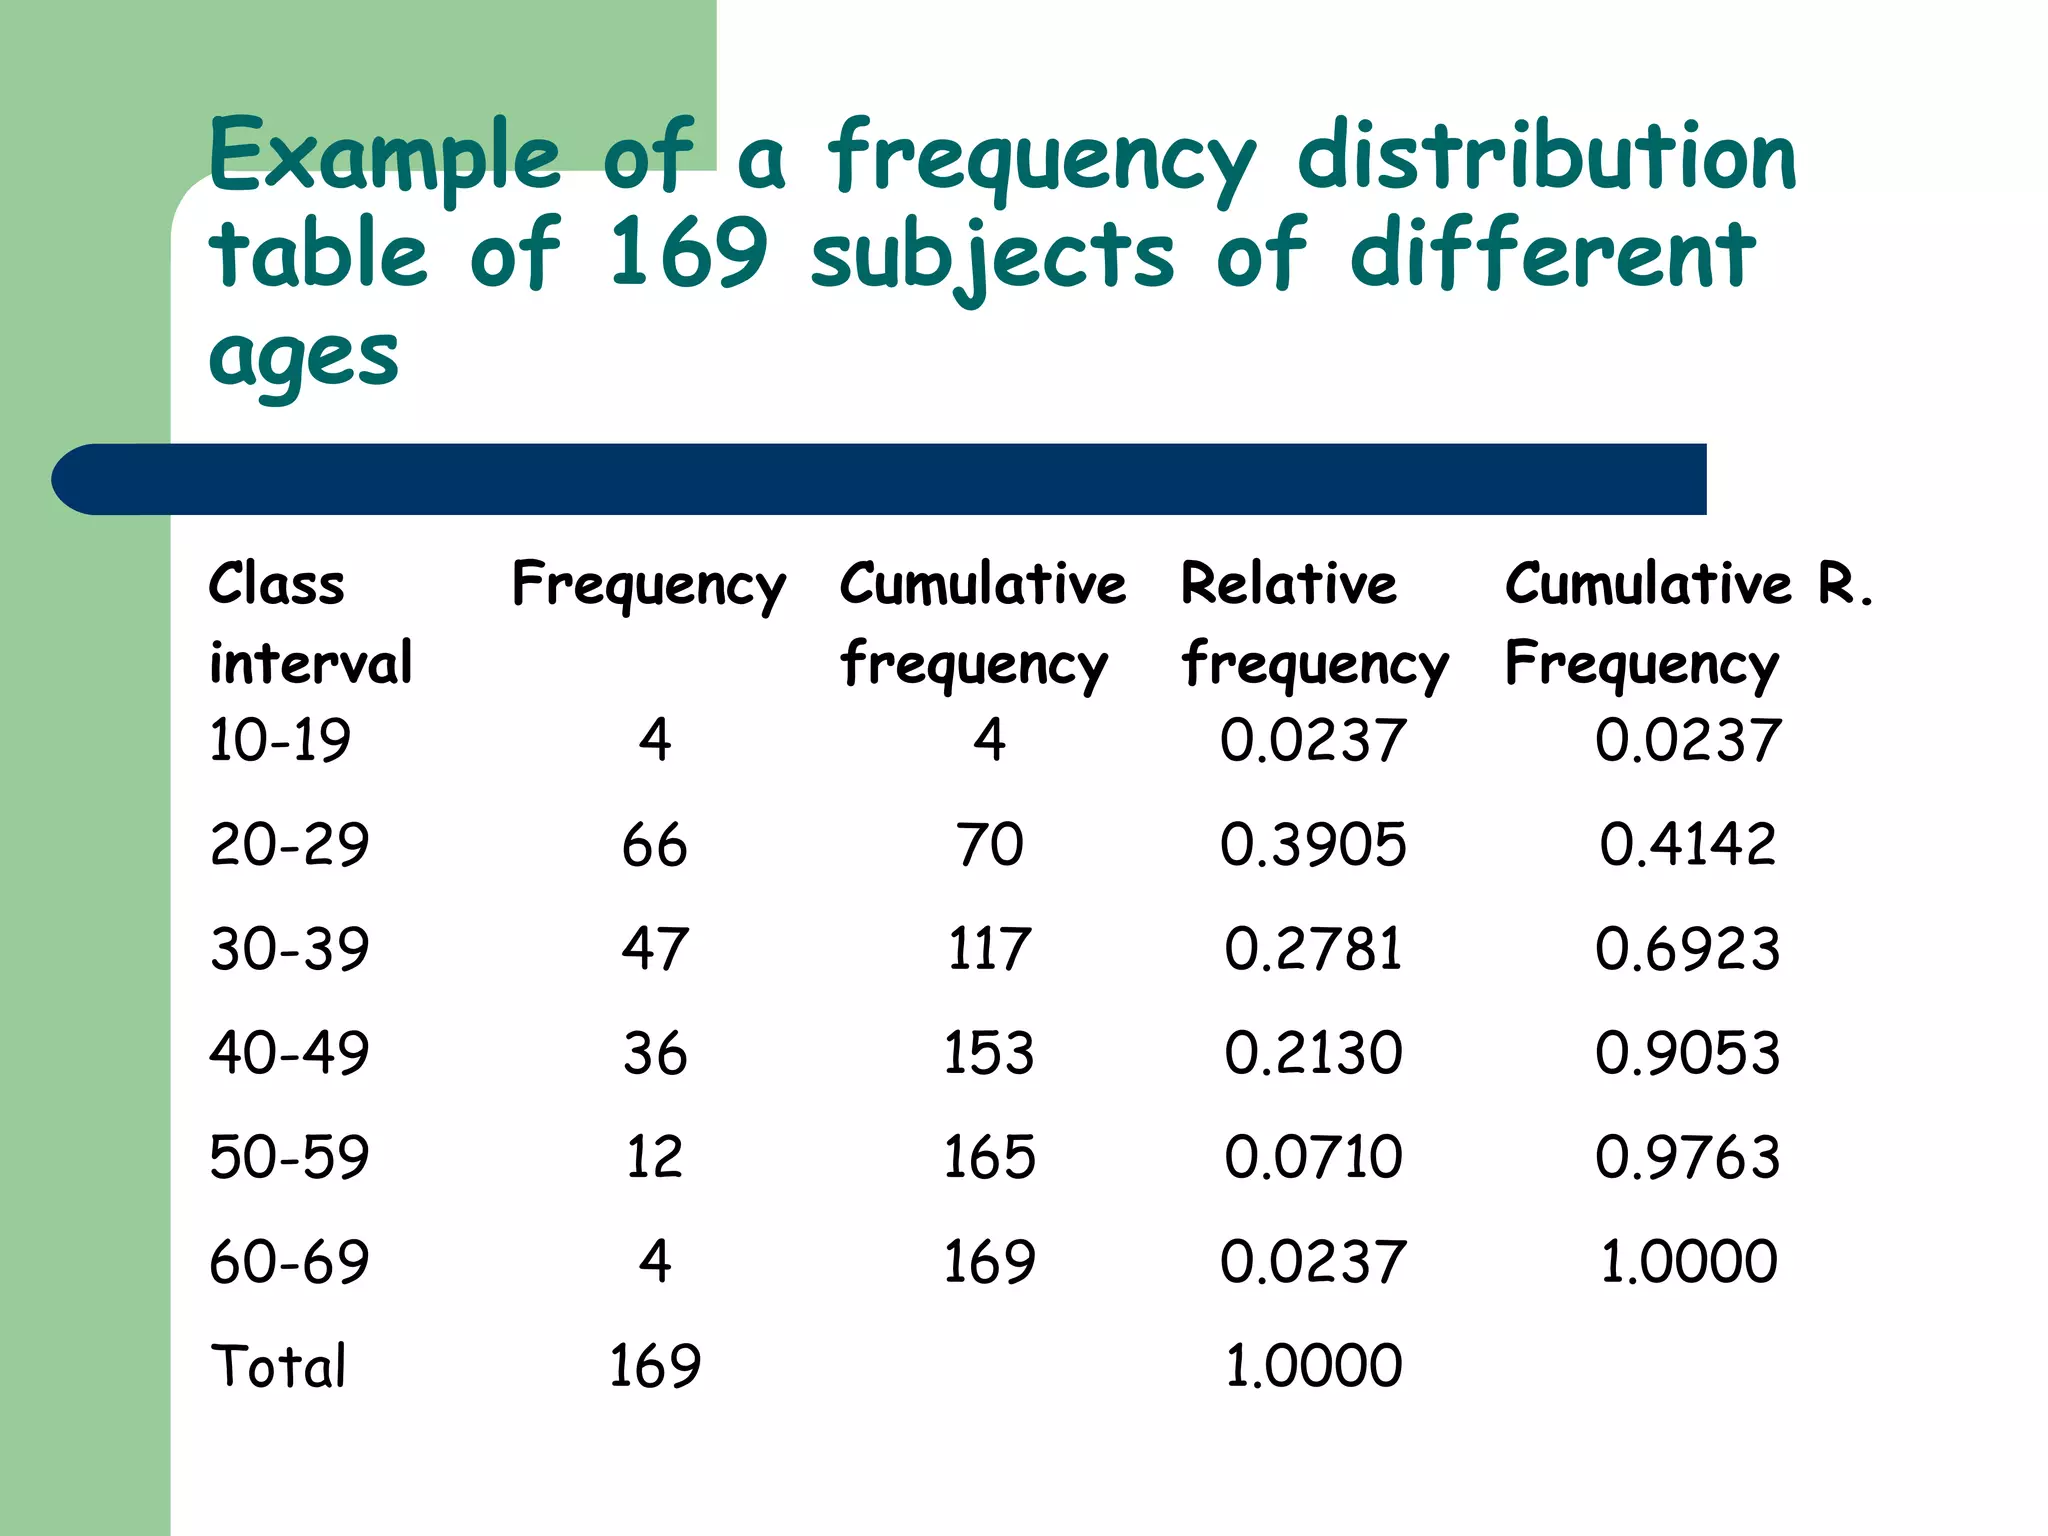
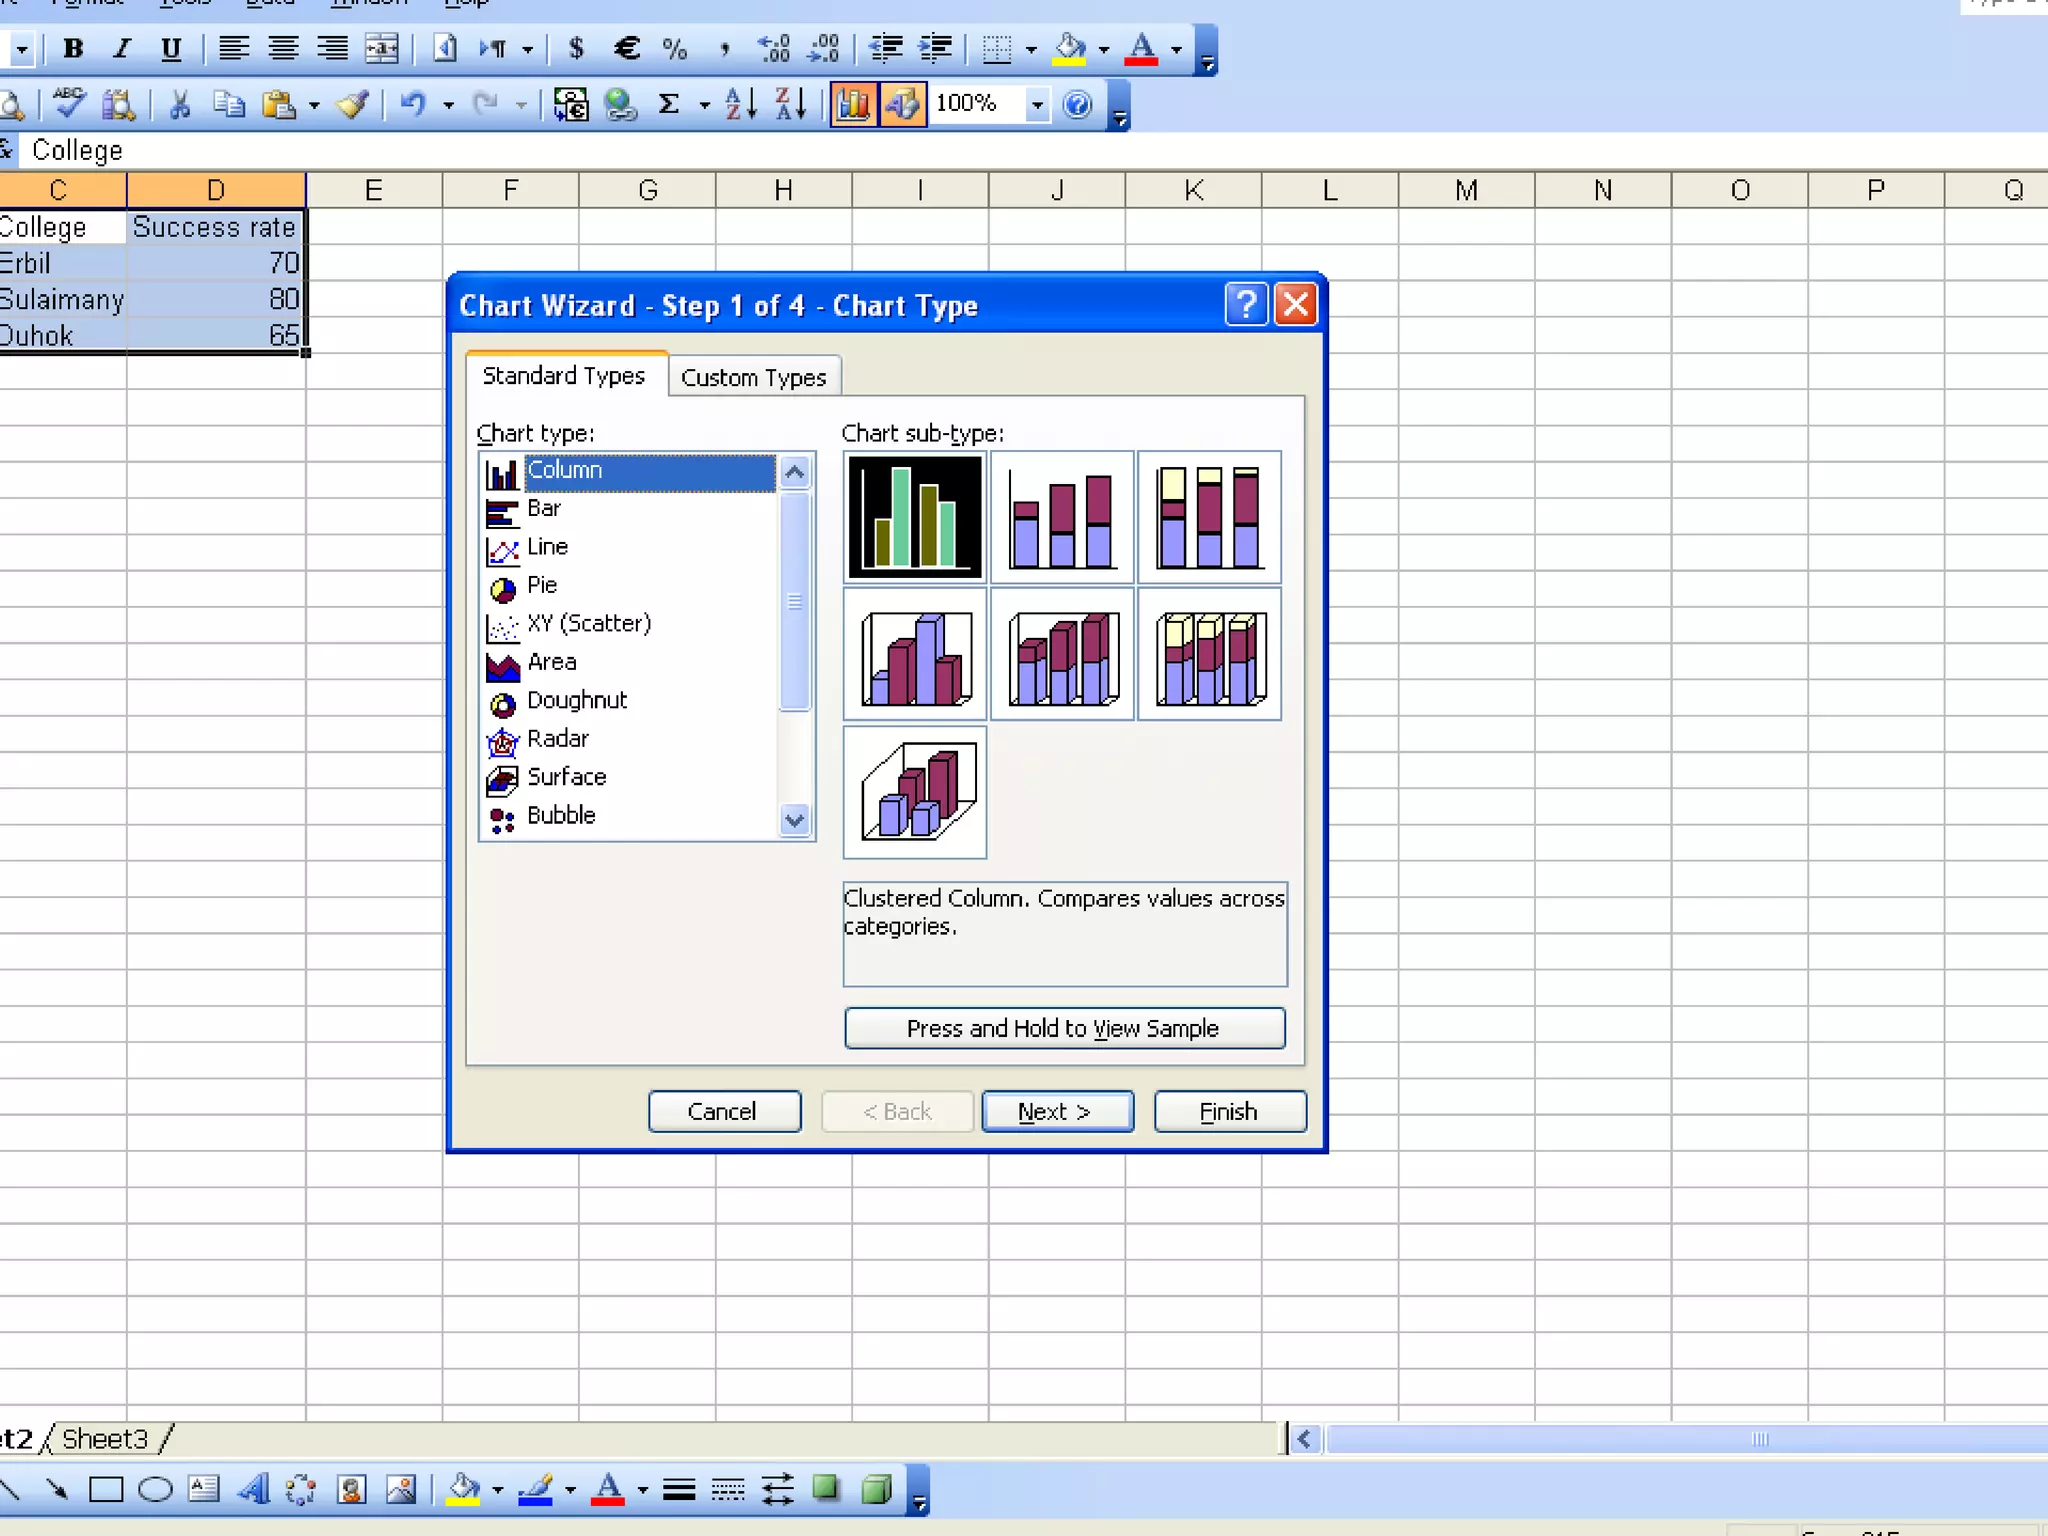
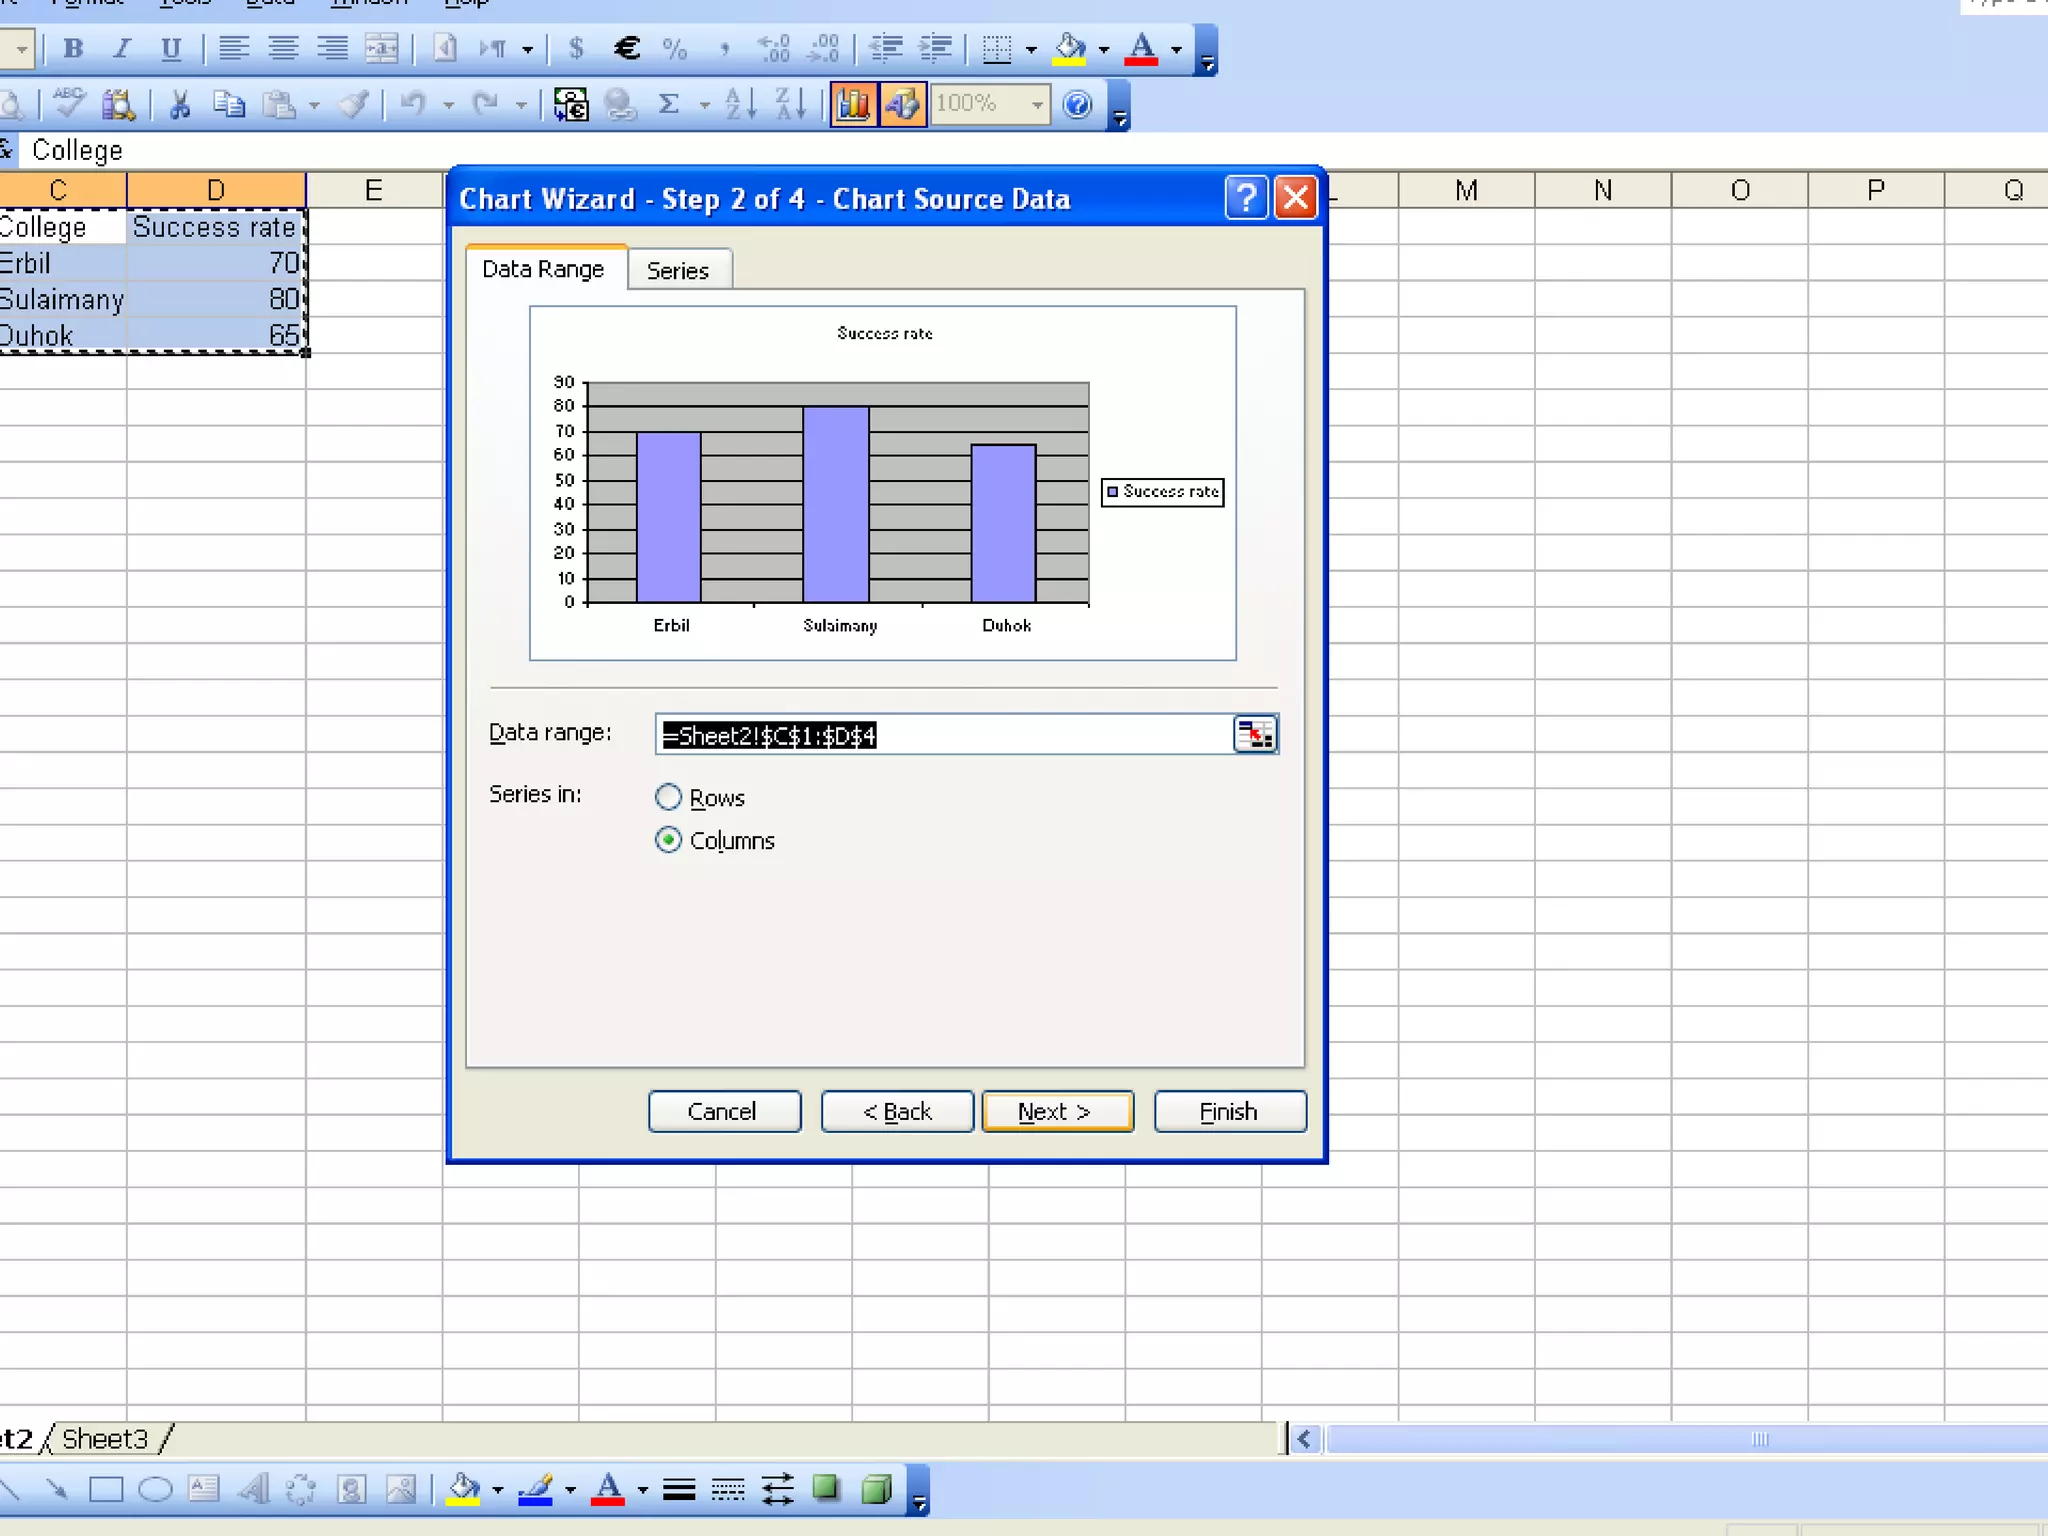
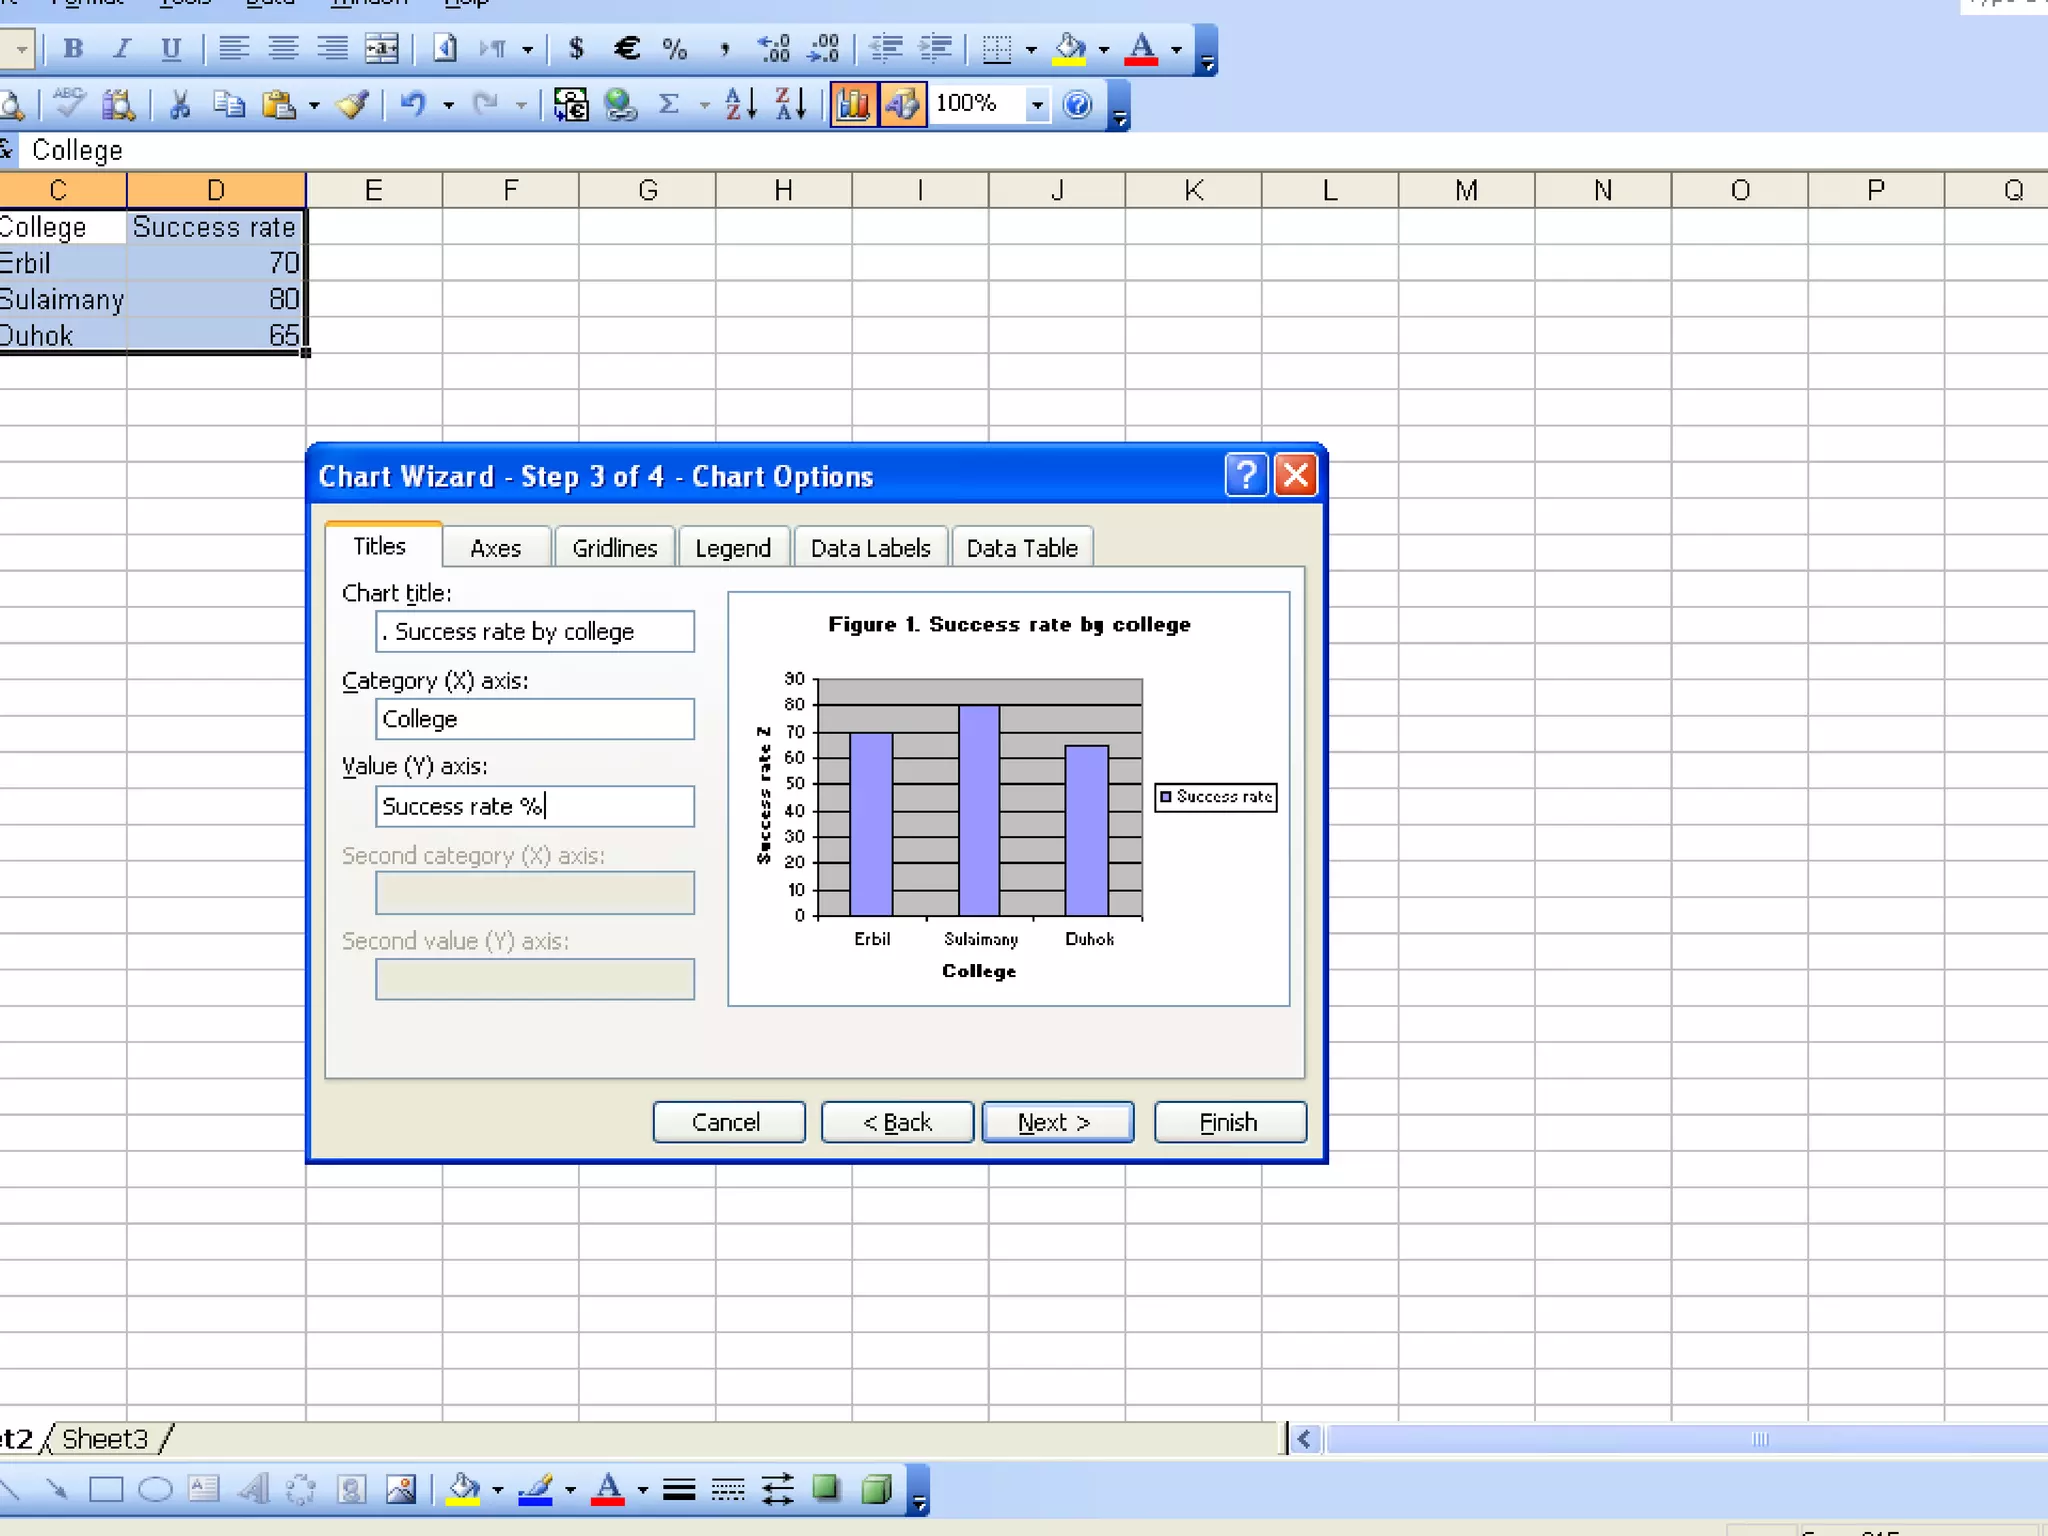
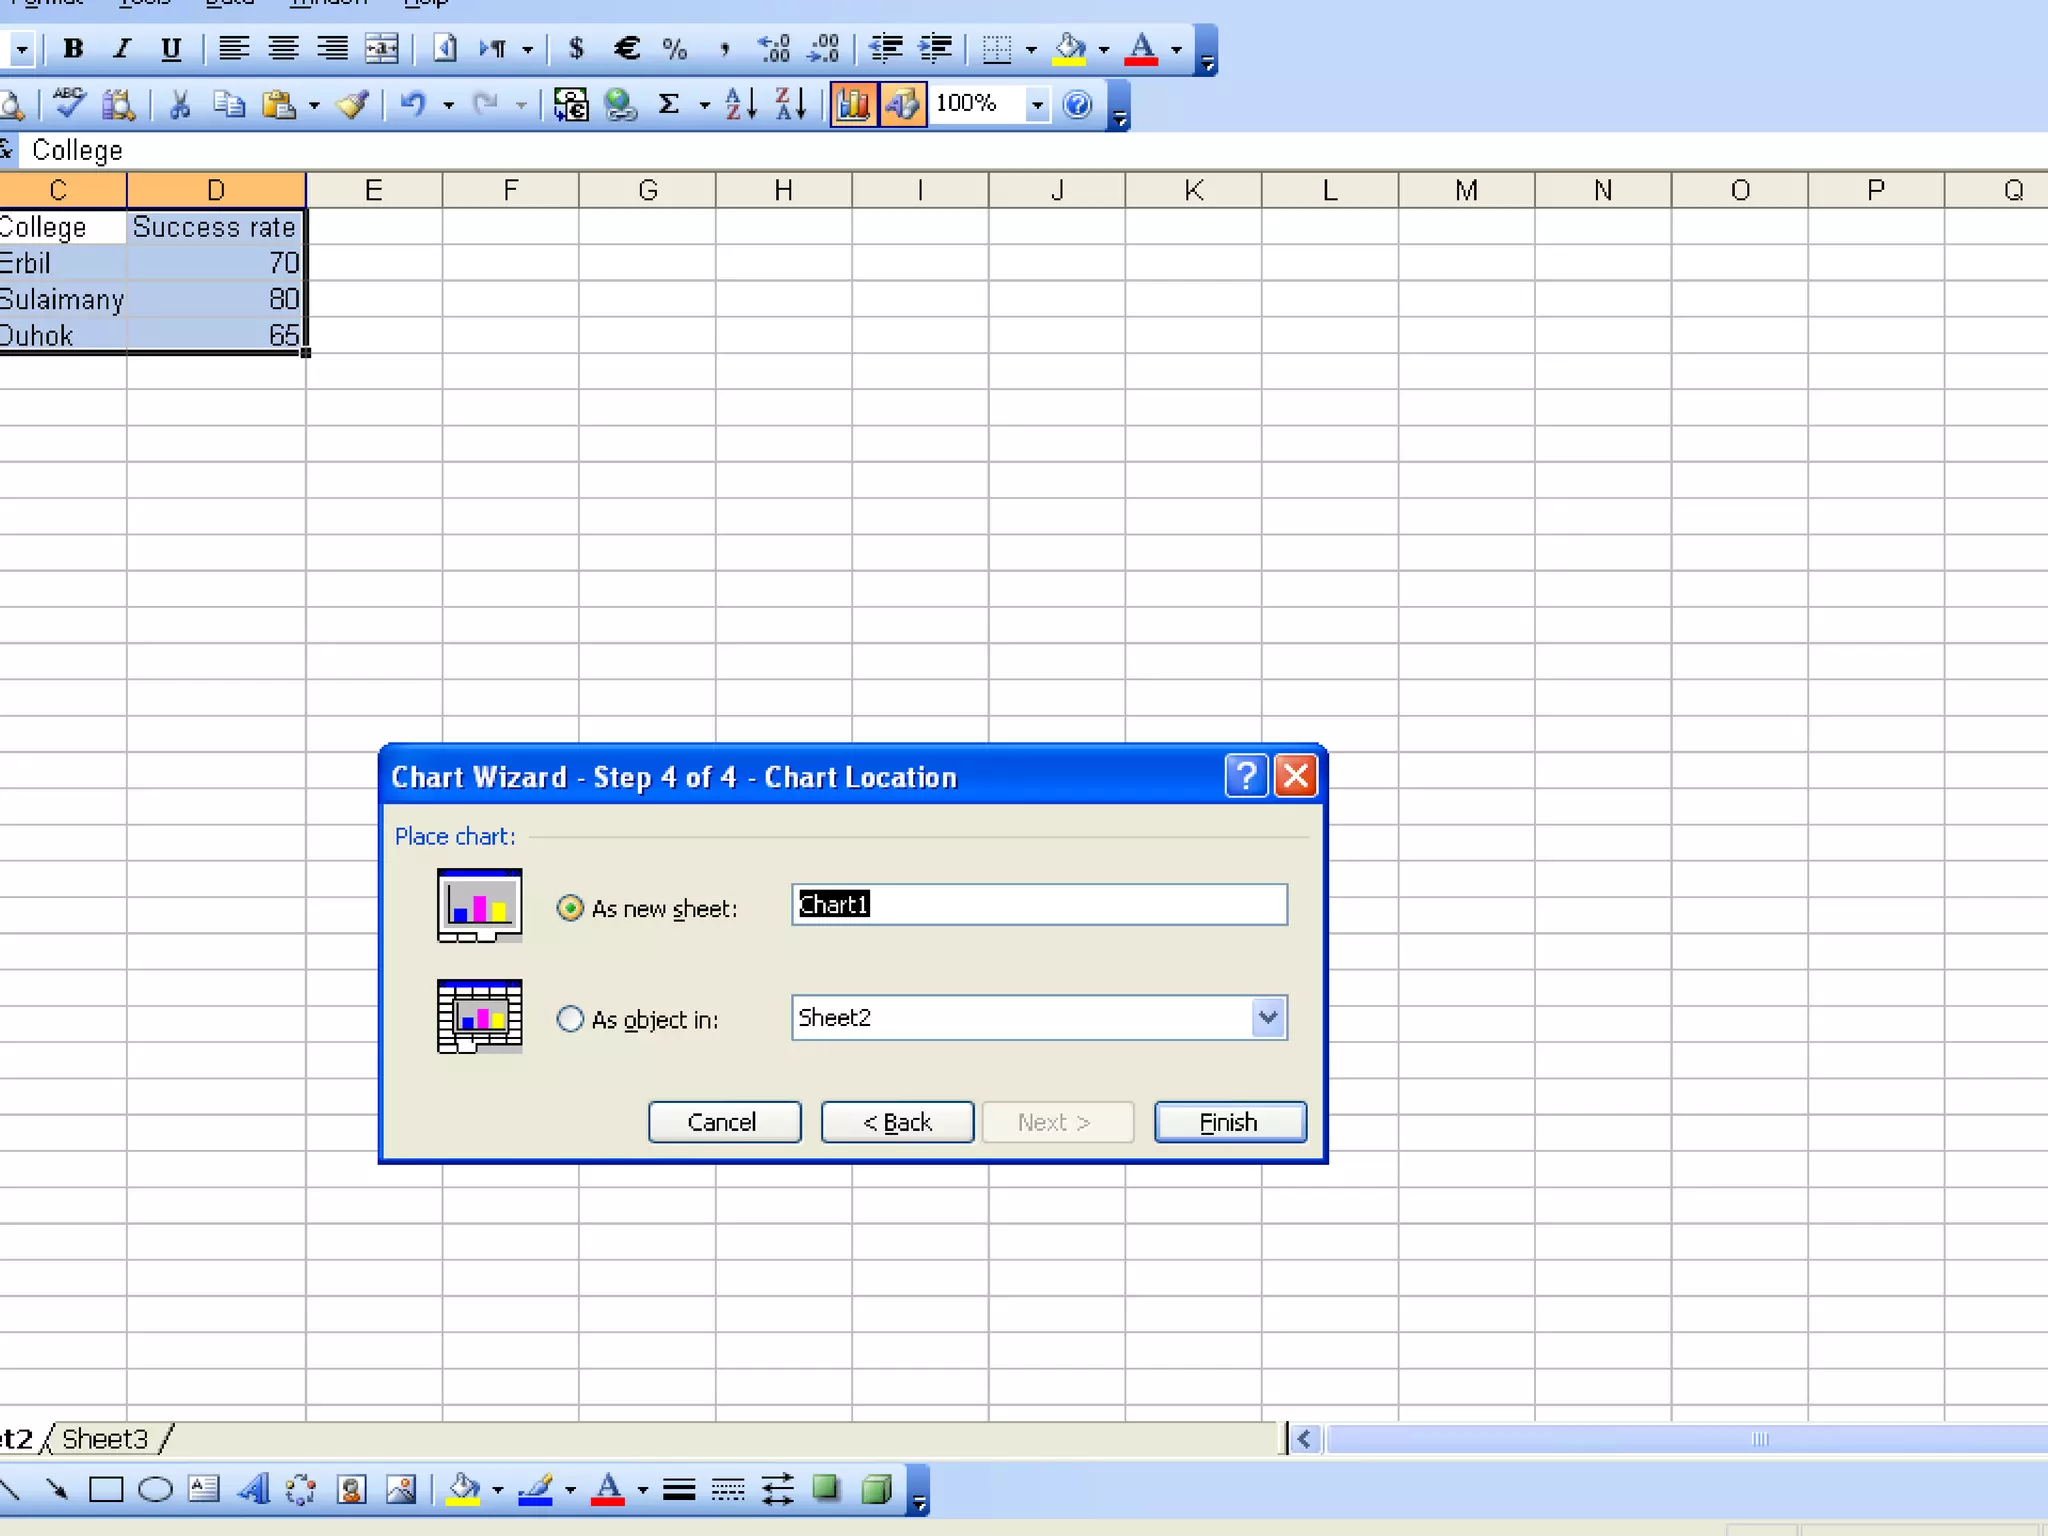
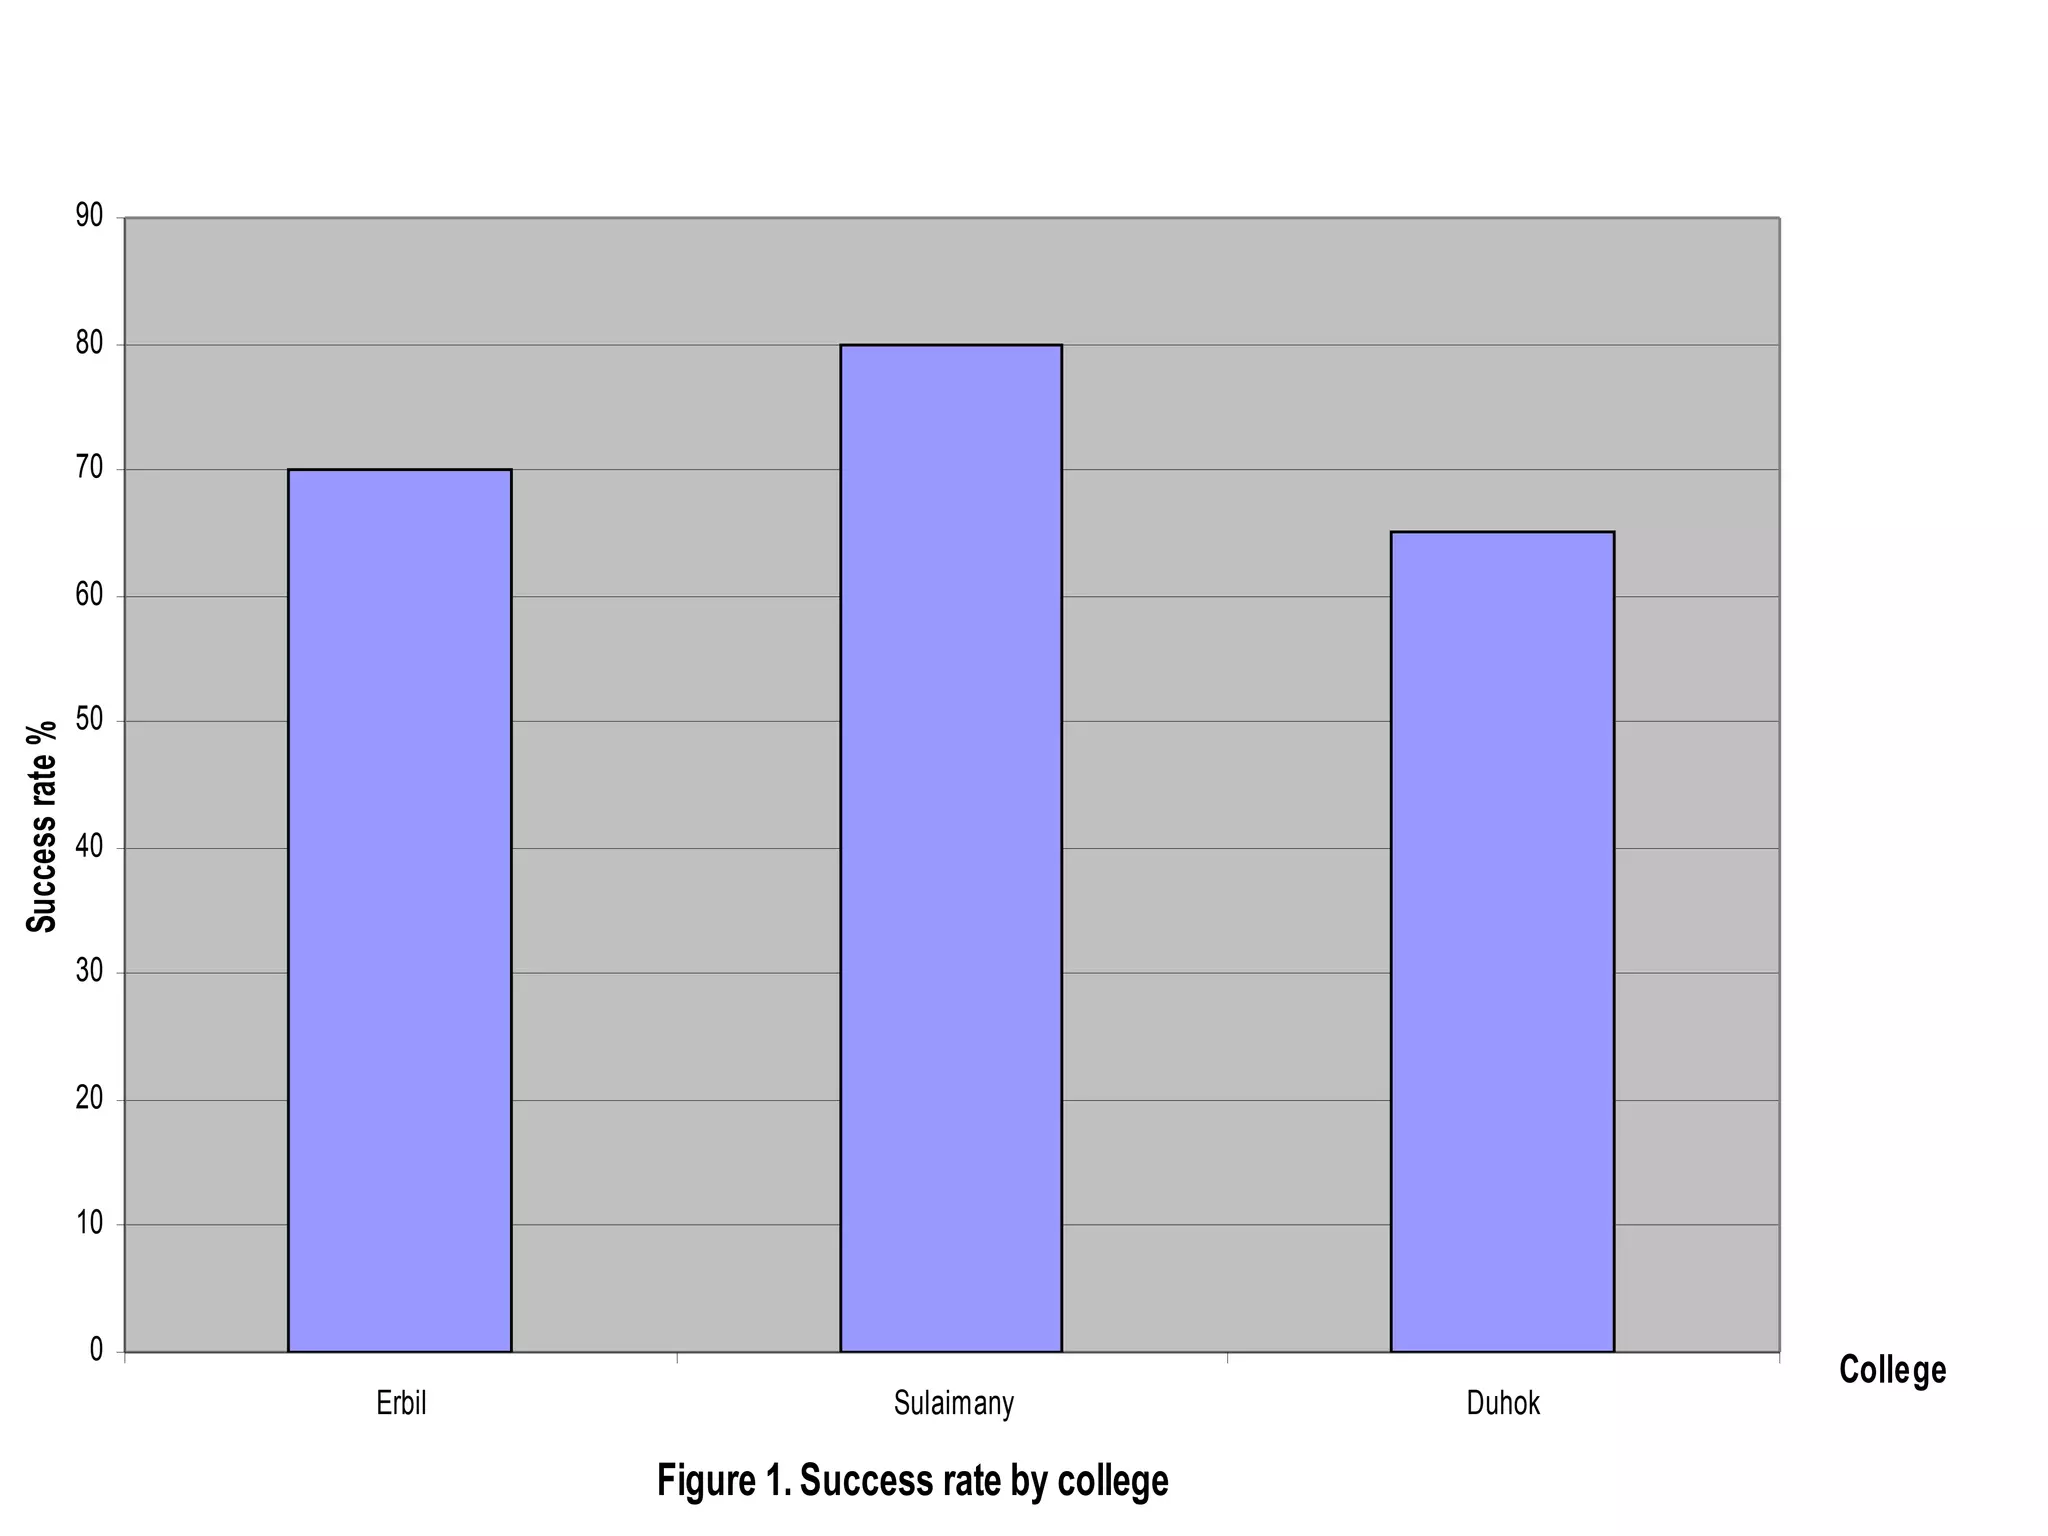
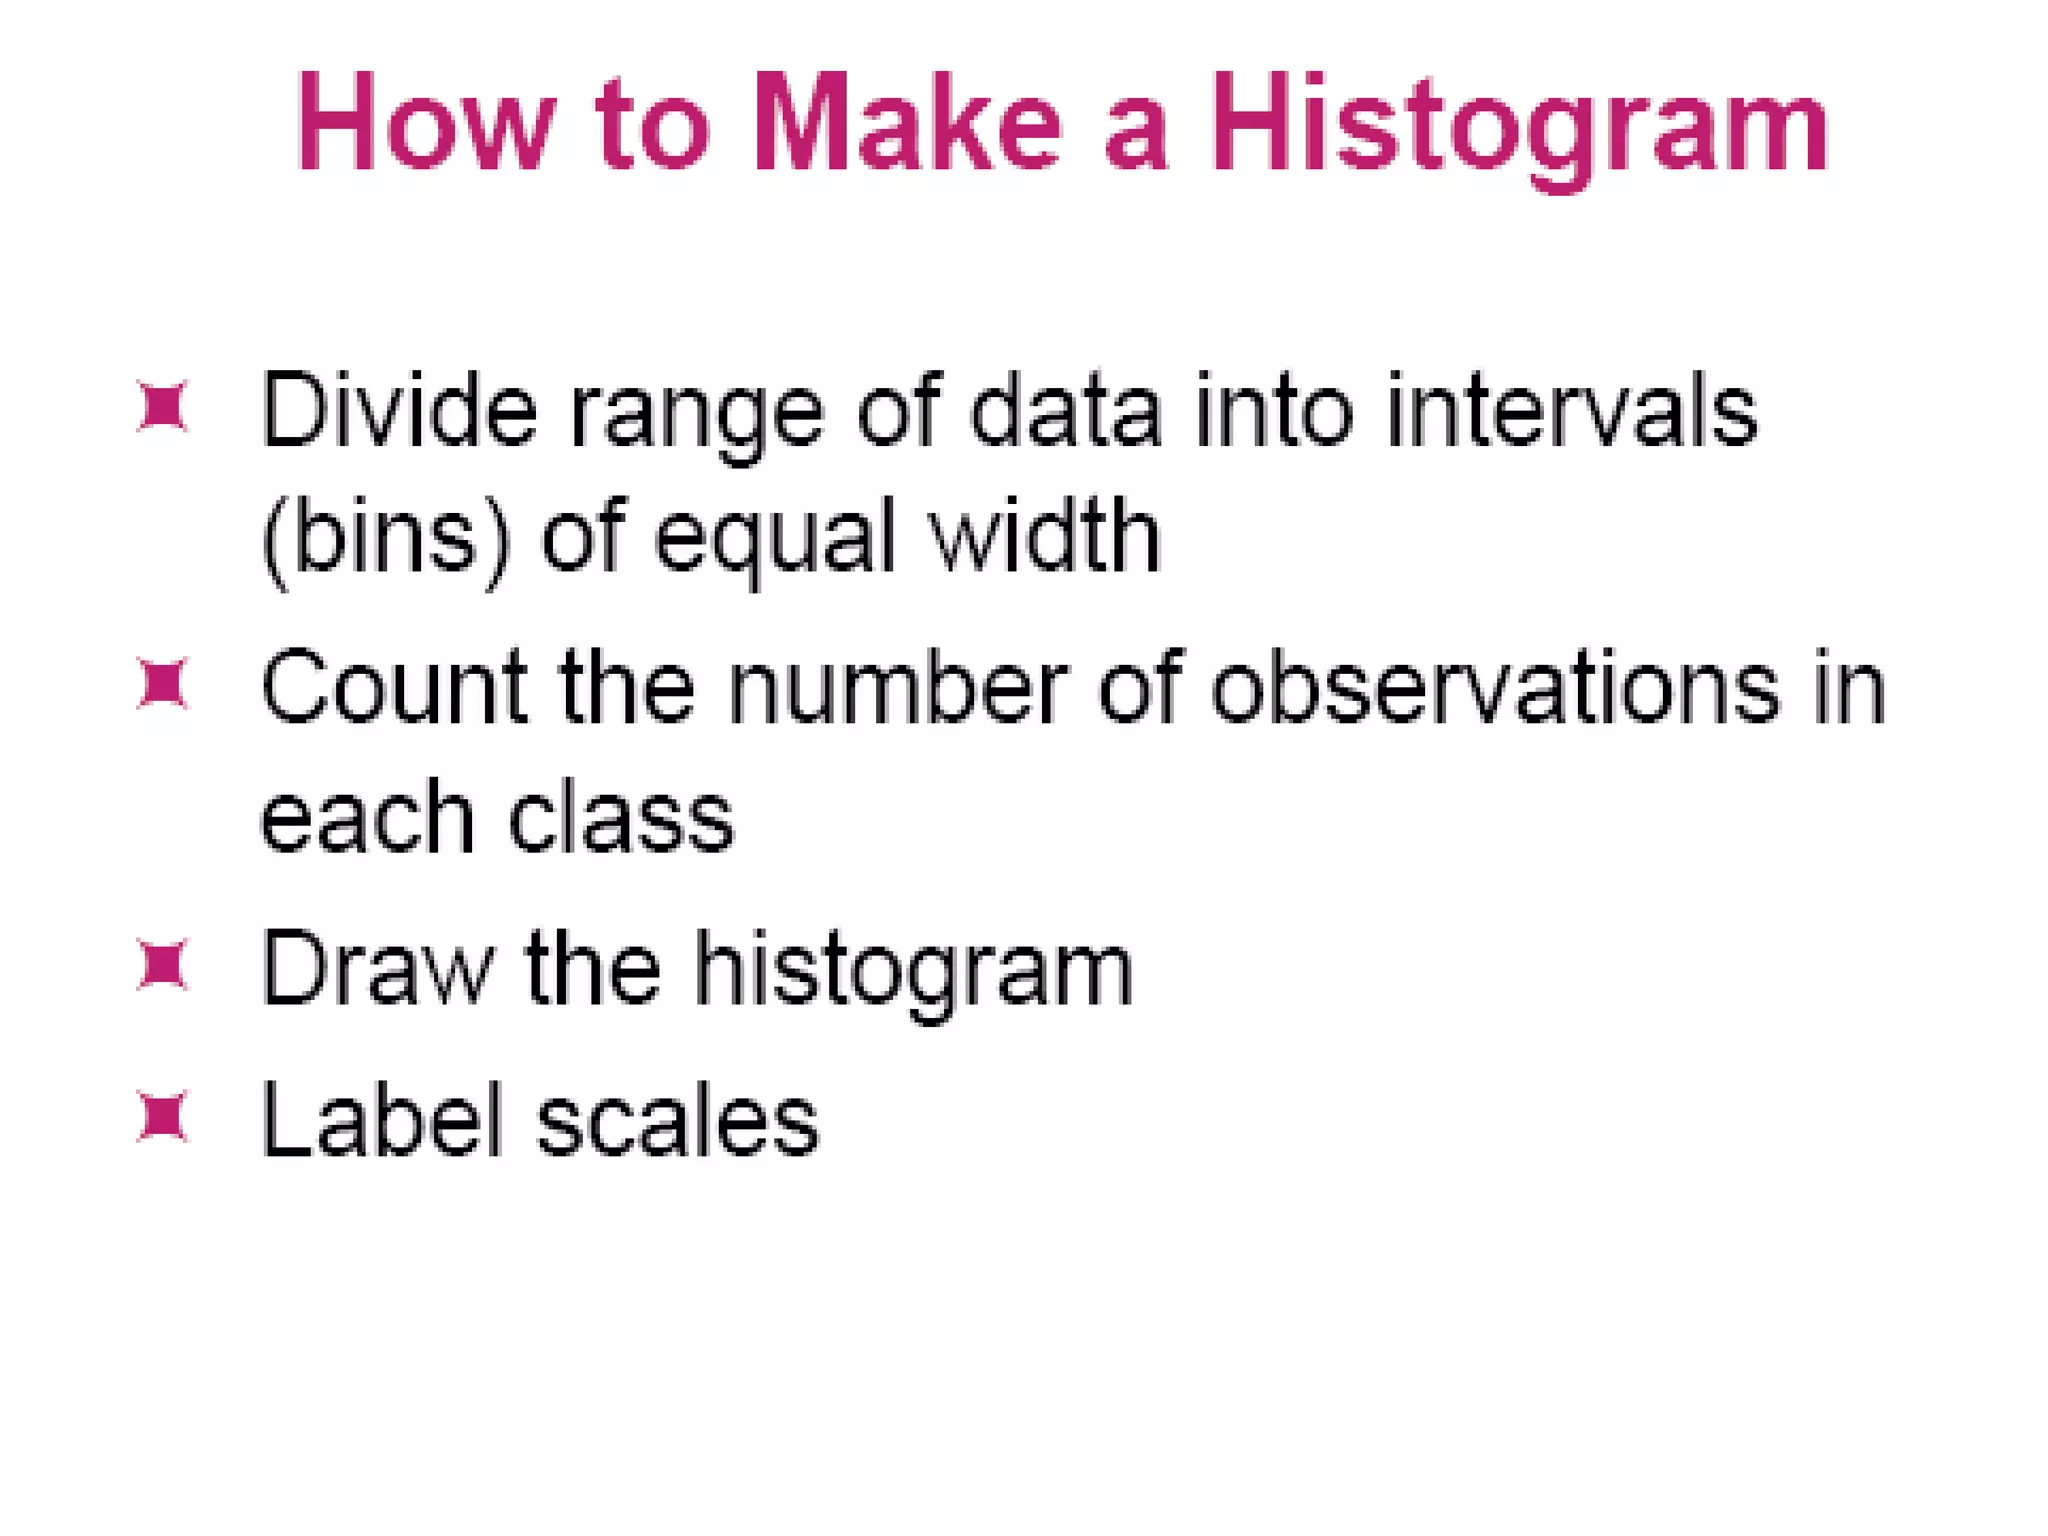
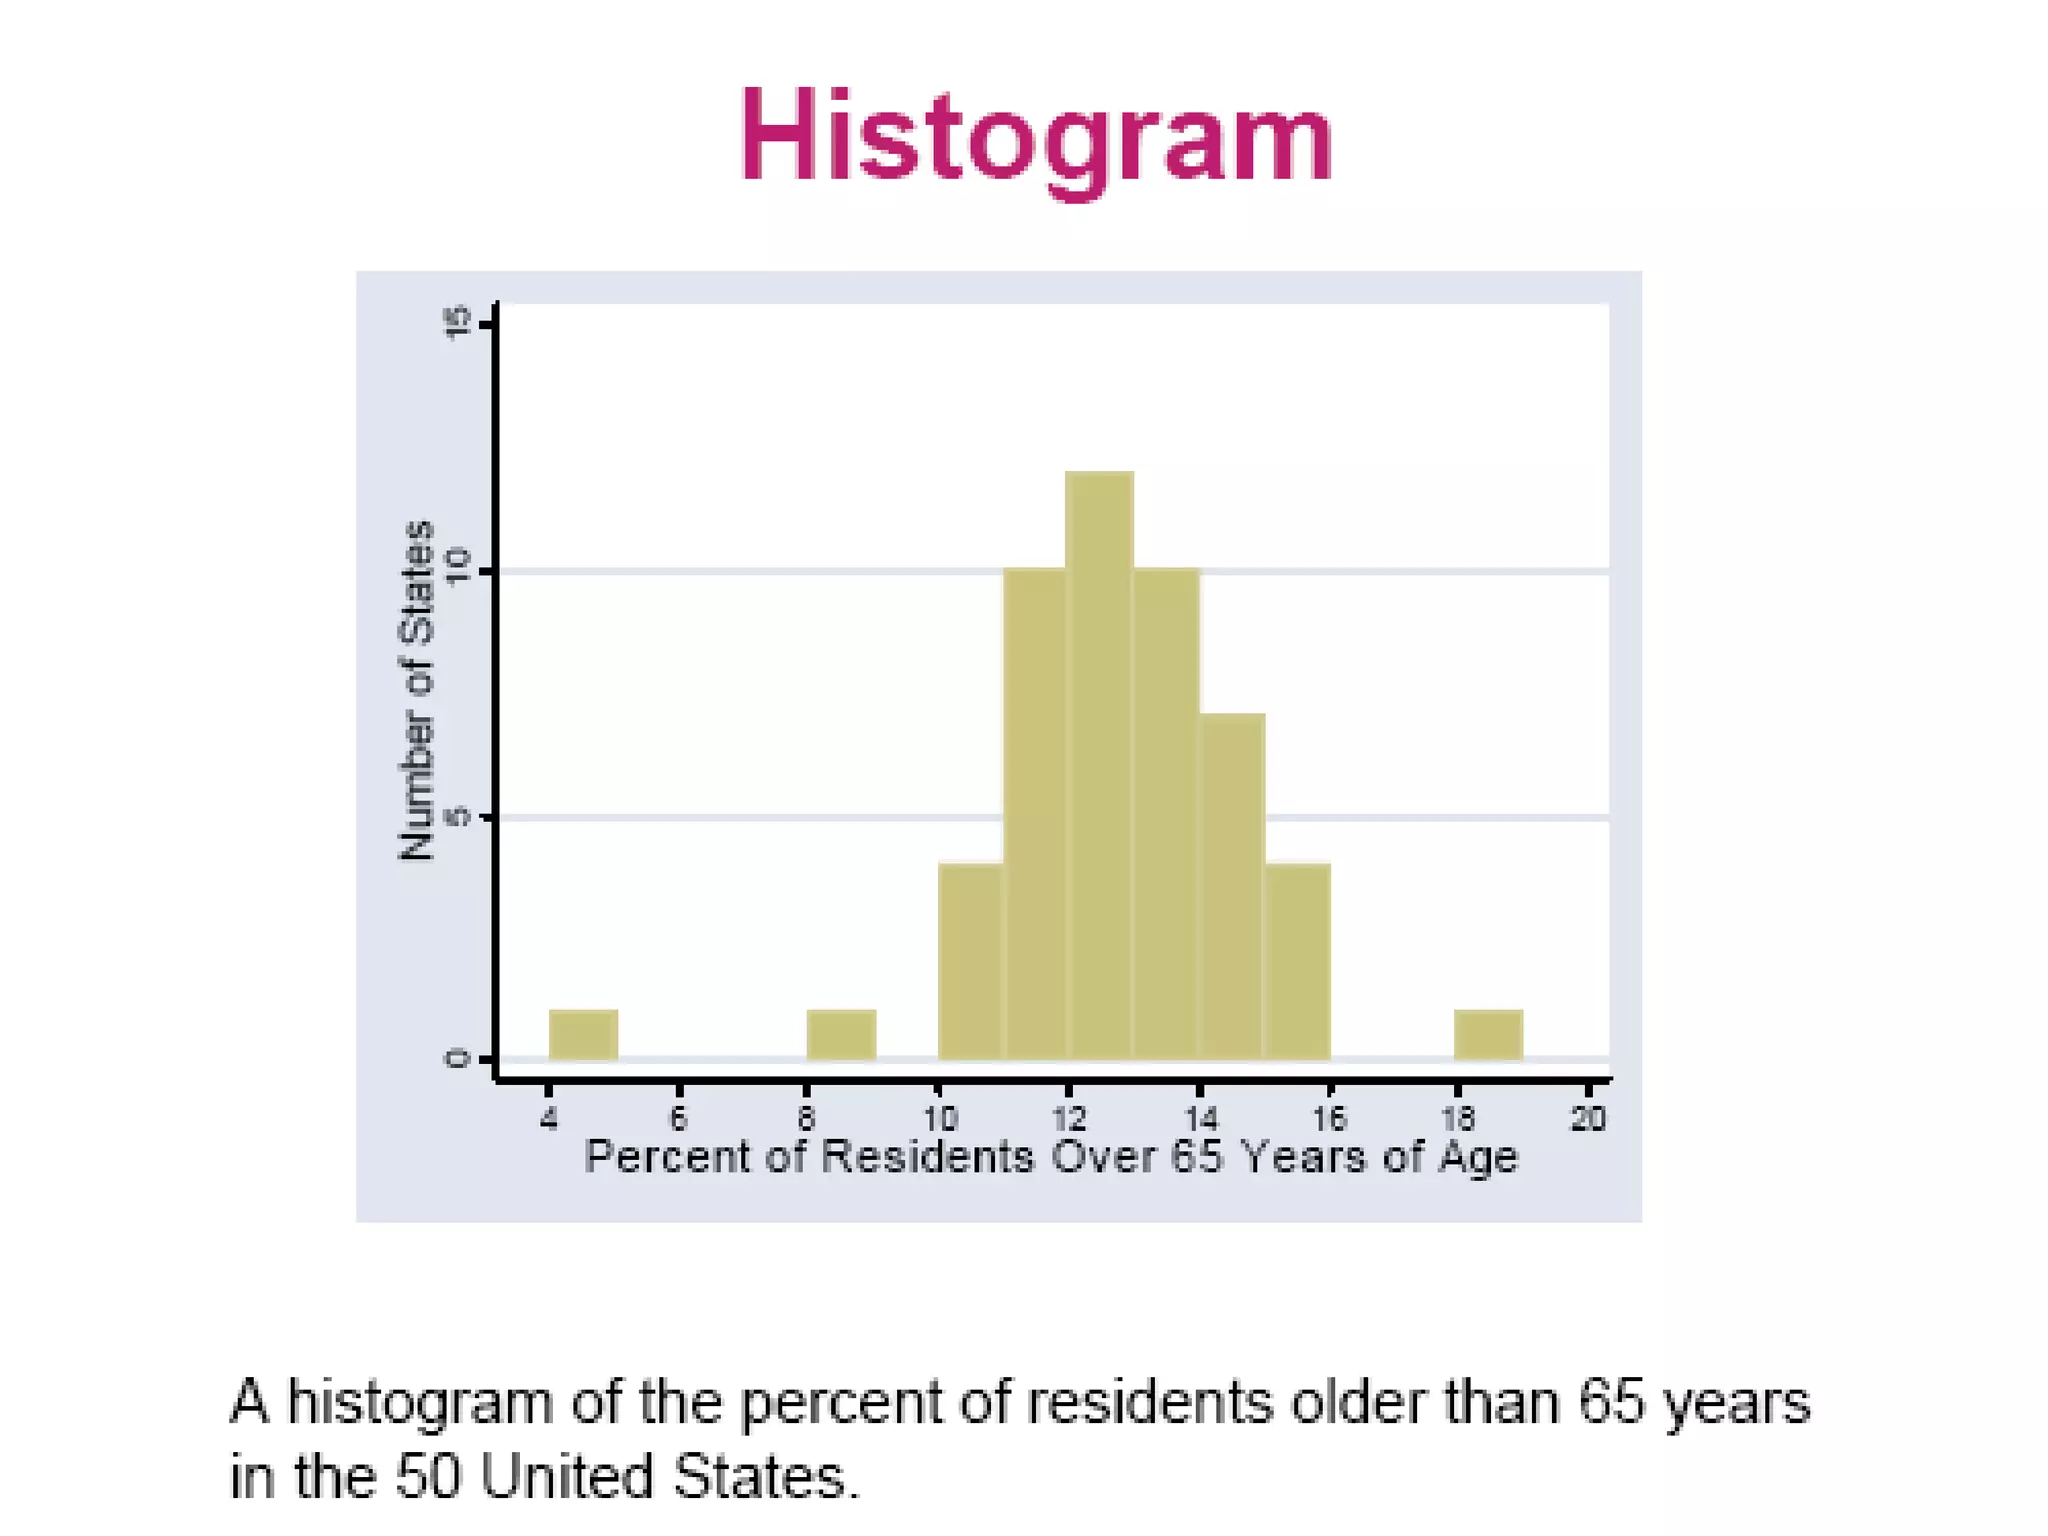
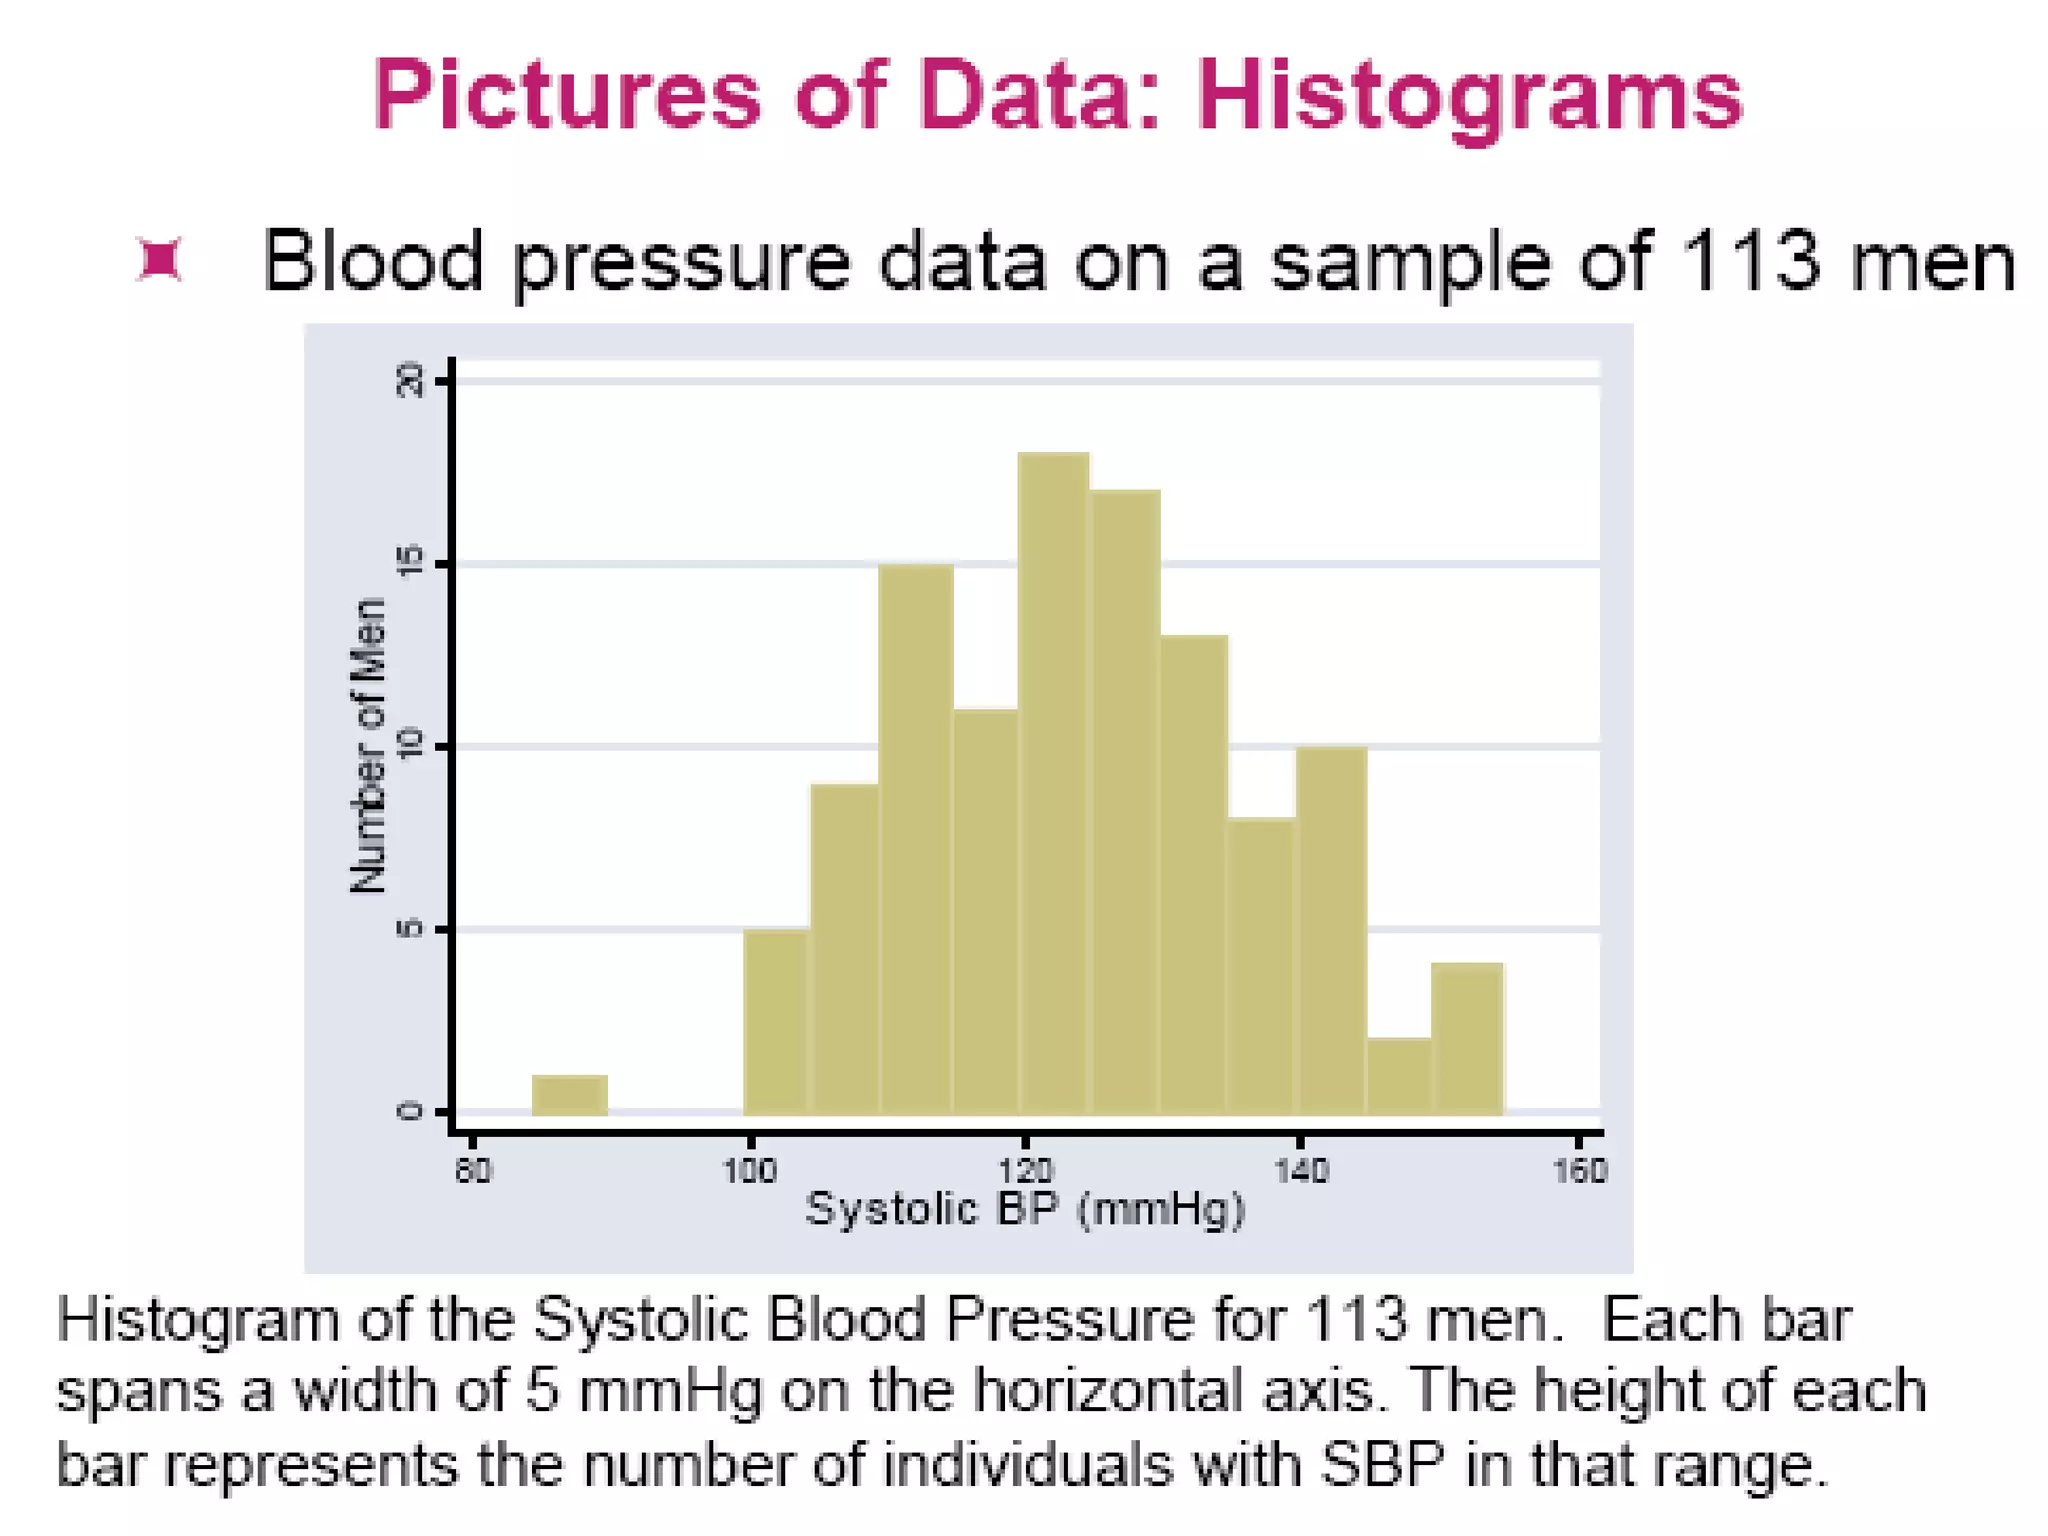
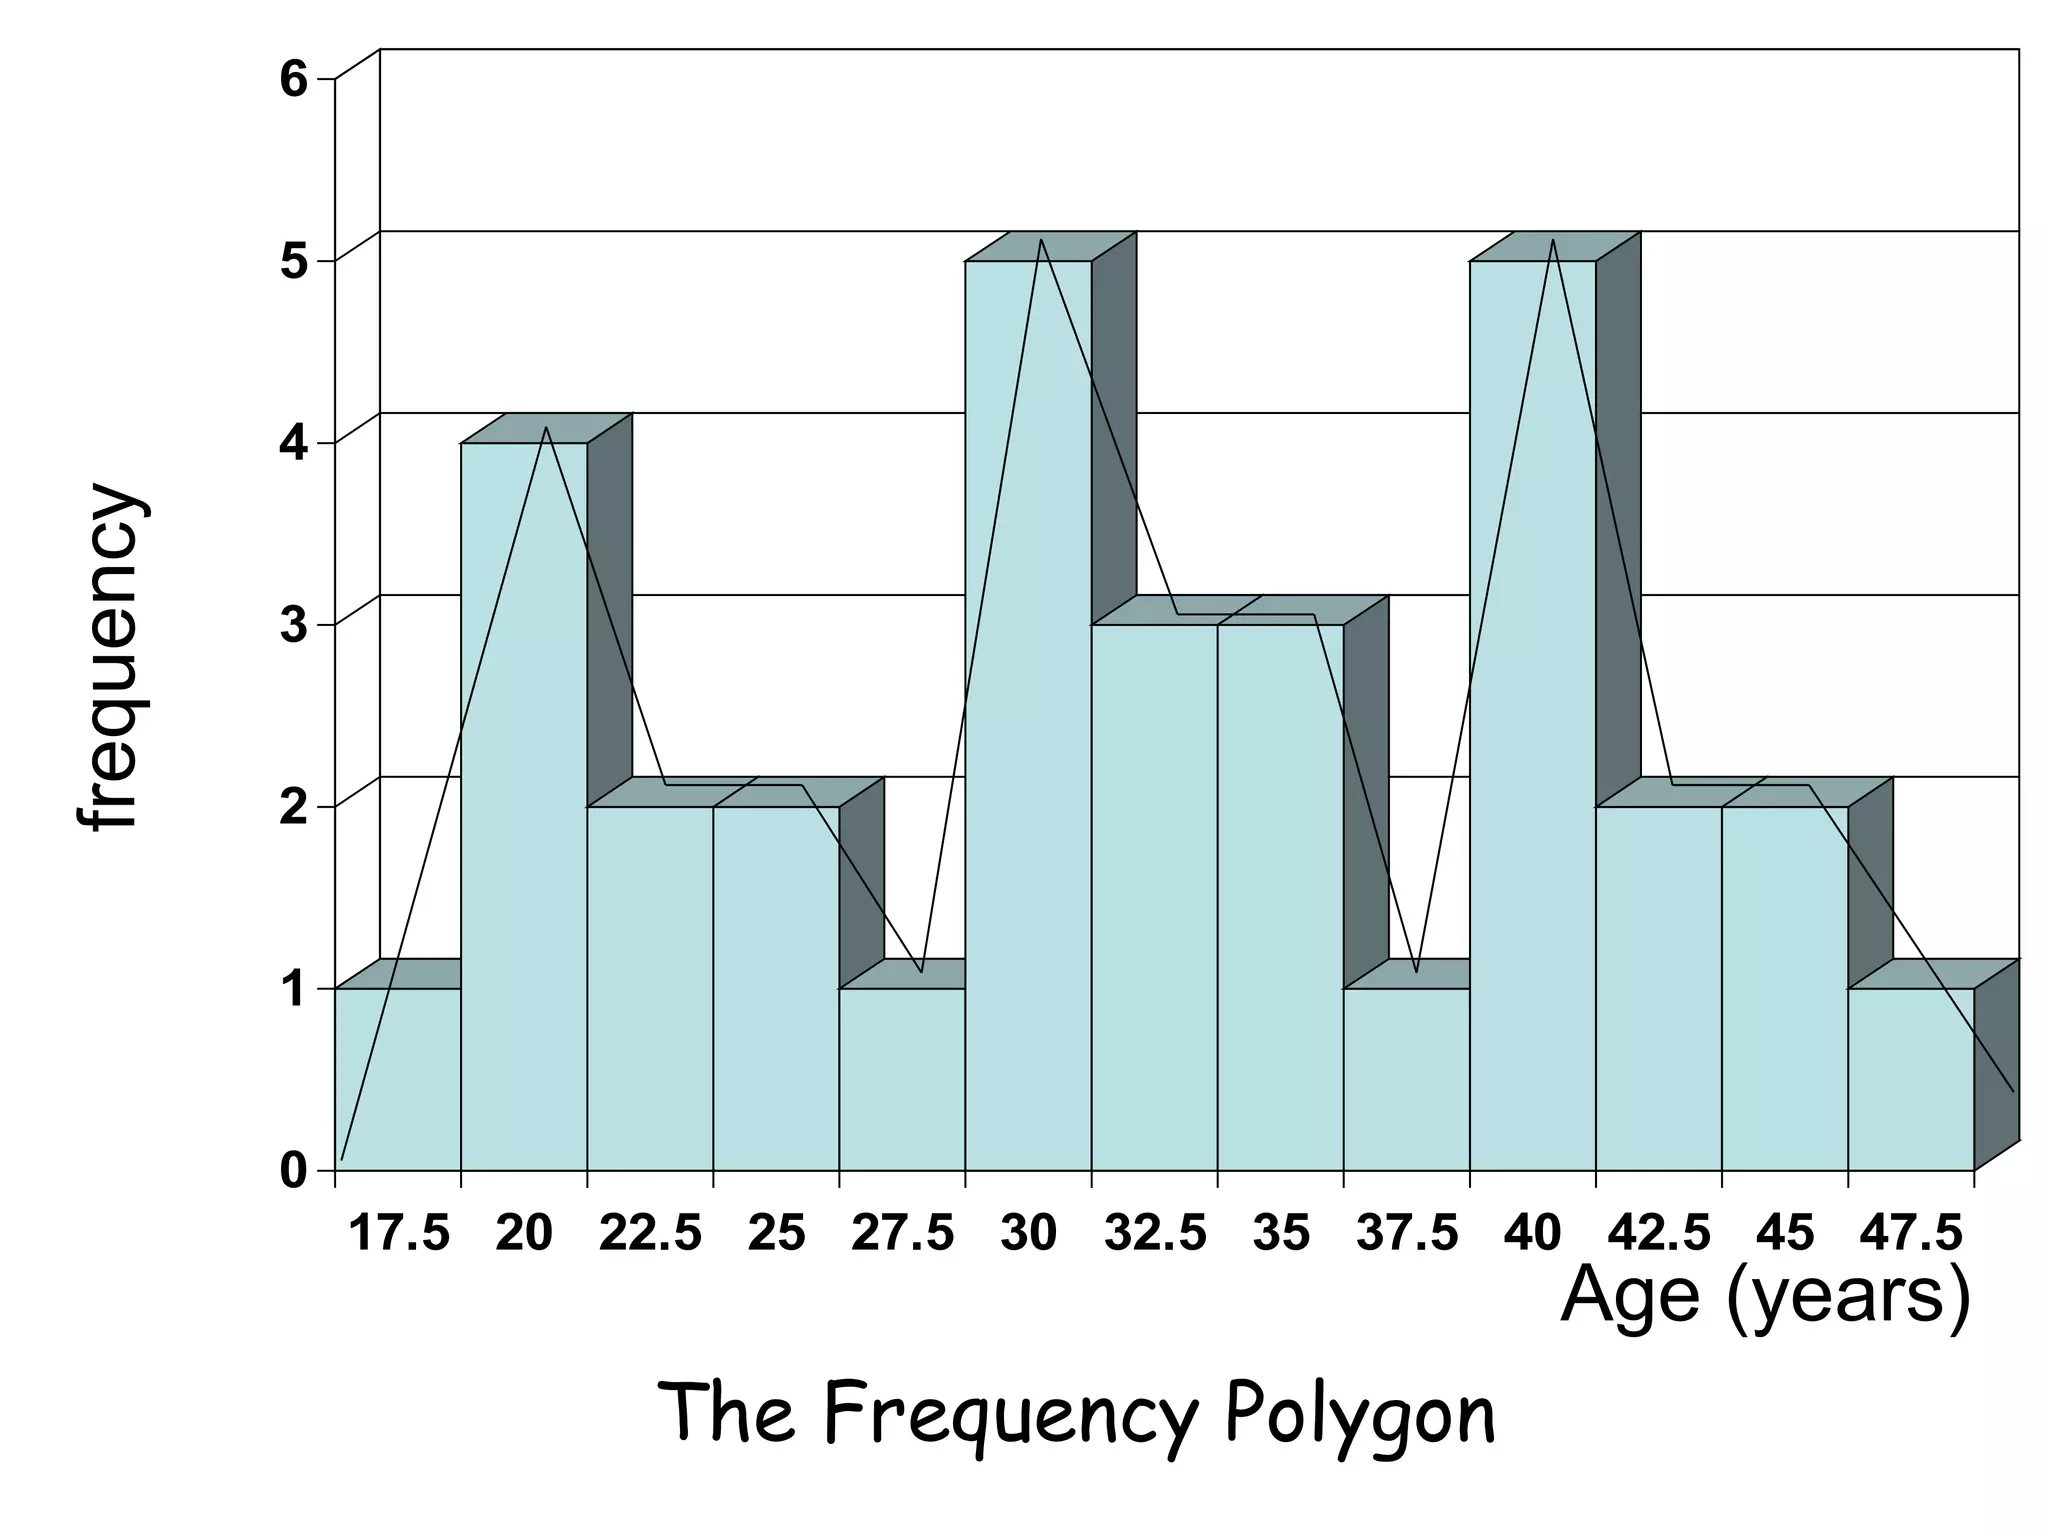
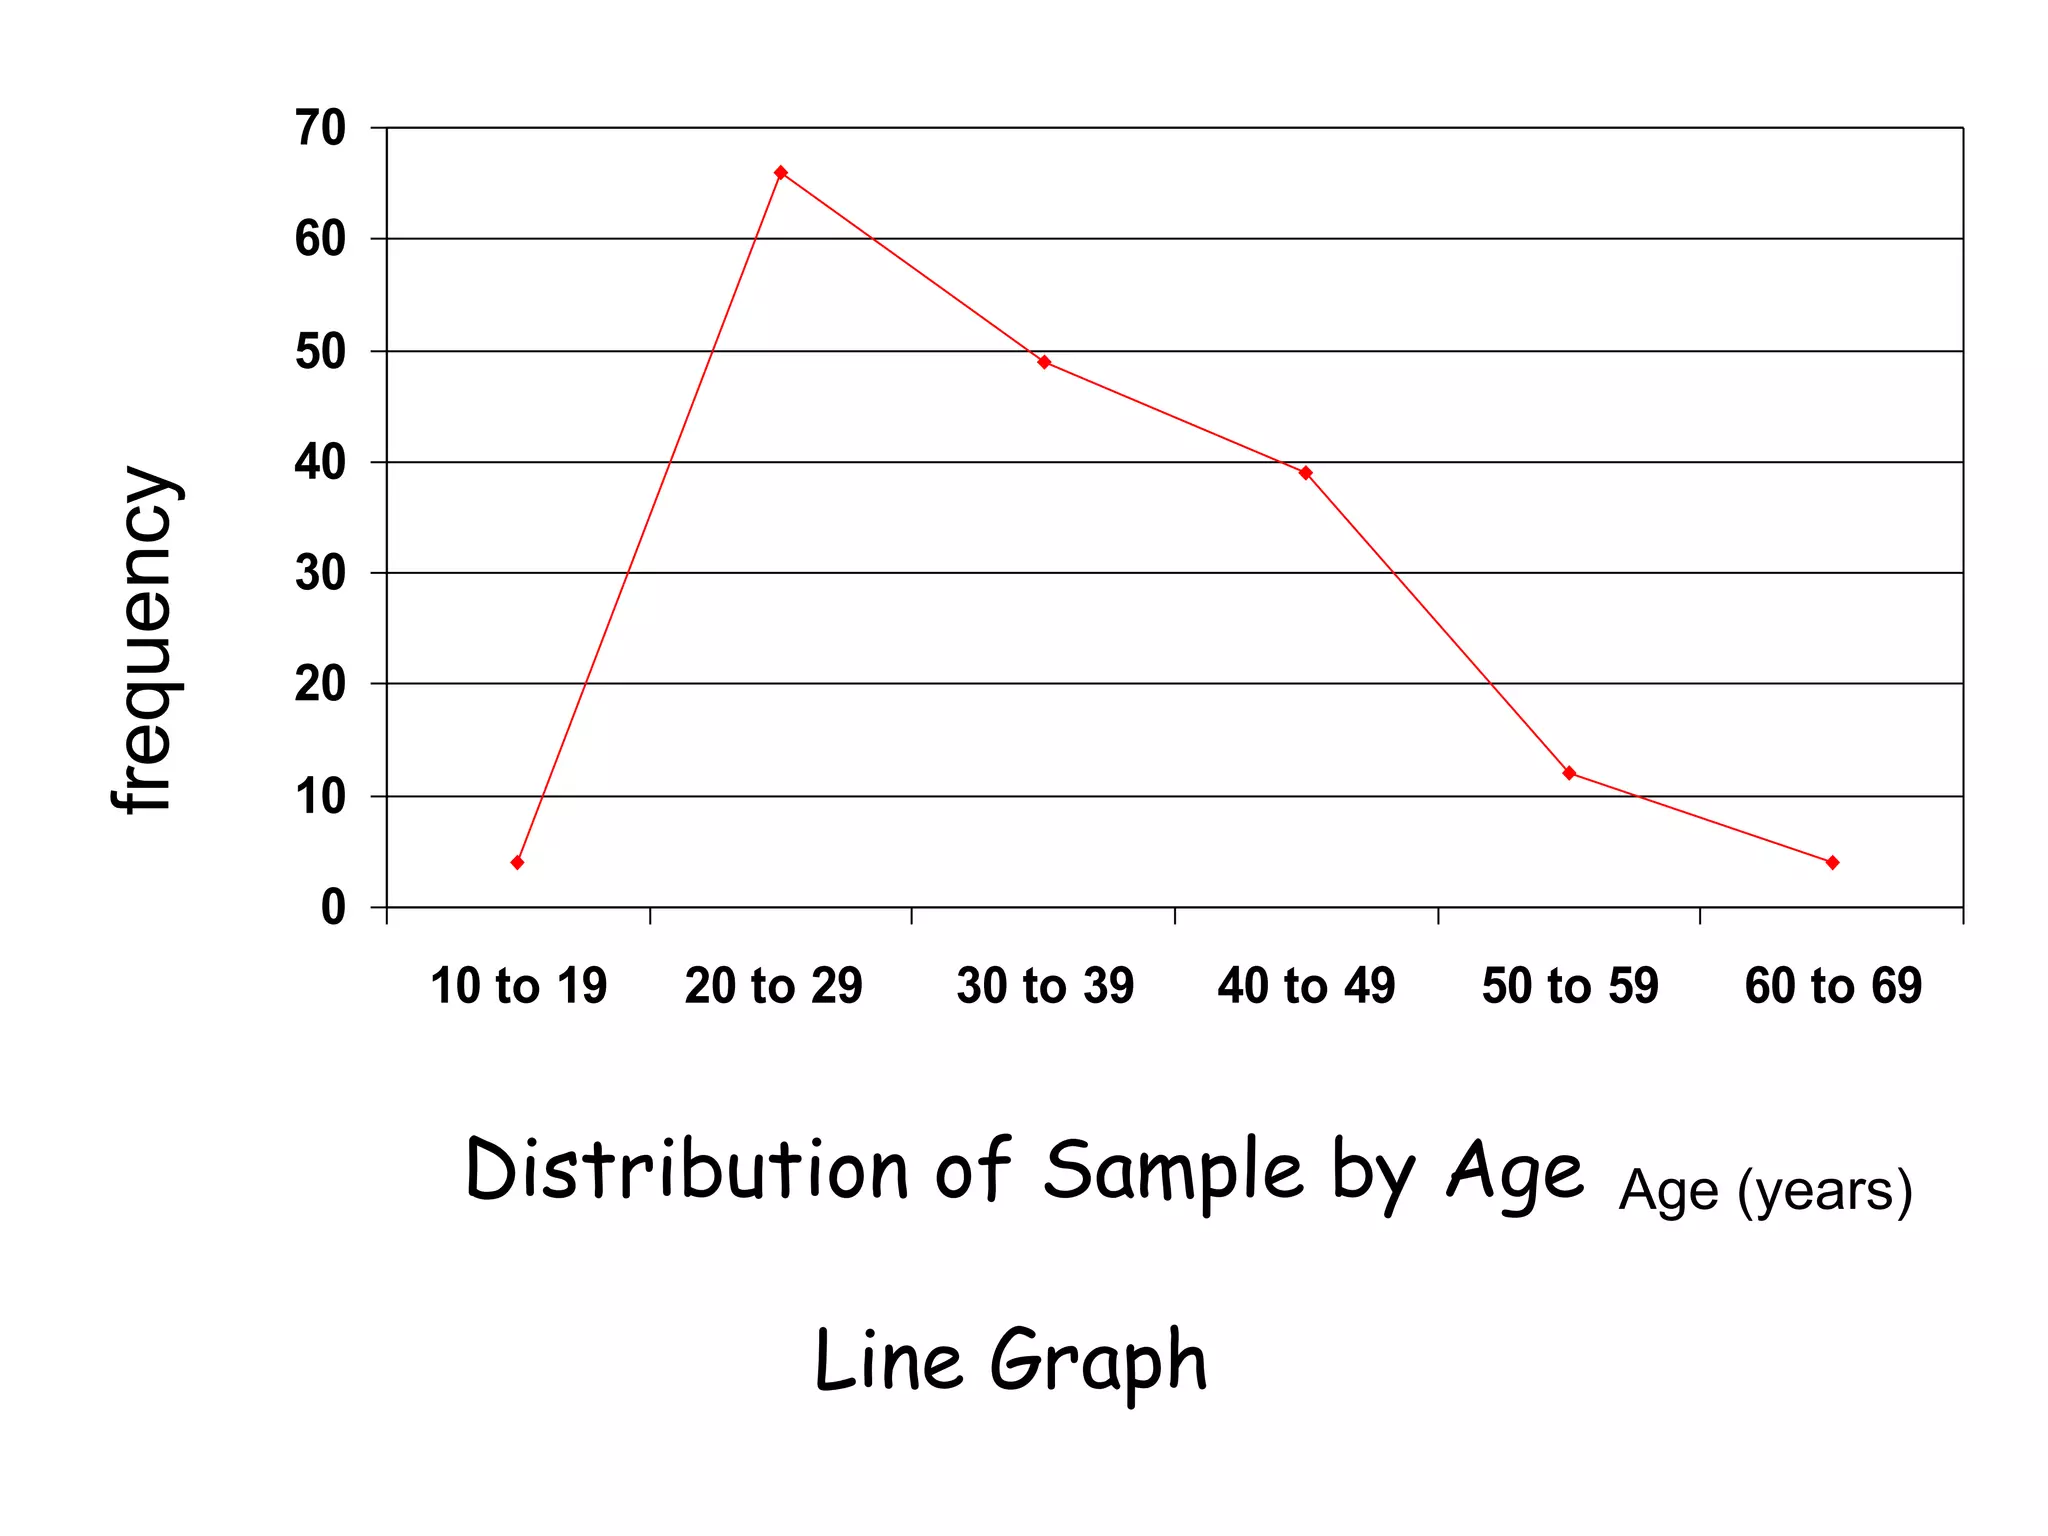

This document discusses methods for organizing and summarizing data, including ordered arrays, frequency distributions, and frequency polygons. An ordered array lists values from smallest to largest. A frequency distribution groups observations into class intervals to summarize the data, with 6-15 intervals typically used. Sturge's rule provides a formula for calculating the number of intervals. The width of intervals should be equal if possible. A example frequency distribution table with age data in intervals is provided. Figures also demonstrate a success rate by college graph and frequency polygon displaying age data.


![Prac excises 3[1].5](https://cdn.slidesharecdn.com/ss_thumbnails/pracexcises31-150331131154-conversion-gate01-thumbnail.jpg?width=640&height=640&fit=bounds)


