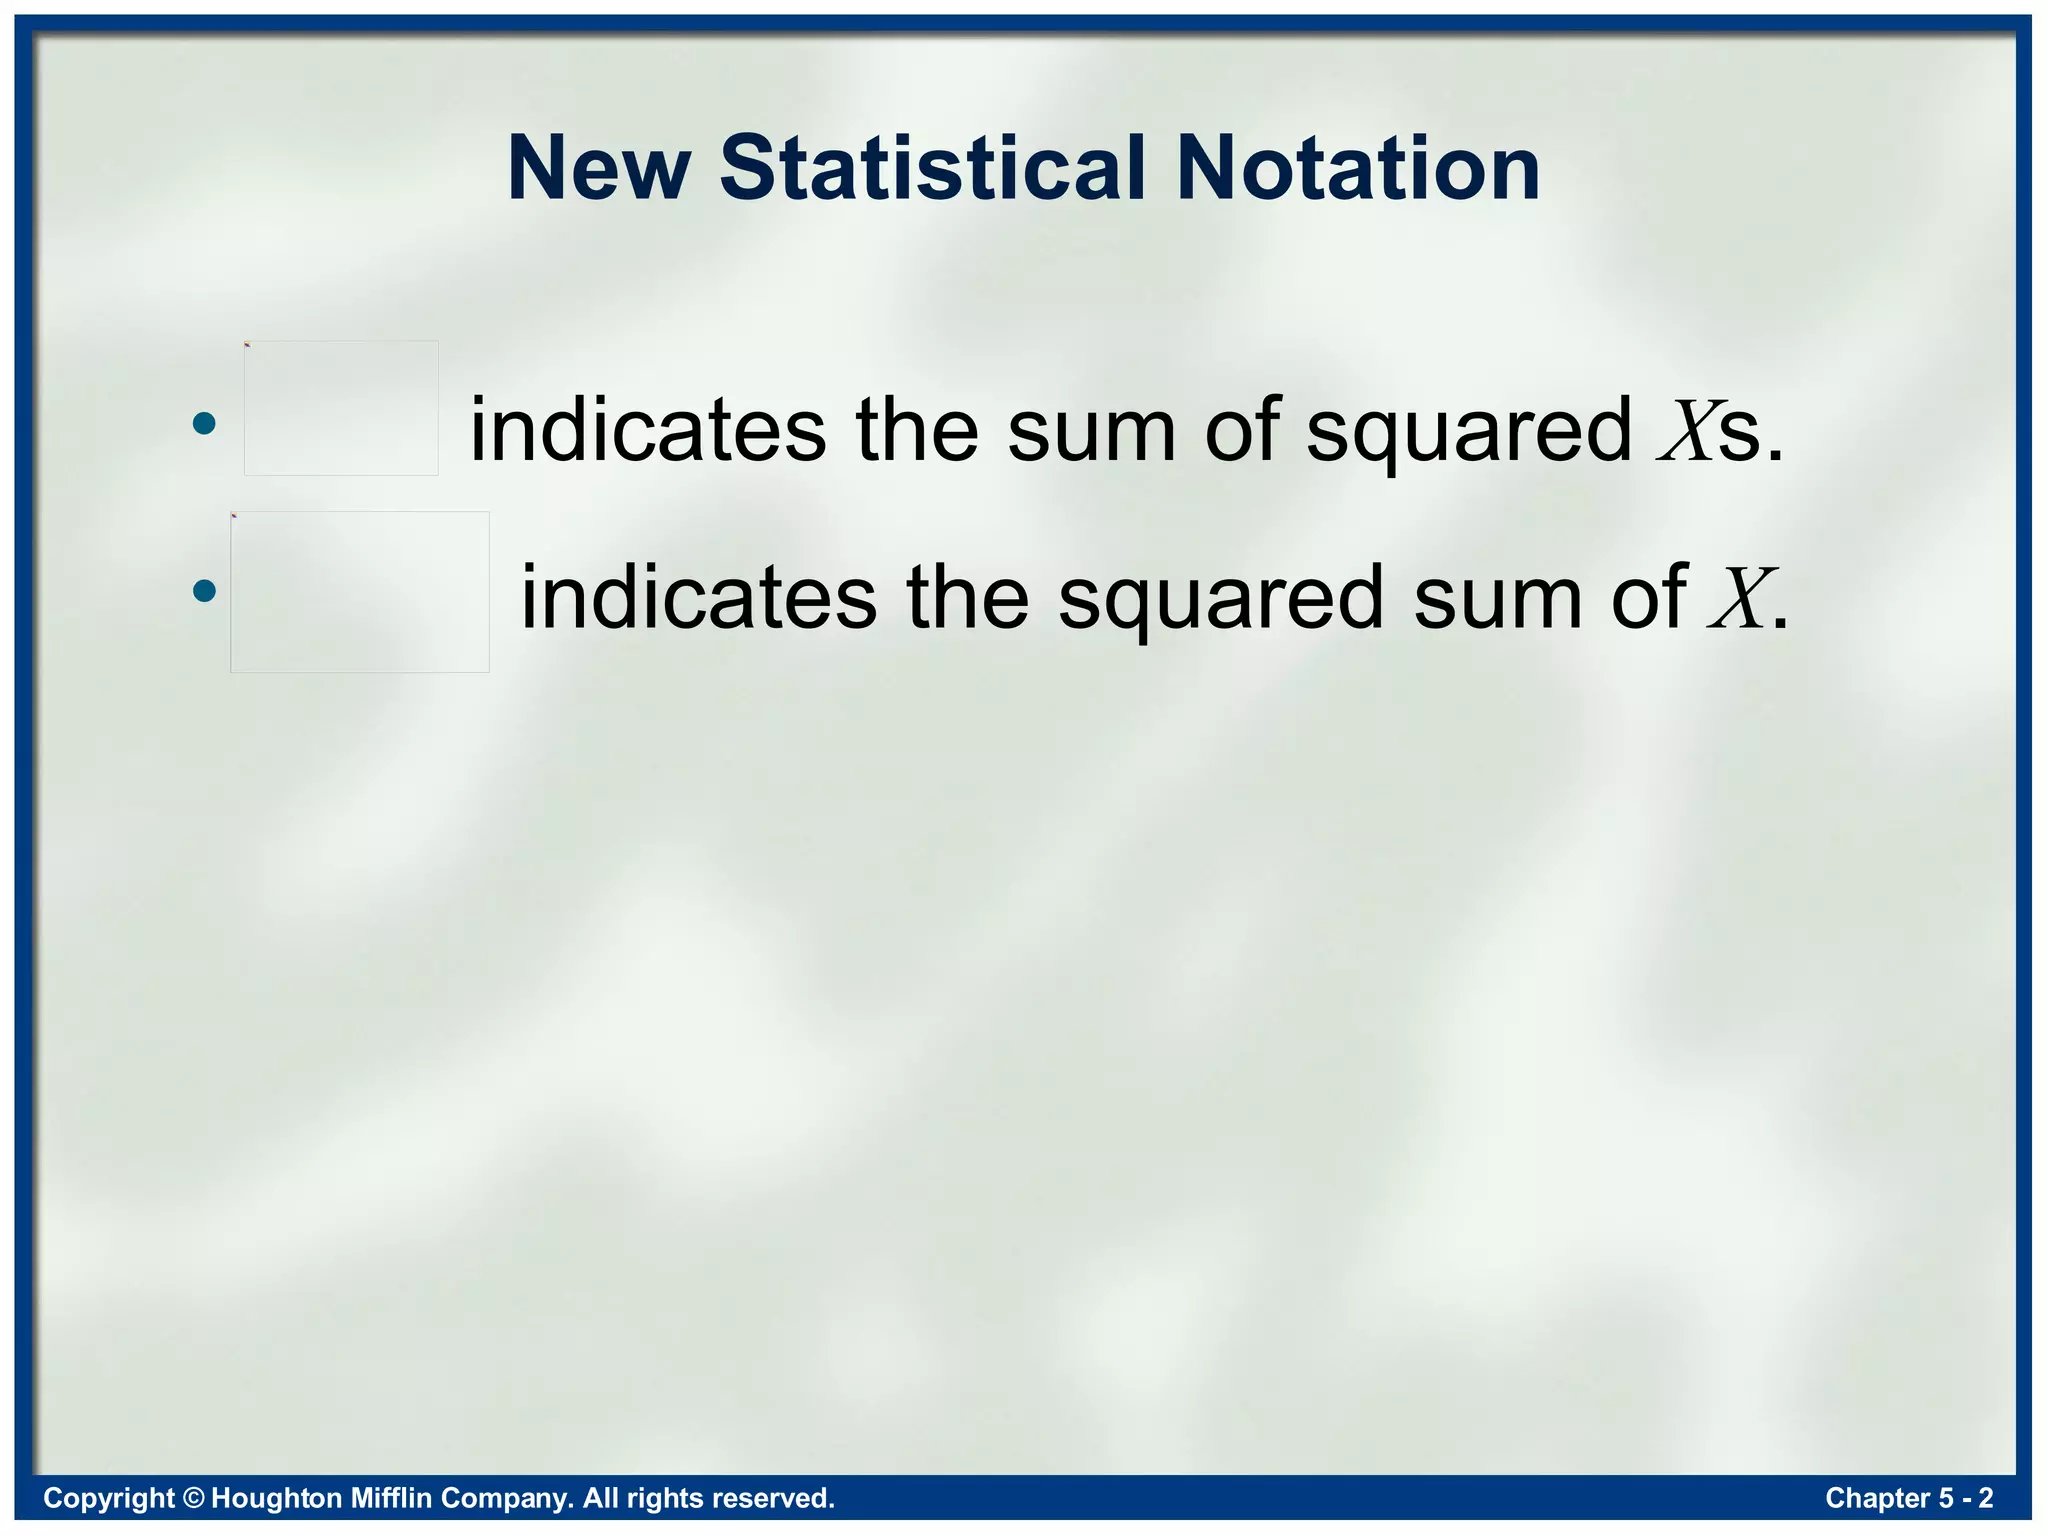
This document discusses measures of variability used to describe how spread out data values are from the mean or average. It defines and provides formulas for calculating range, variance, standard deviation, sample variance, sample standard deviation, population variance, population standard deviation, estimated population variance, and estimated population standard deviation. These measures are important in statistical analysis to understand the distribution of data values.
The Range The range indicates the distance between the two most extreme scores in a distribution Range = highest score – lowest score
8.
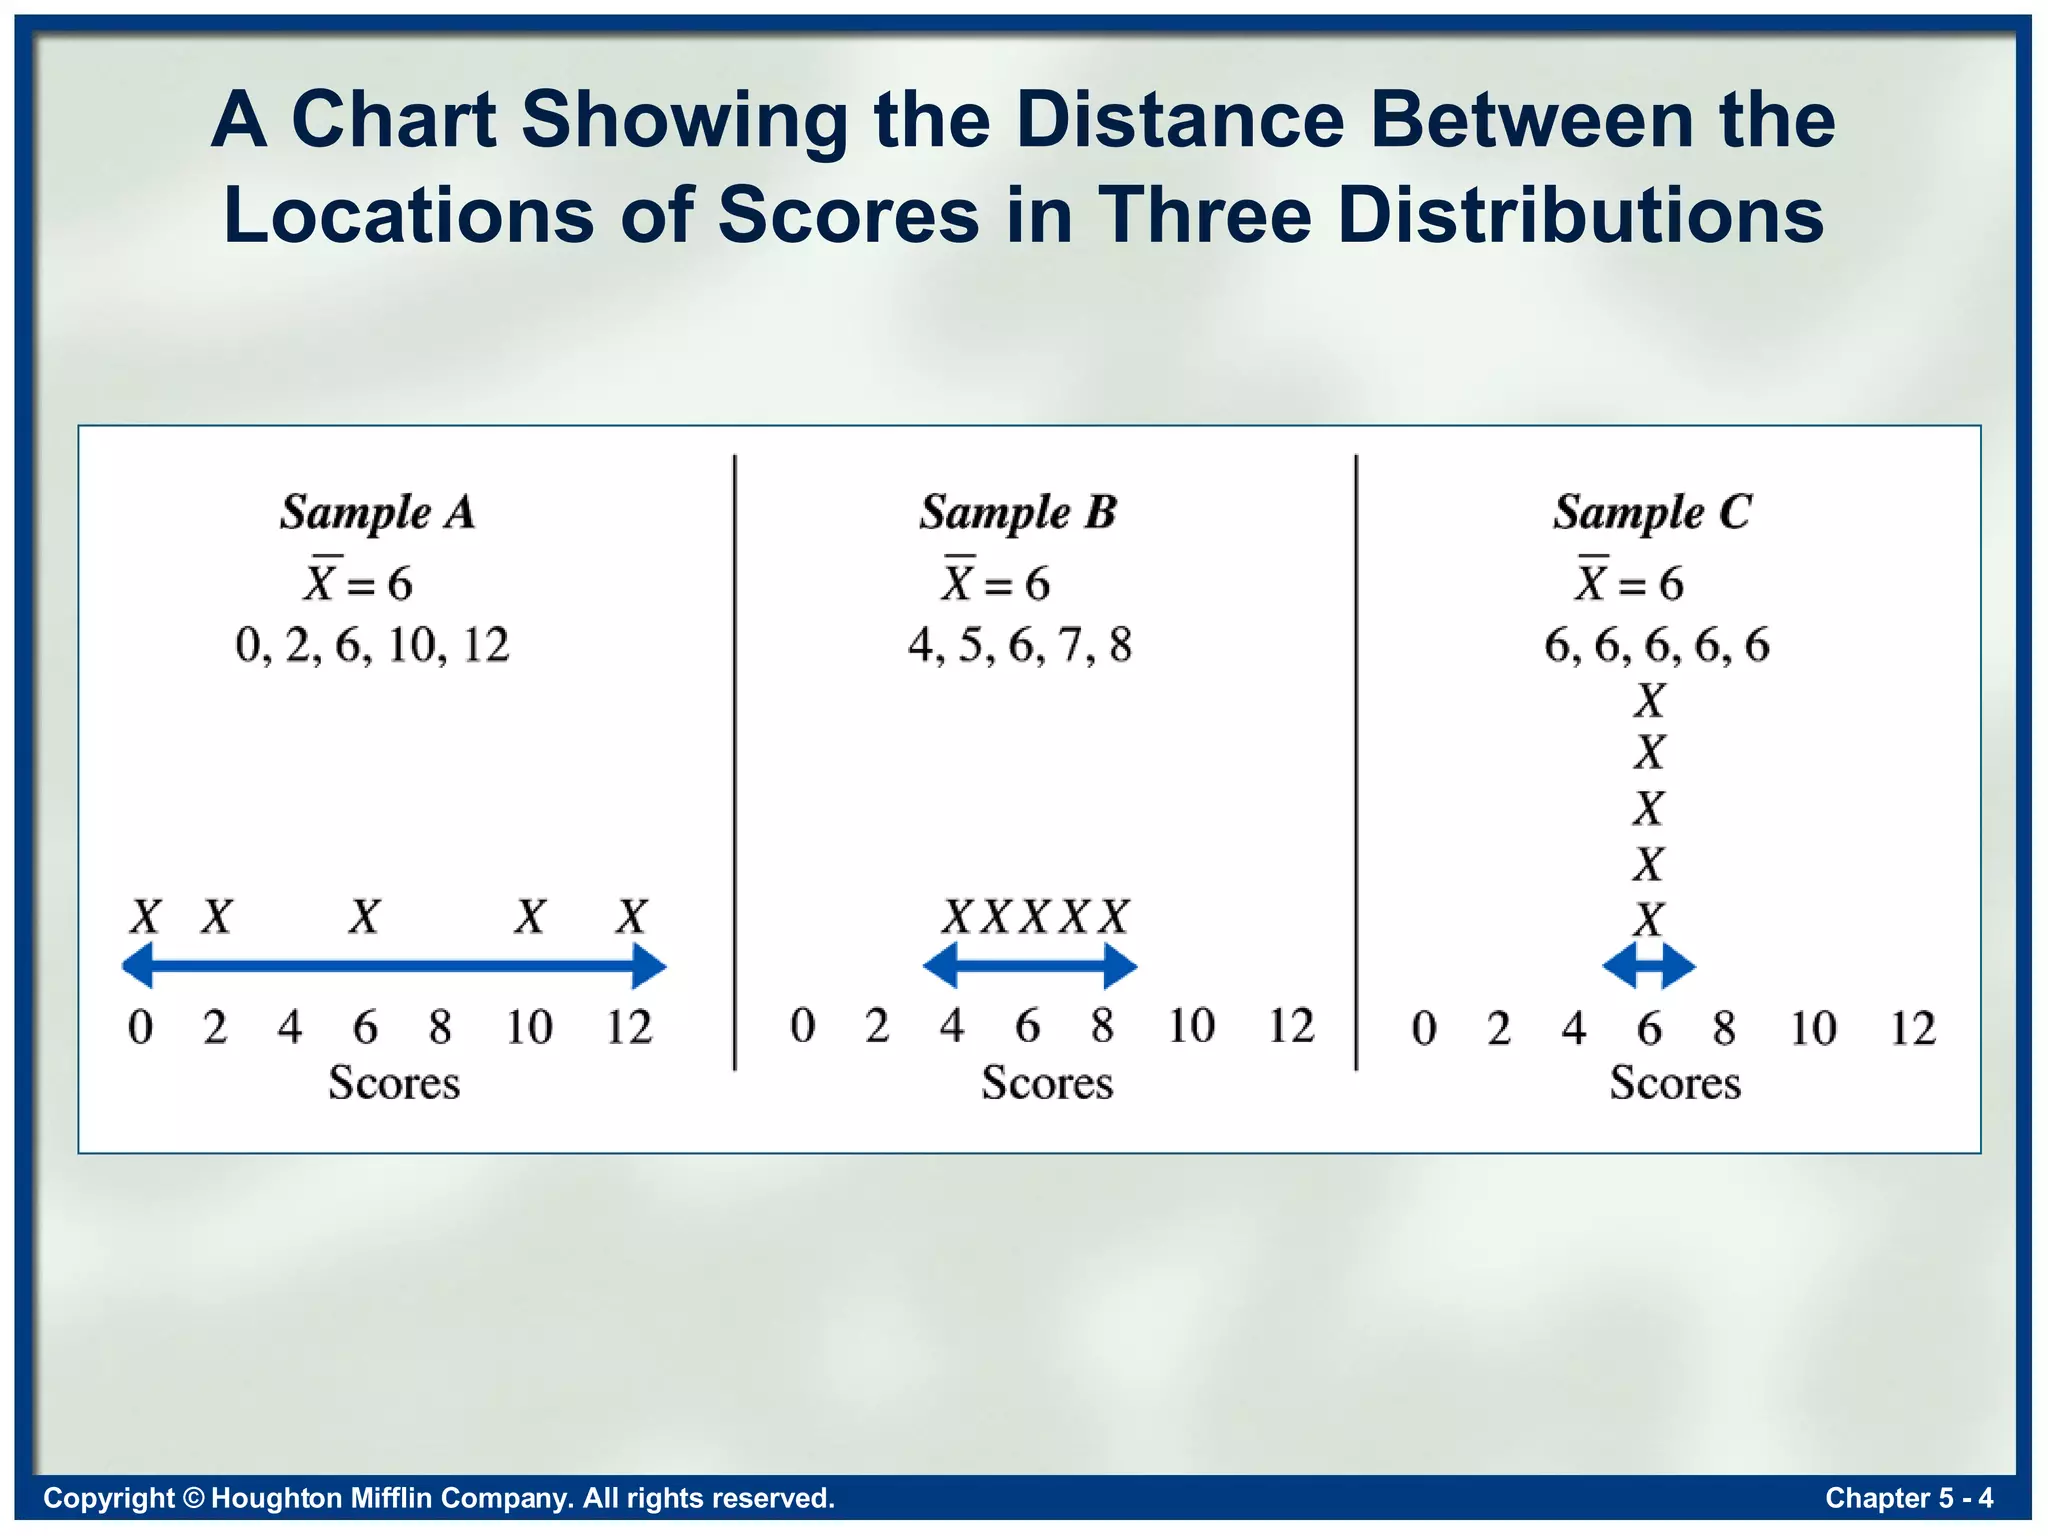
Variance and StandardDeviation The variance and standard deviation are two measures of variability that indicate how much the scores are spread out around the mean We use the mean as our reference point since it is at the center of the distribution
The Standard DeviationThe standard deviation indicates the “average deviation” from the mean, the consistency in the scores, and how far scores are spread out around the mean The larger the value of X , the more the scores are spread out around the mean, and the wider the distribution
Normal Distribution and the Standard Deviation Approximately 34% of the scores in a perfect normal distribution are between the mean and the score that is one standard deviation from the mean.
17.
Standard Deviation andRange For any roughly normal distribution, the standard deviation should equal about one-sixth of the range.
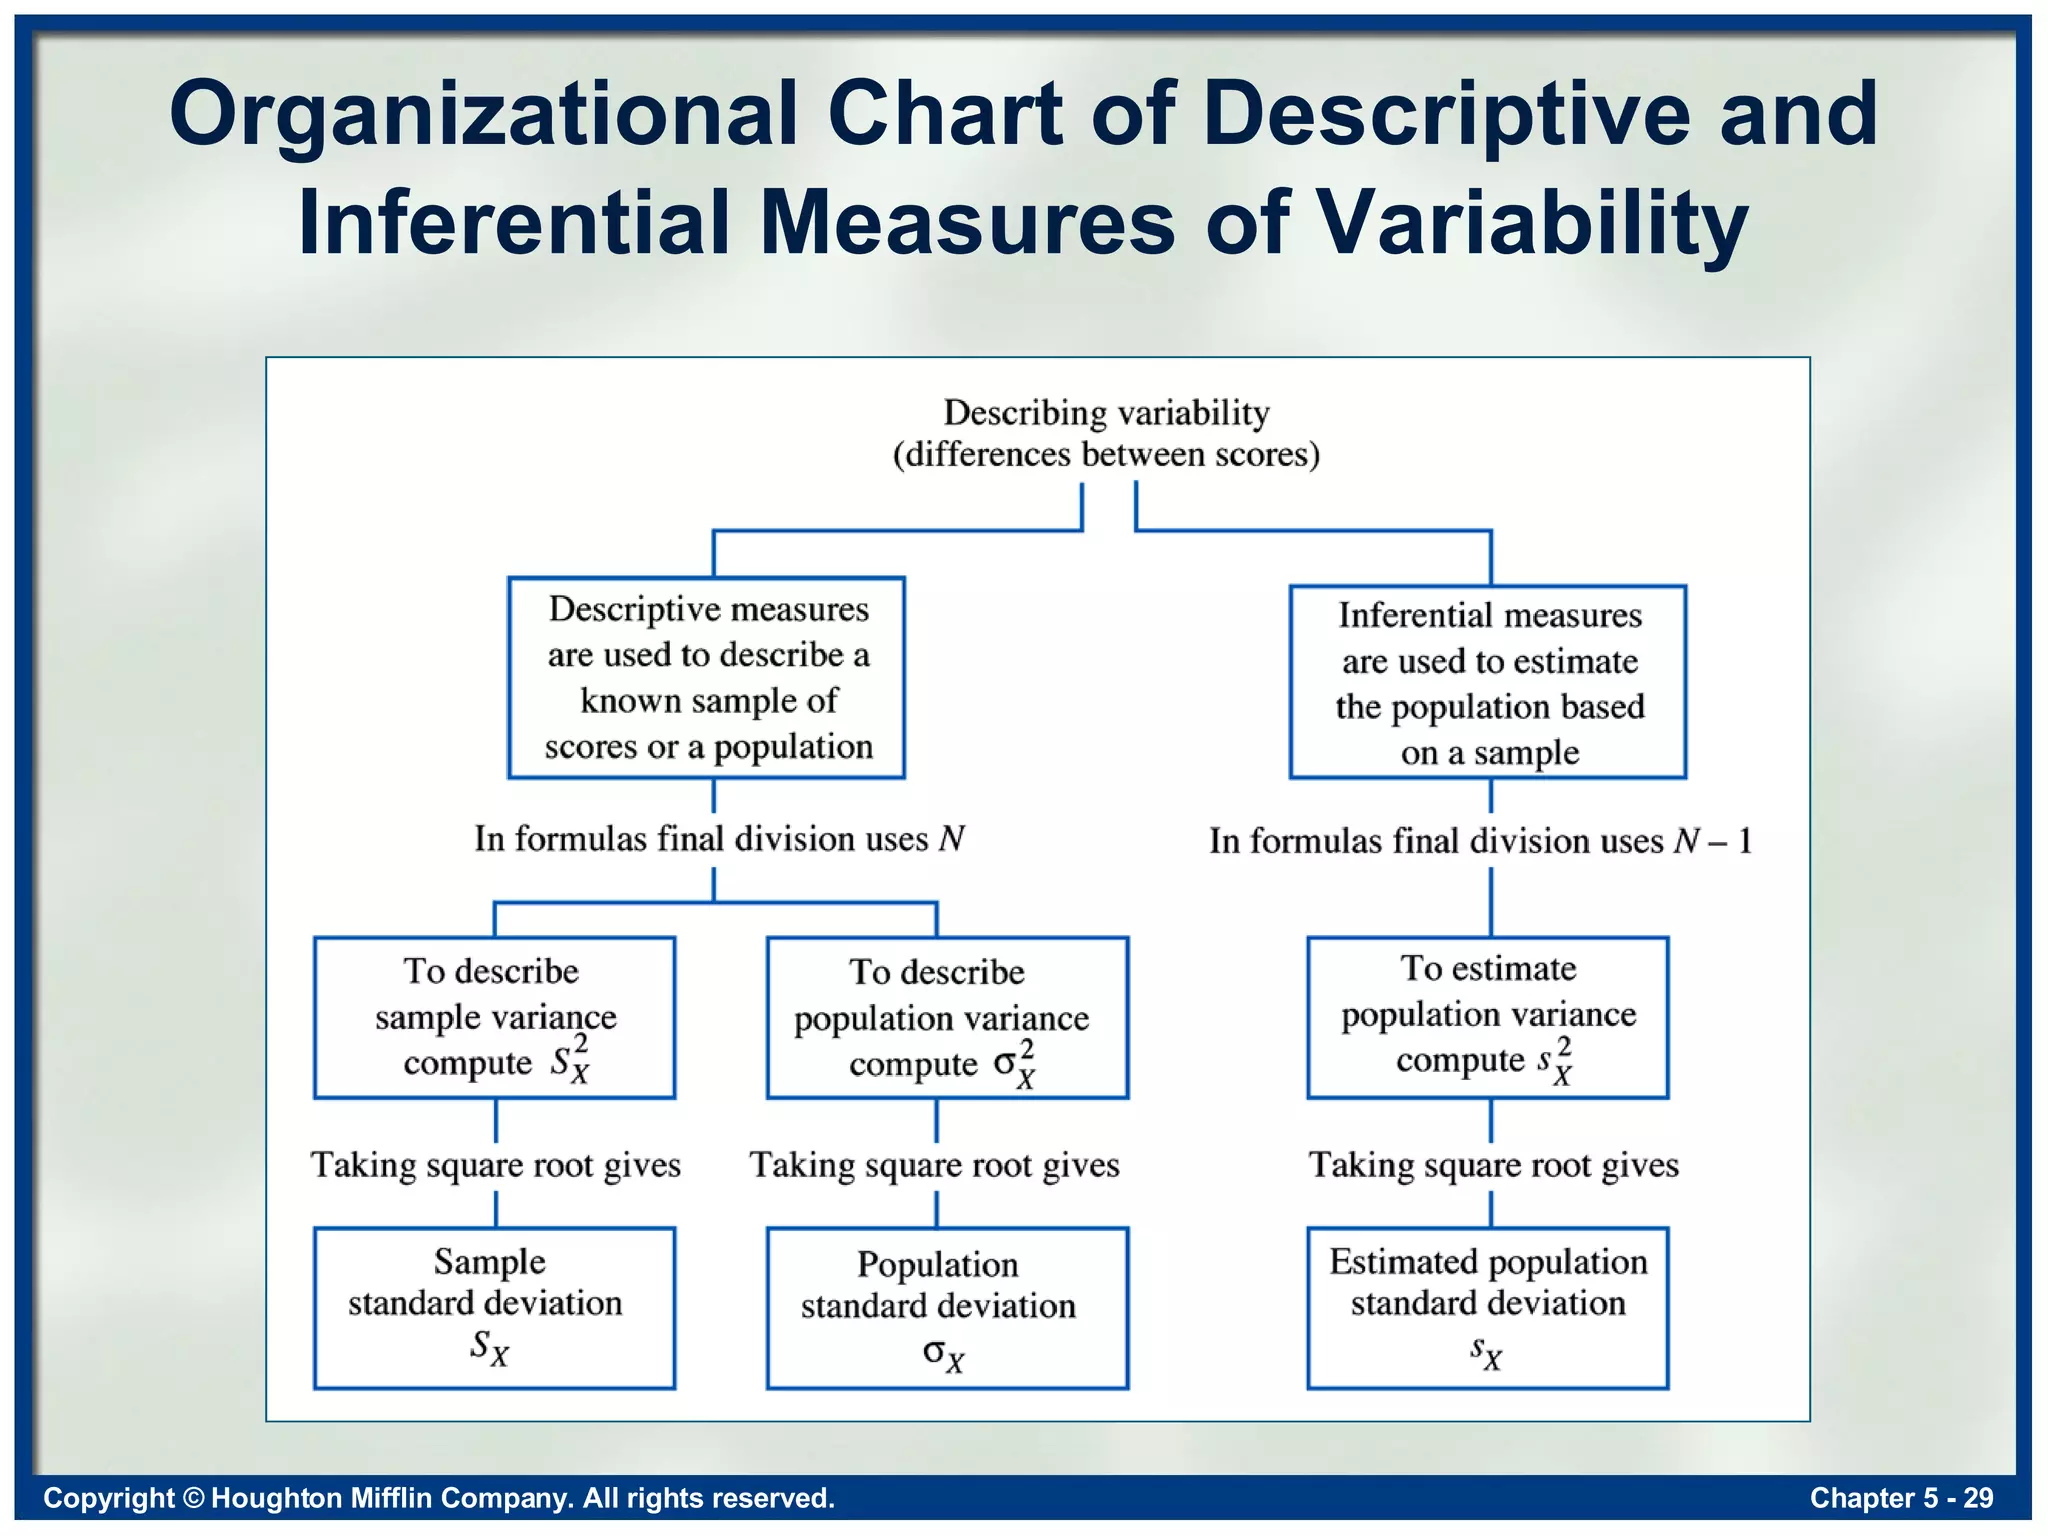
Estimating the PopulationVariance and Standard Deviation The sample variance is a biased estimator of the population variance. The sample standard deviation is a biased estimator of the population standard deviation.
23.
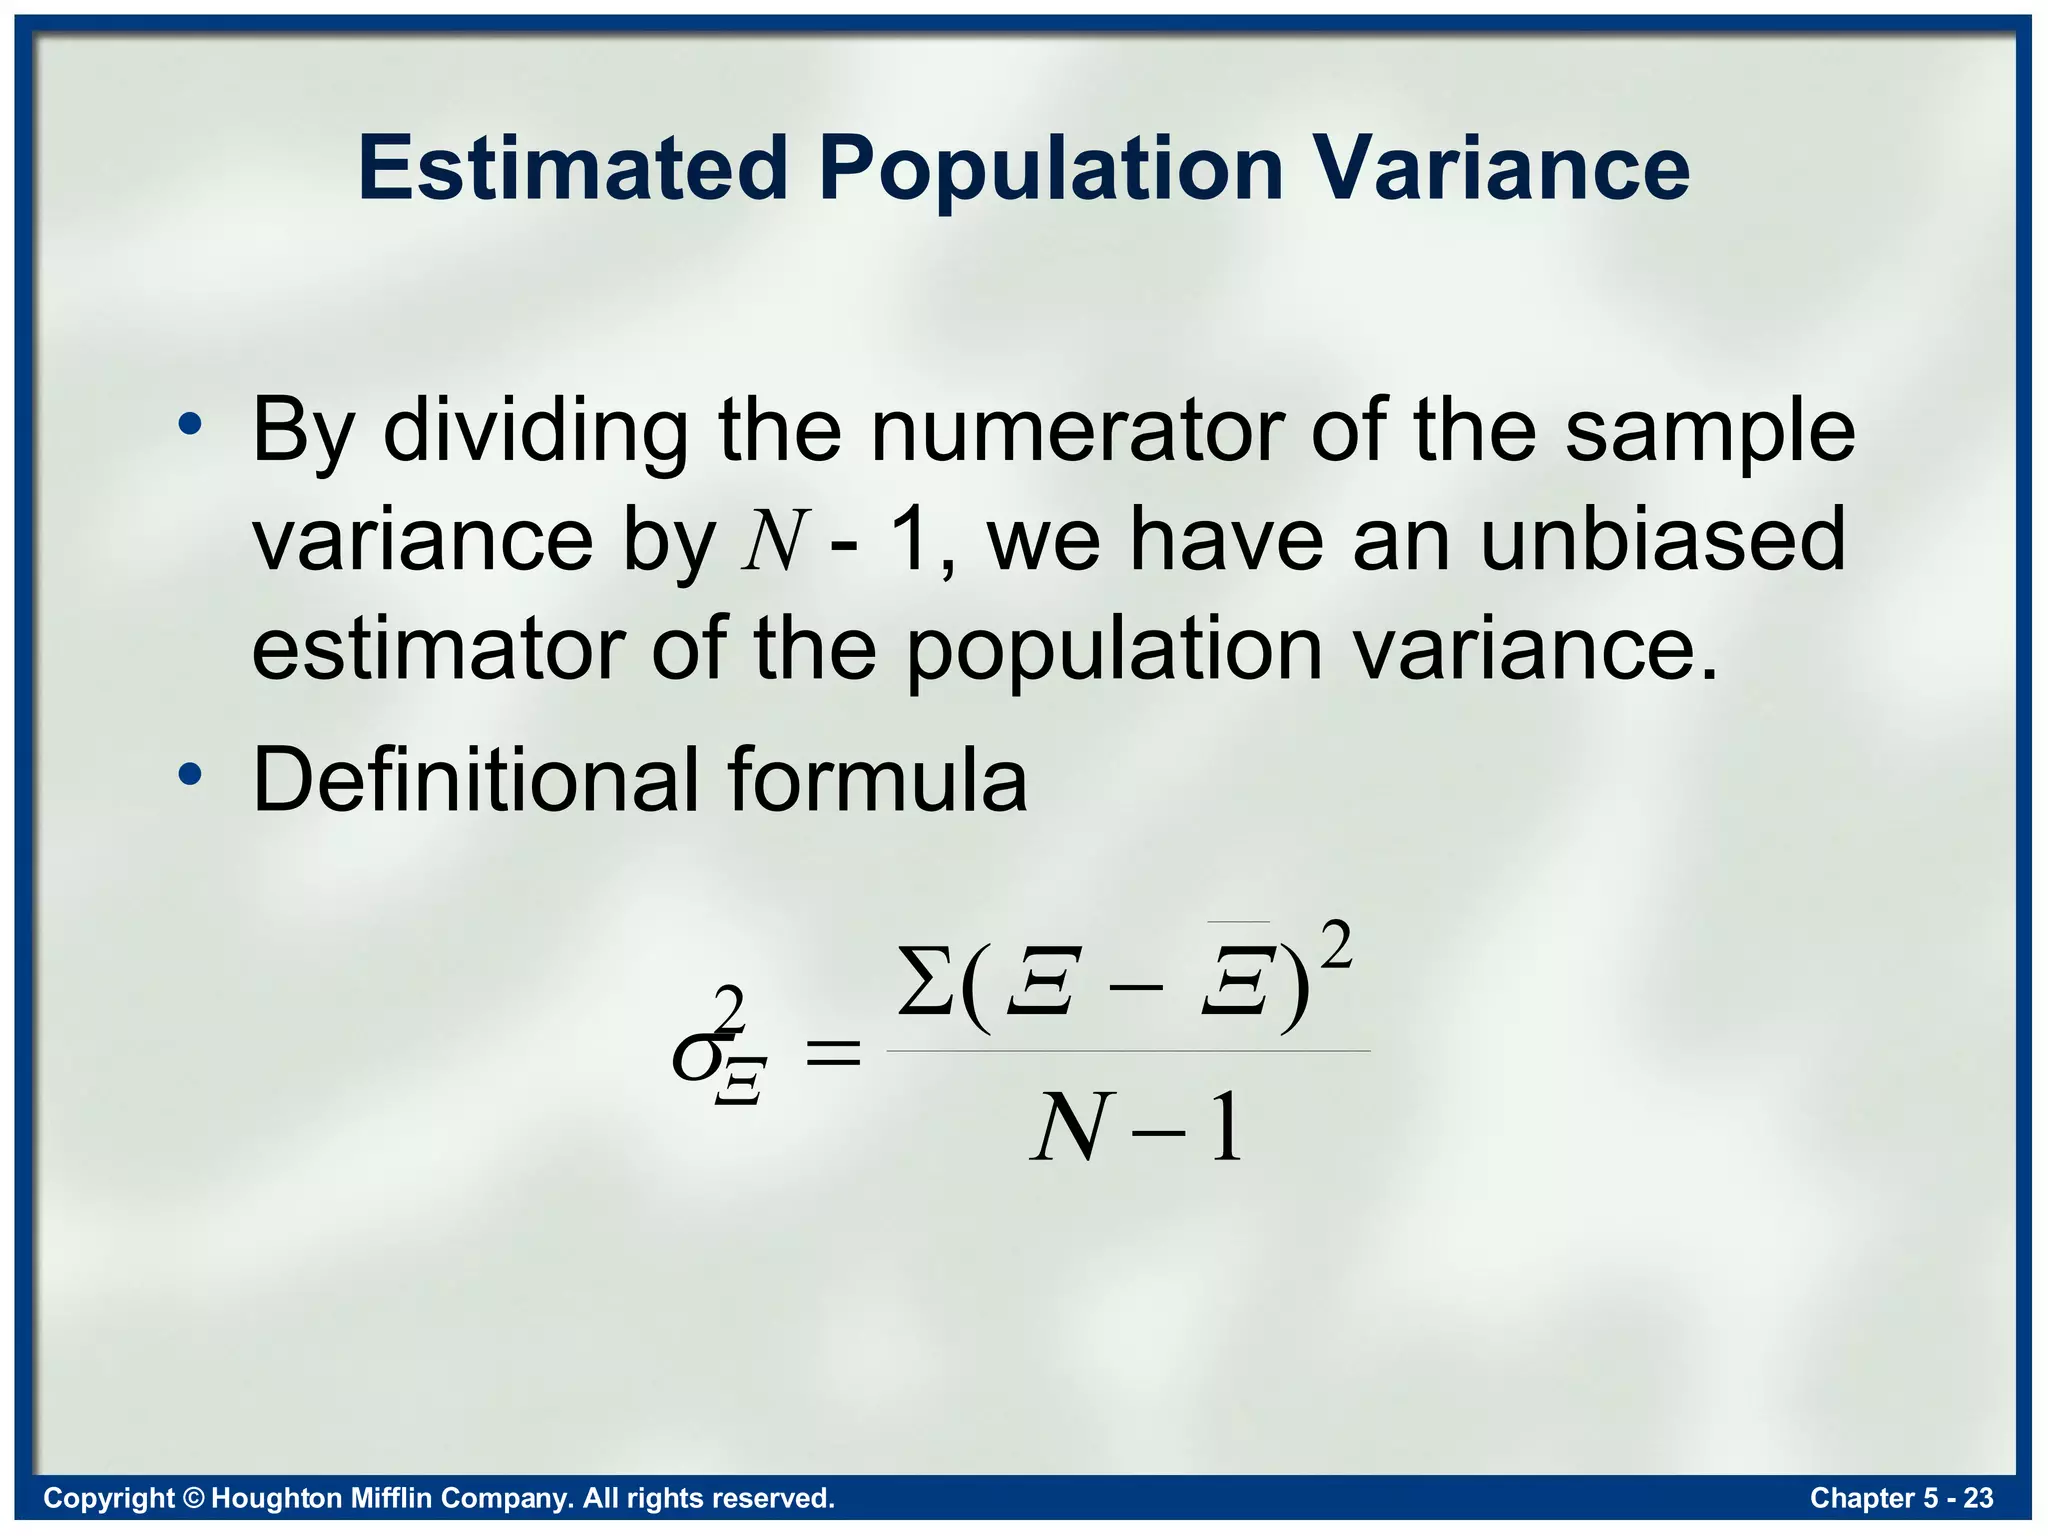
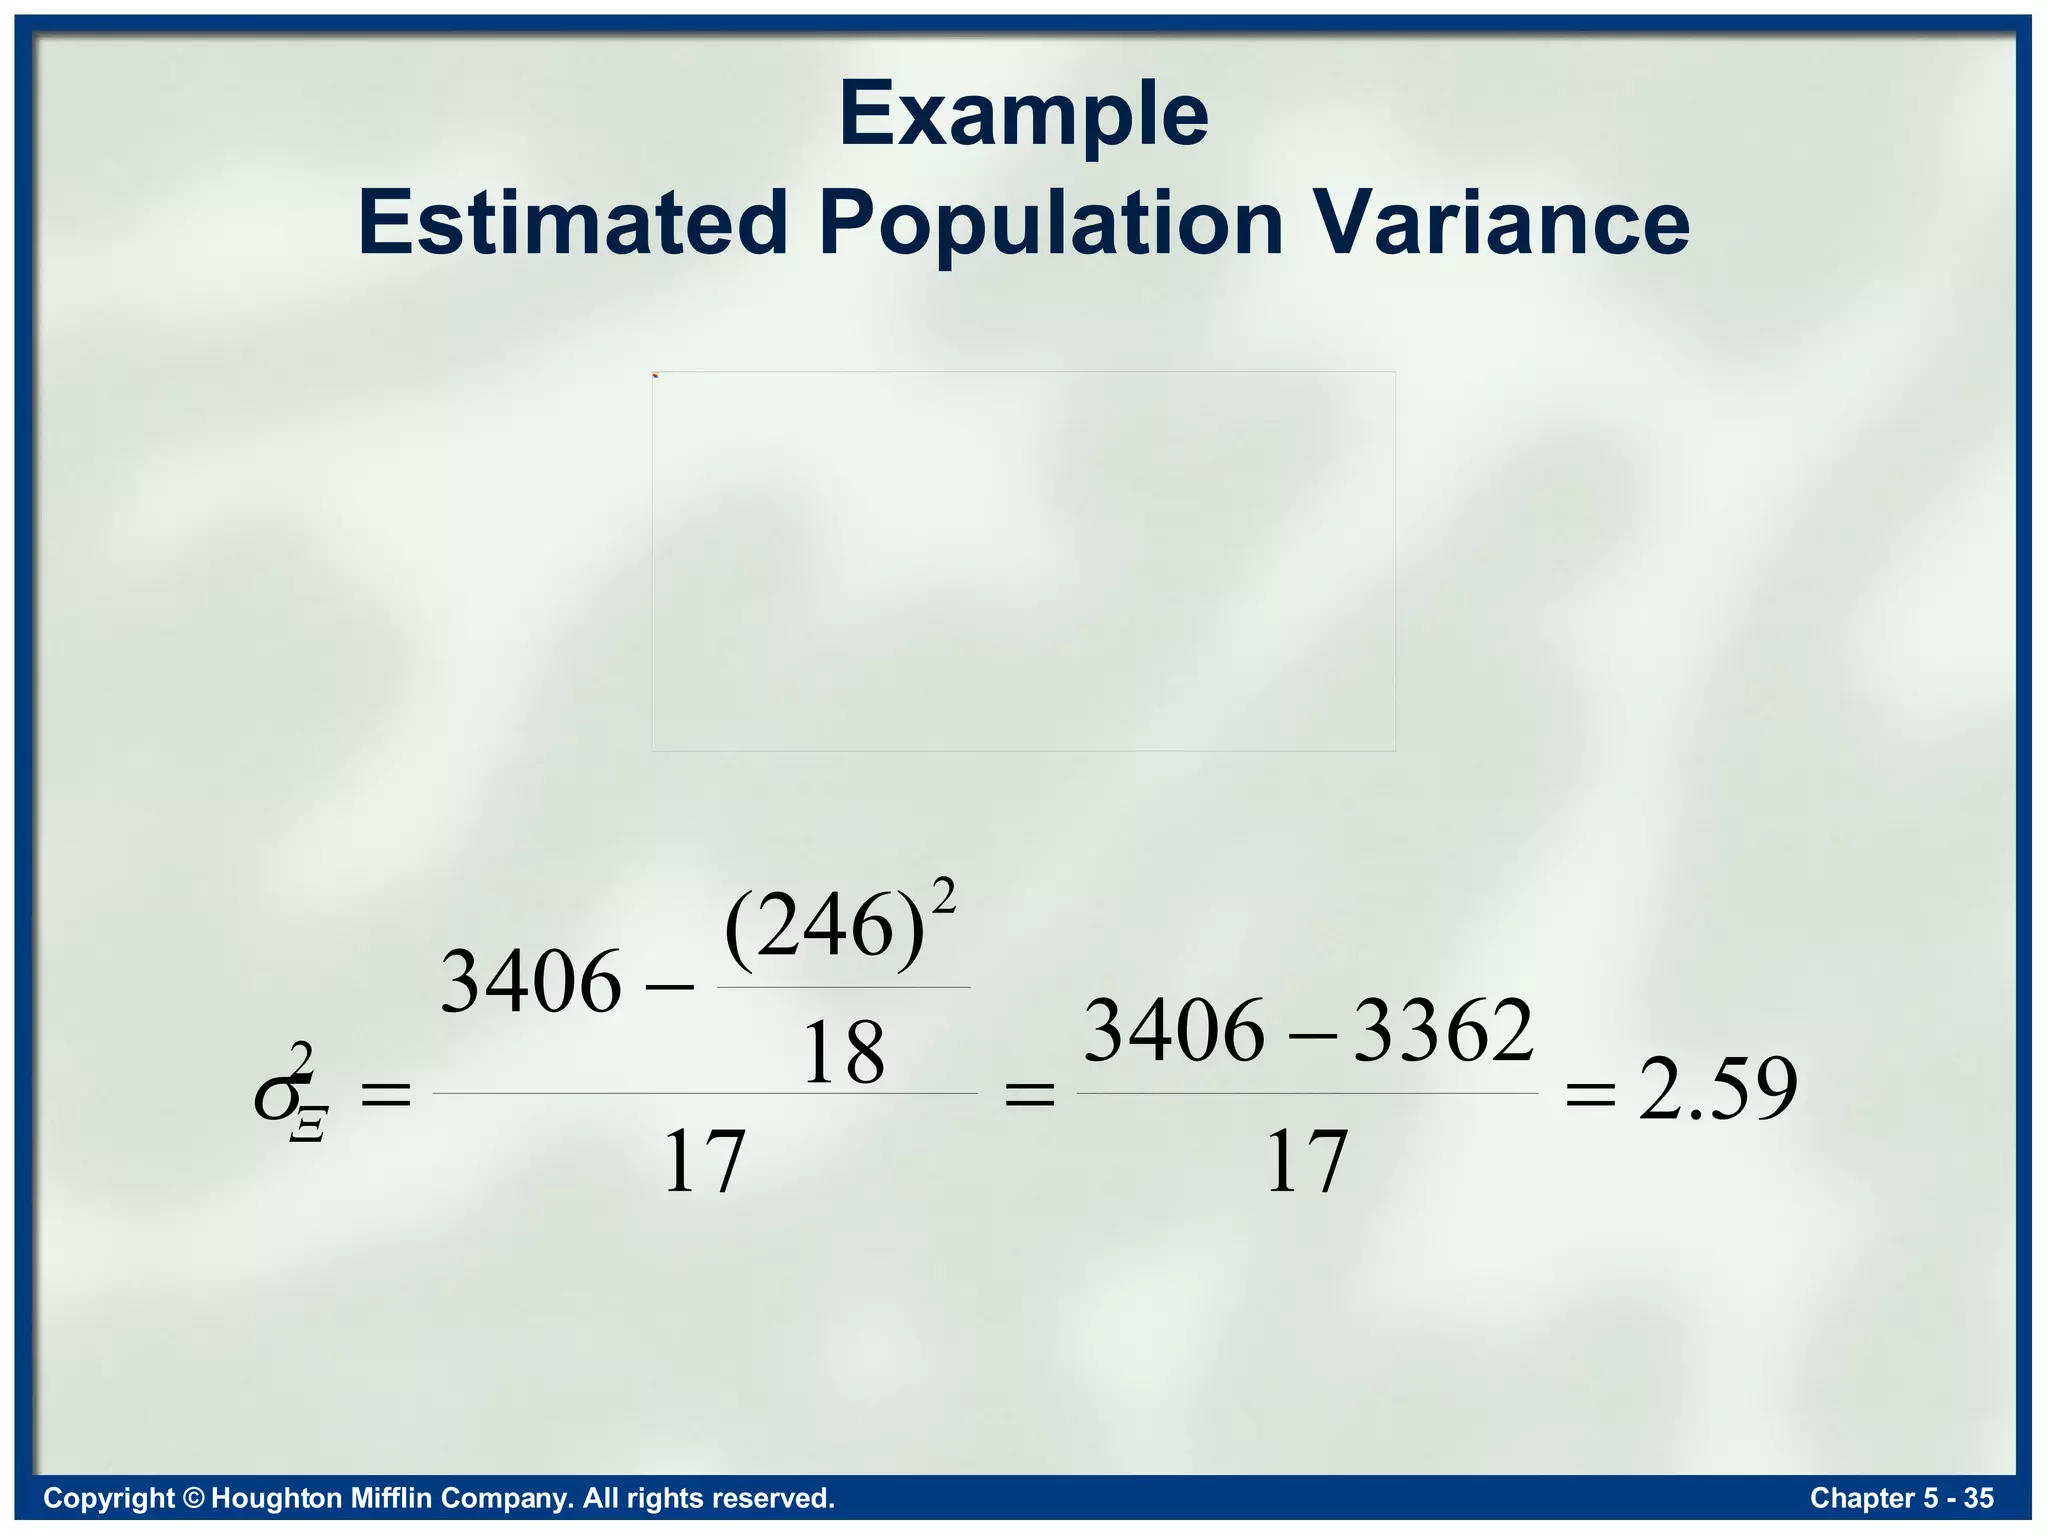
Estimated Population VarianceBy dividing the numerator of the sample variance by N - 1, we have an unbiased estimator of the population variance. Definitional formula
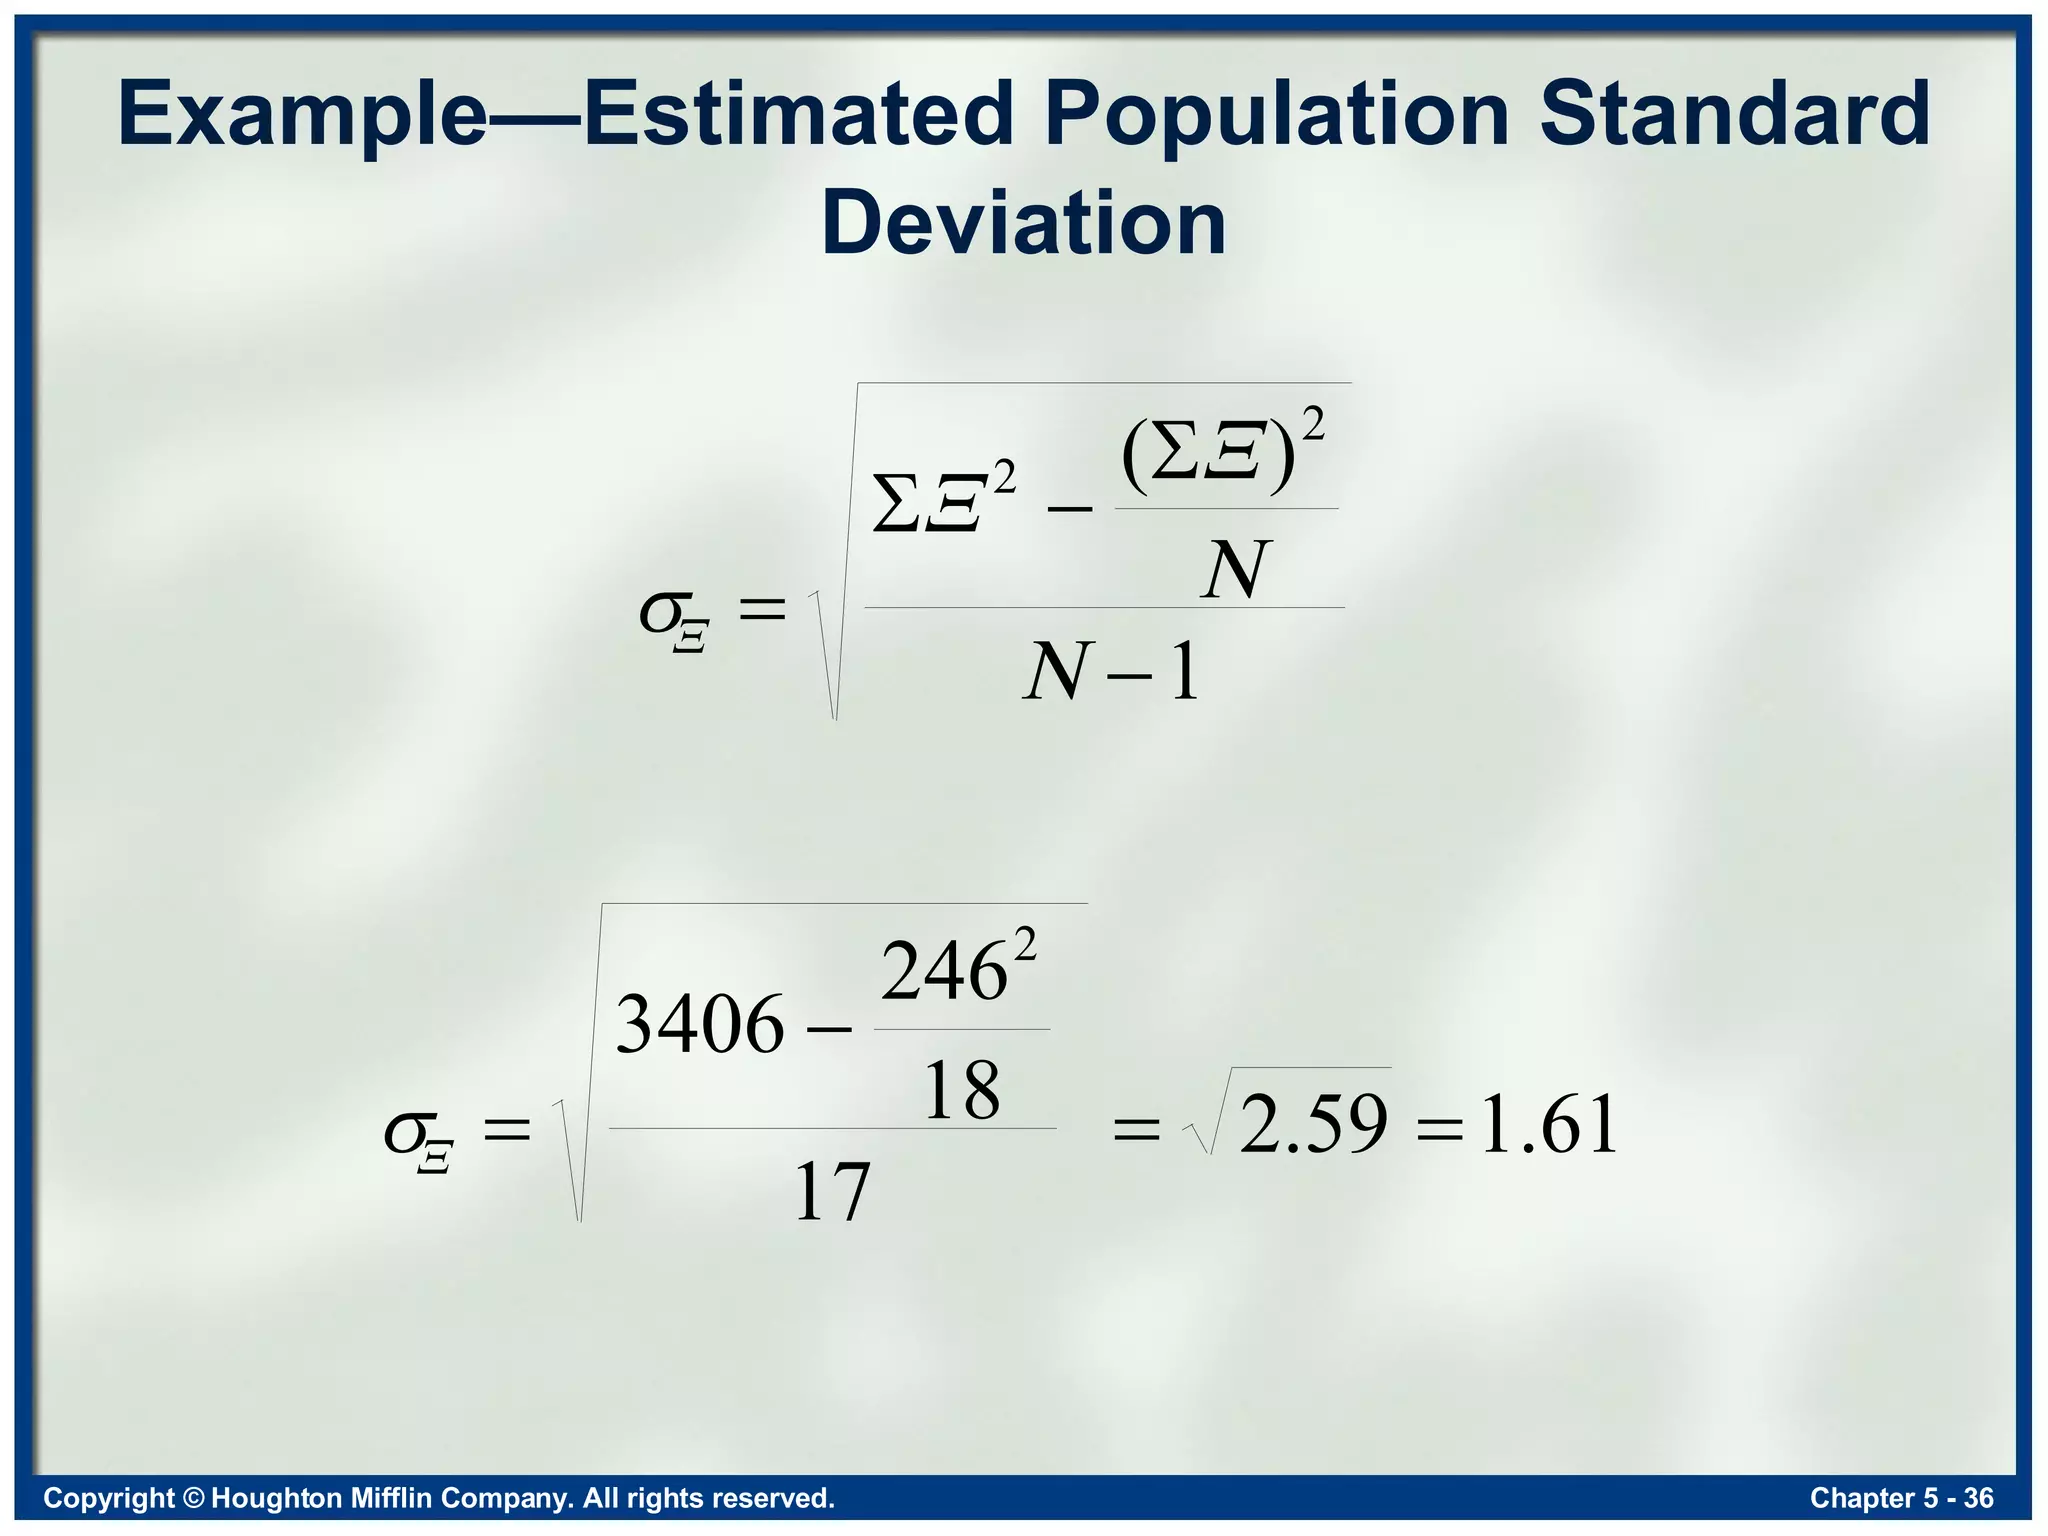
Estimated Population Standard Deviation By dividing the numerator of the sample standard deviation by N - 1, we have an unbiased estimator of the population standard deviation. Definitional formula
Unbiased Estimators Thequantity N - 1 is called the degrees of freedom is an unbiased estimator of is an unbiased estimator of
28.
Uses of , , , and Use the sample variance and the sample standard deviation to describe the variability of a sample. Use the estimated population variance and the estimated population standard deviation for inferential purposes when you need to estimate the variability in the population.
Proportion of Variance Accounted For The proportion of variance accounted for is the proportion of error in our predictions when we use the overall mean to predict scores that is eliminated when we use the relationship with another variable to predict scores
31.
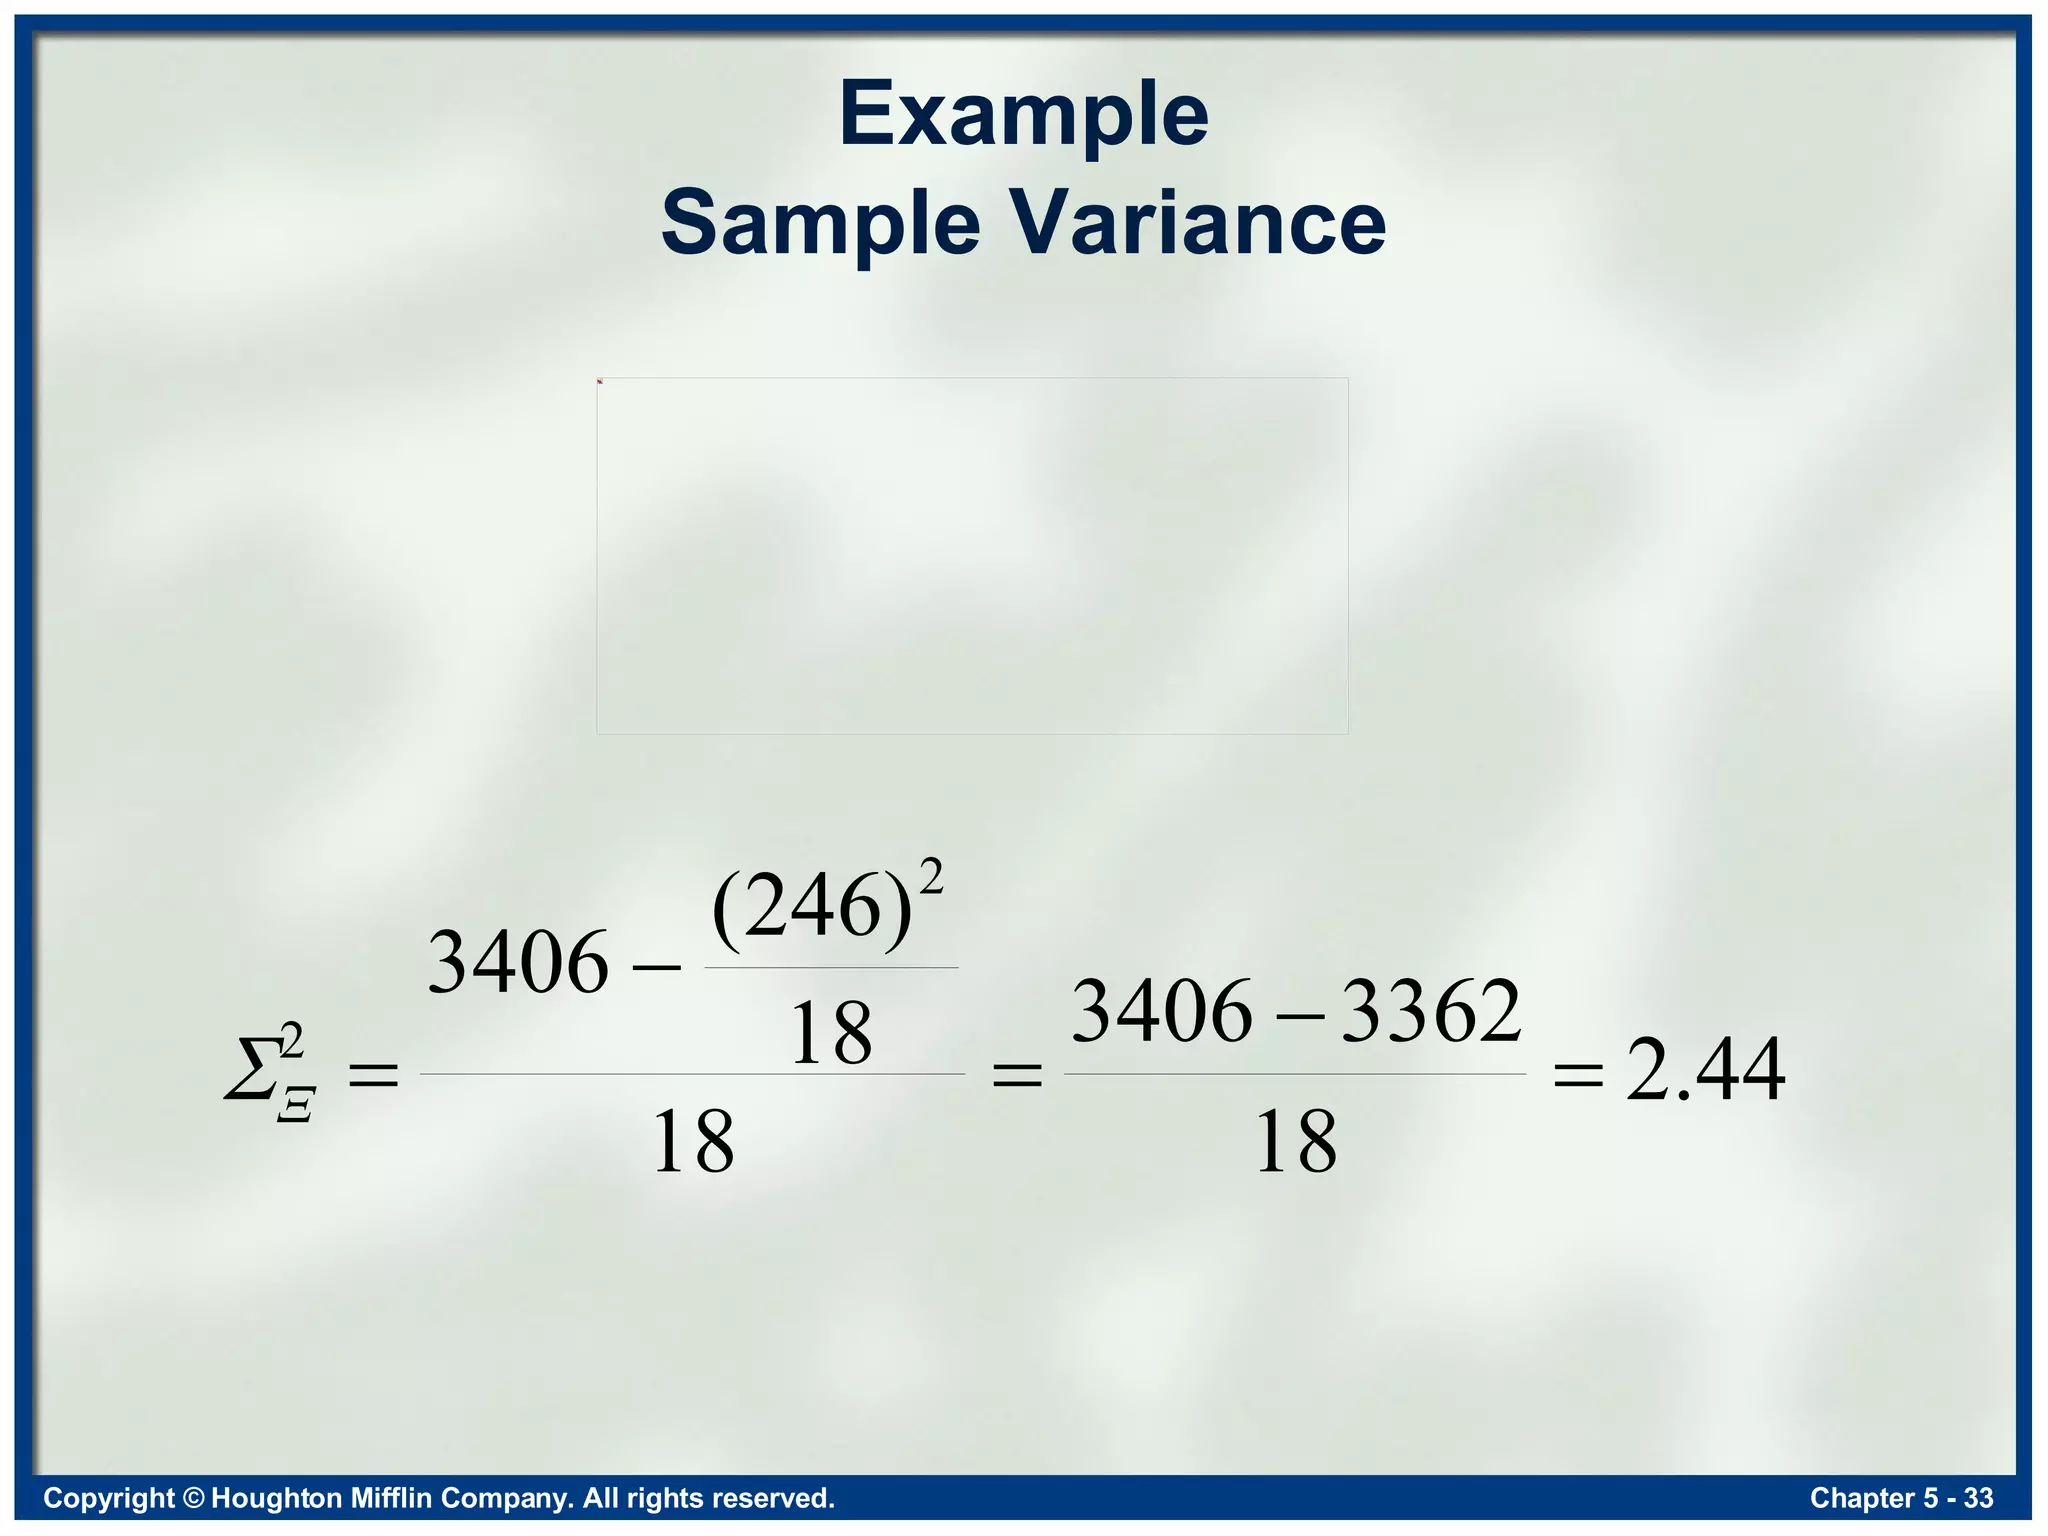
Example Using thefollowing data set, find The range, The sample variance and standard deviation, The estimated population variance and standard deviation 15 14 14 17 15 14 13 14 13 12 10 13 15 11 15 13 14 14
32.
Example Range Therange is the largest value minus the smallest value.