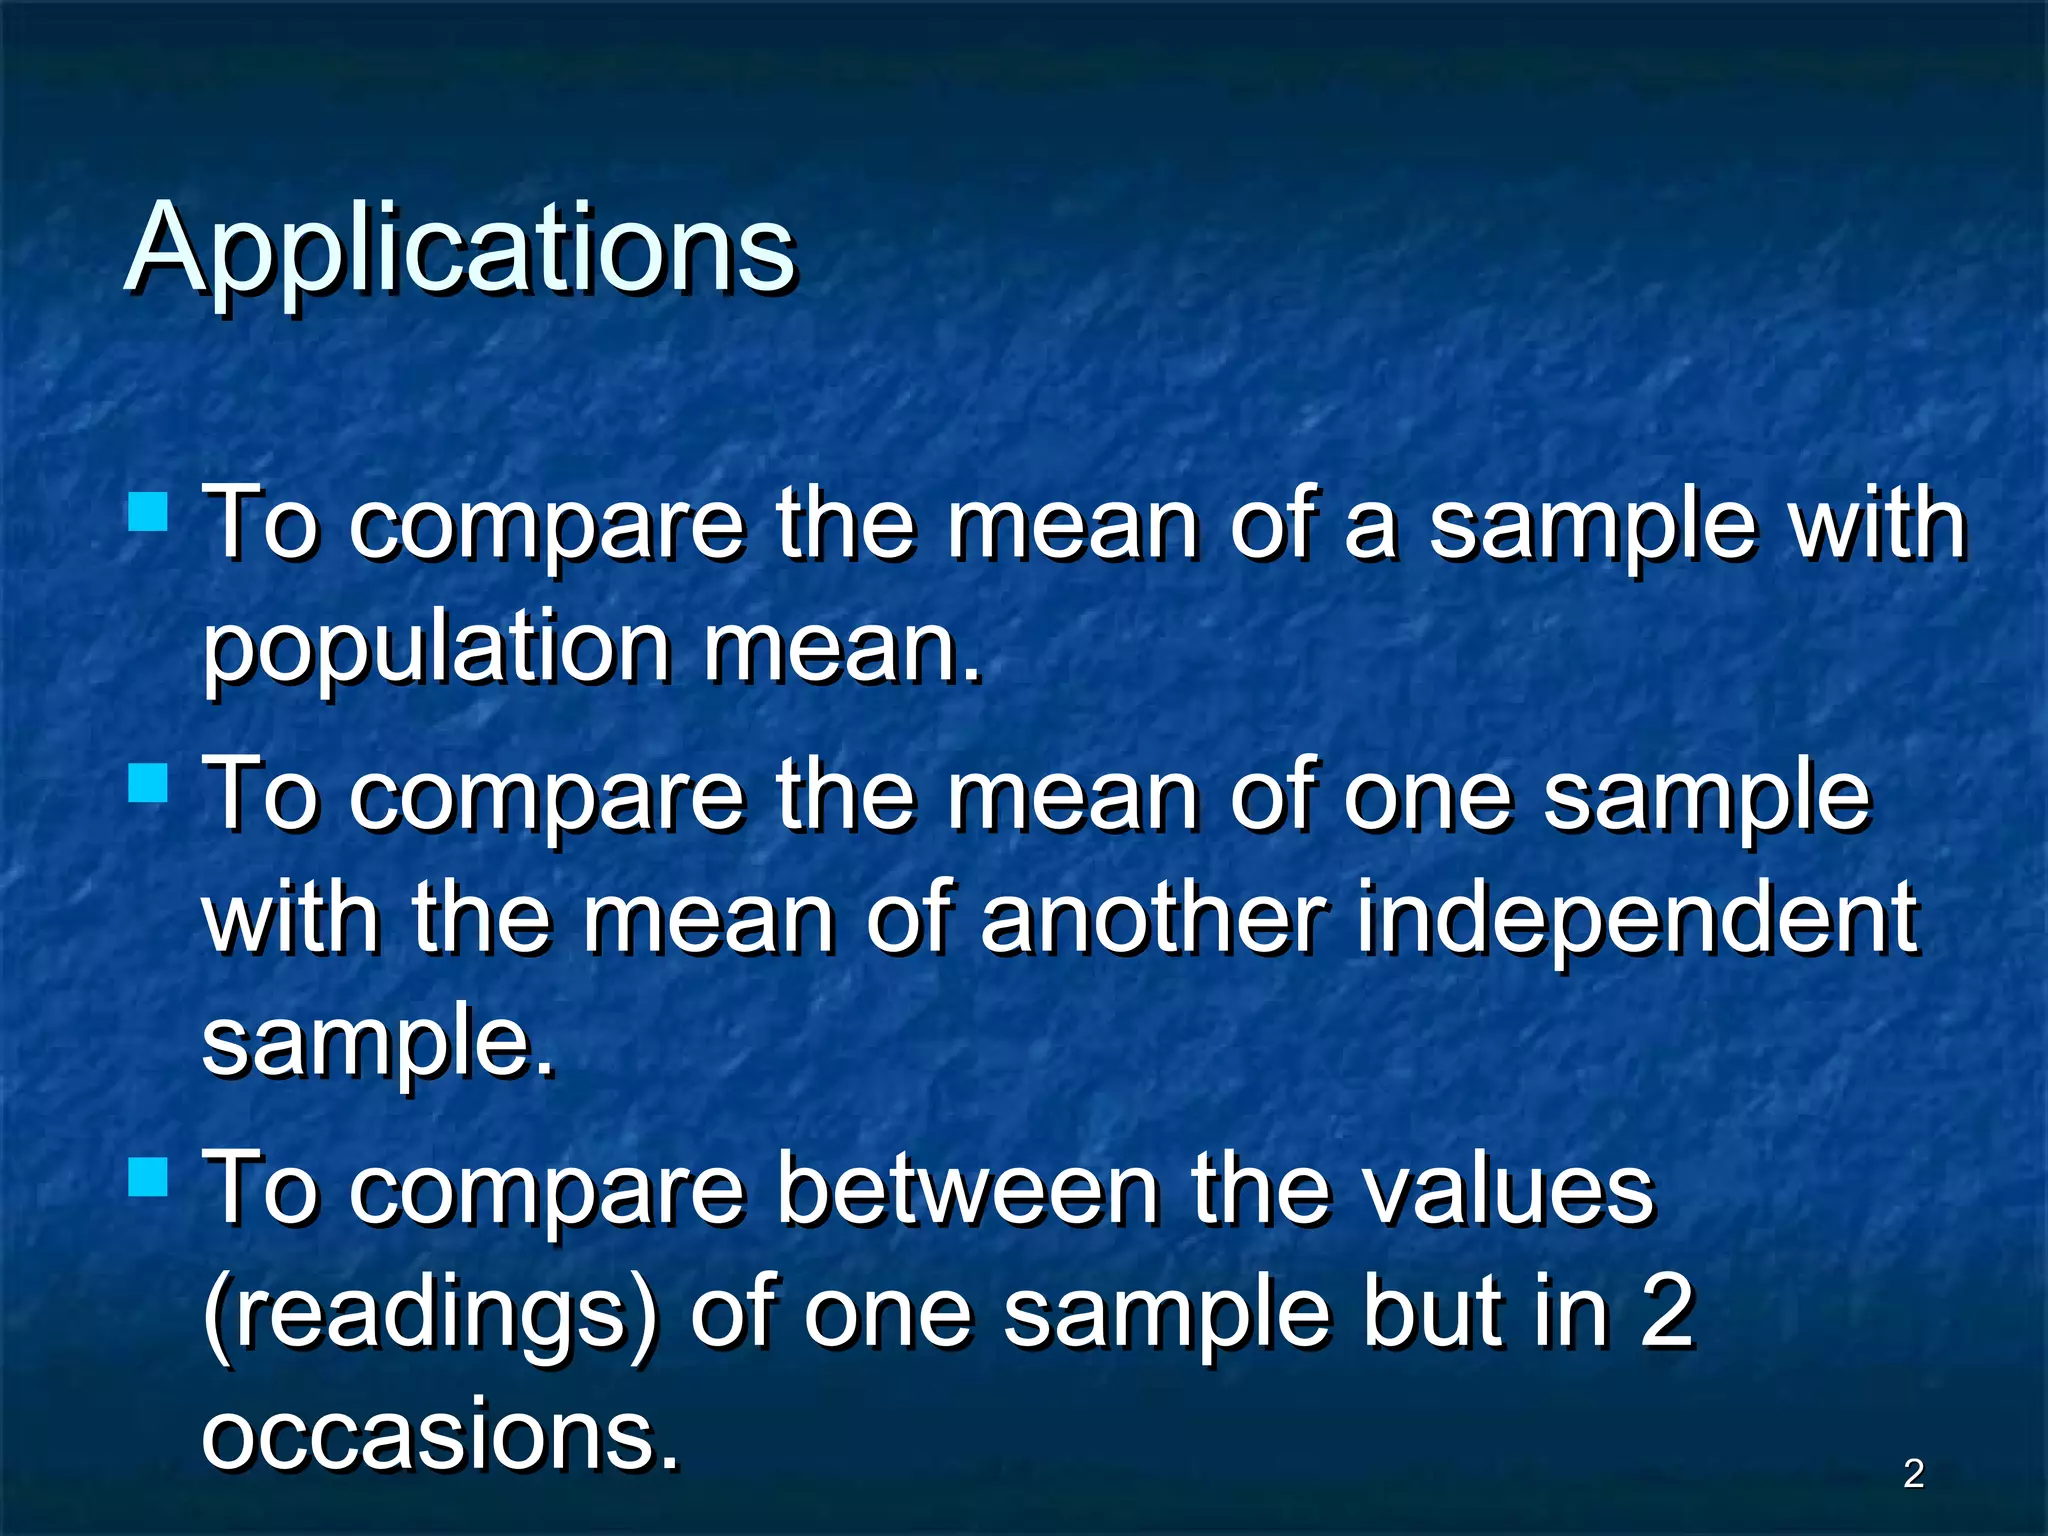
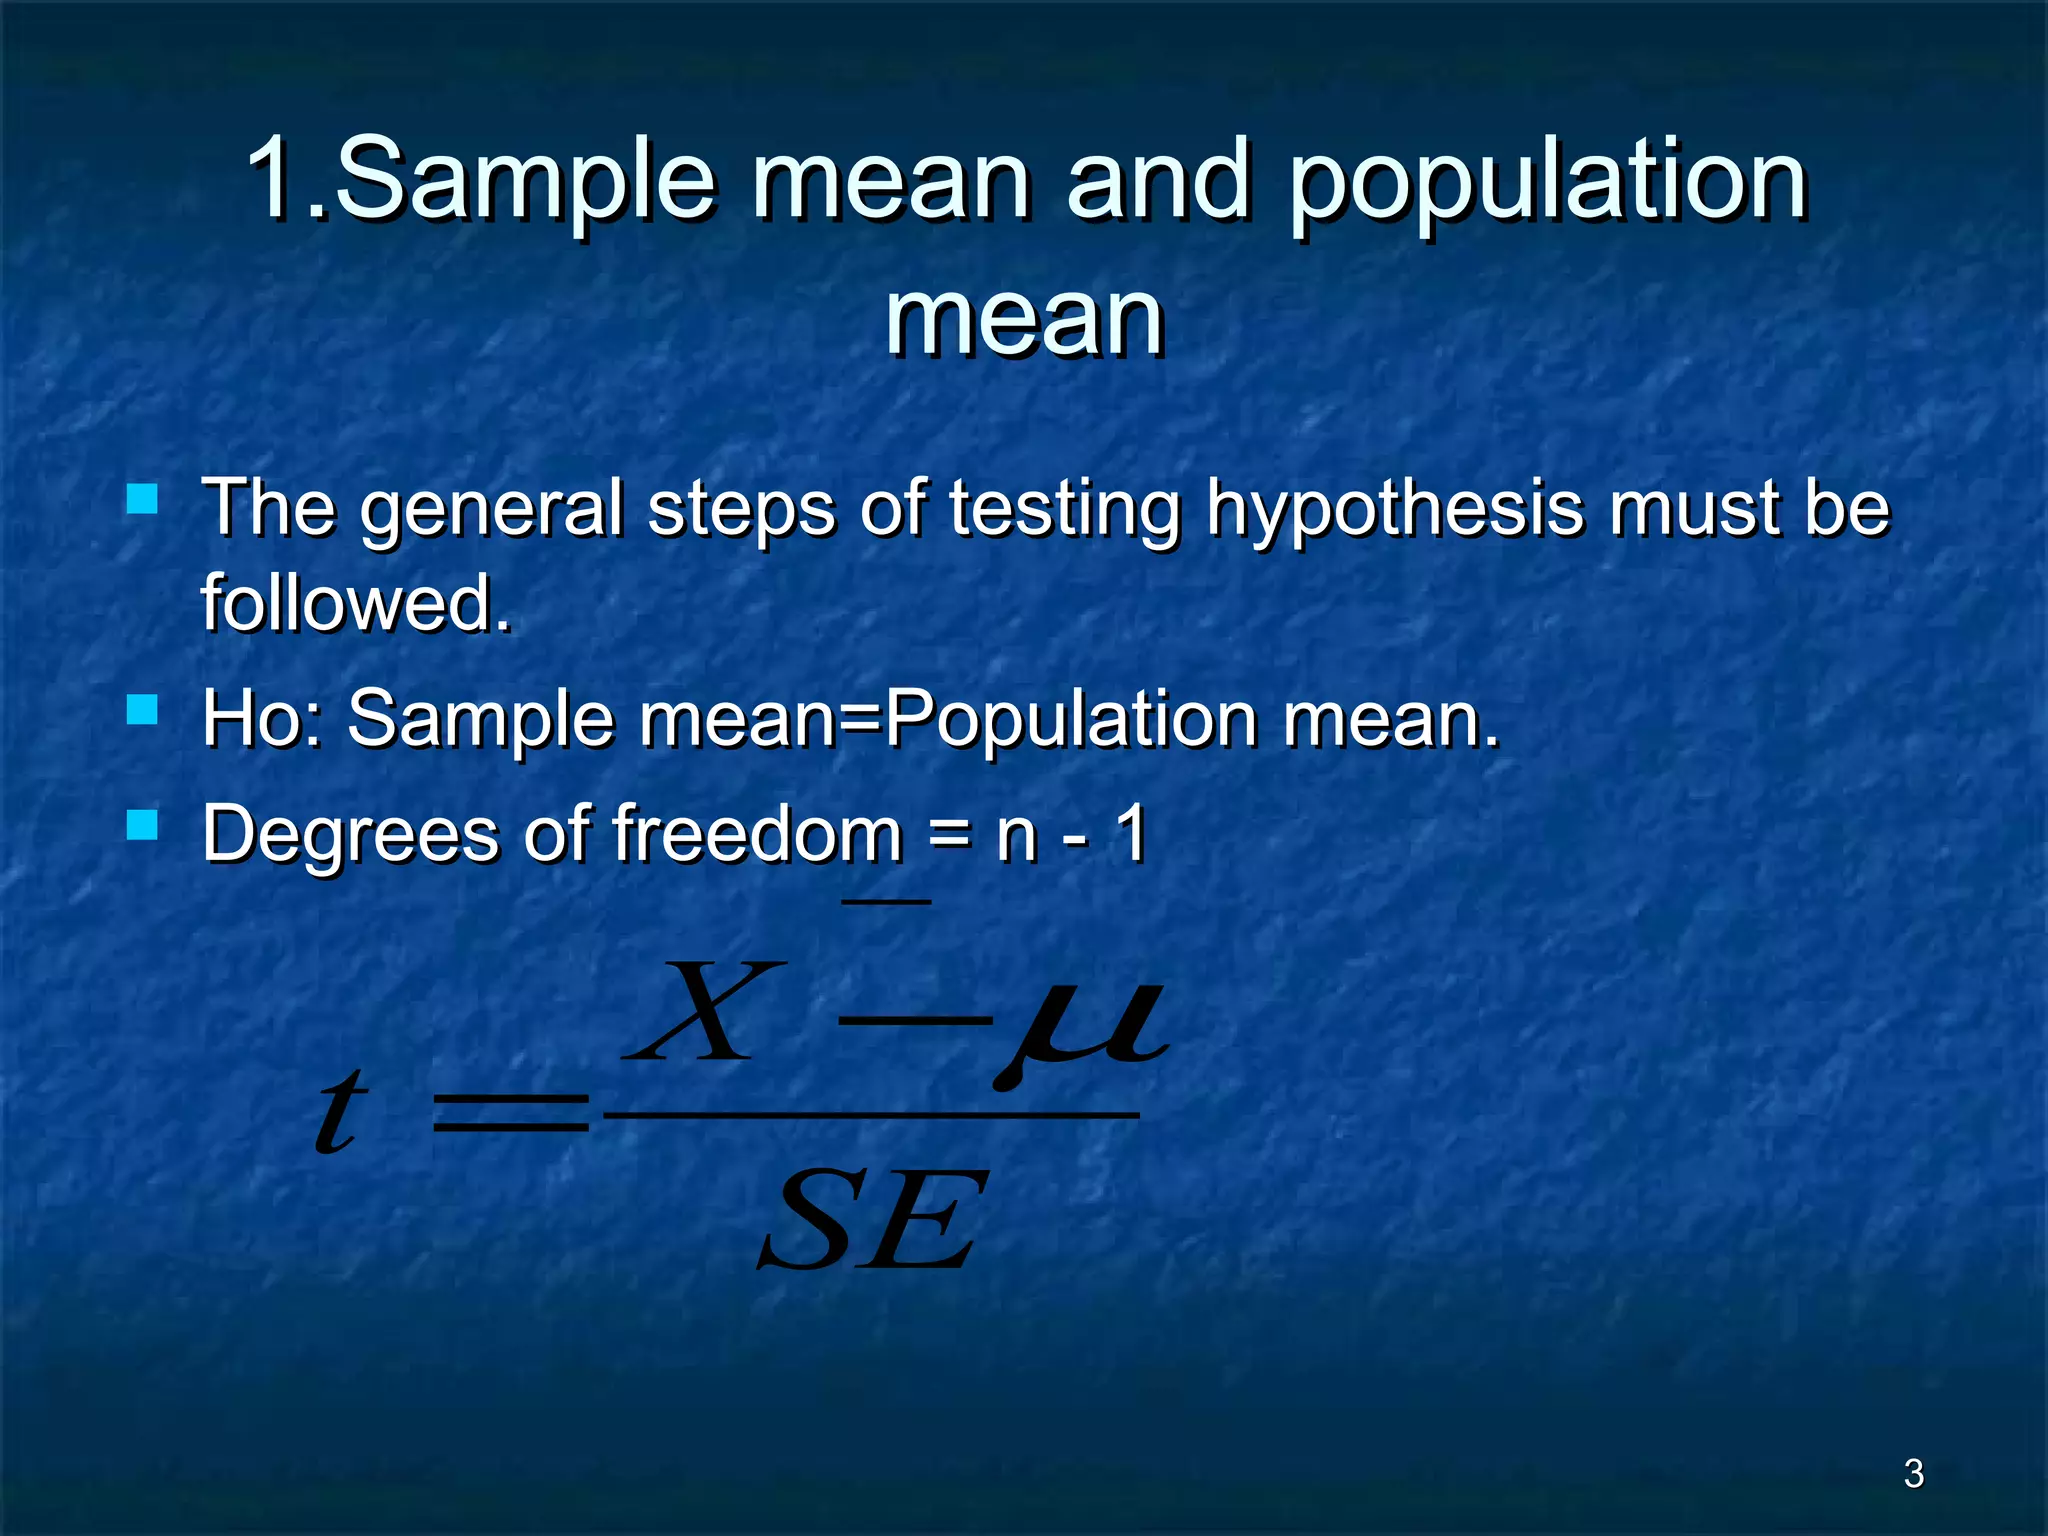
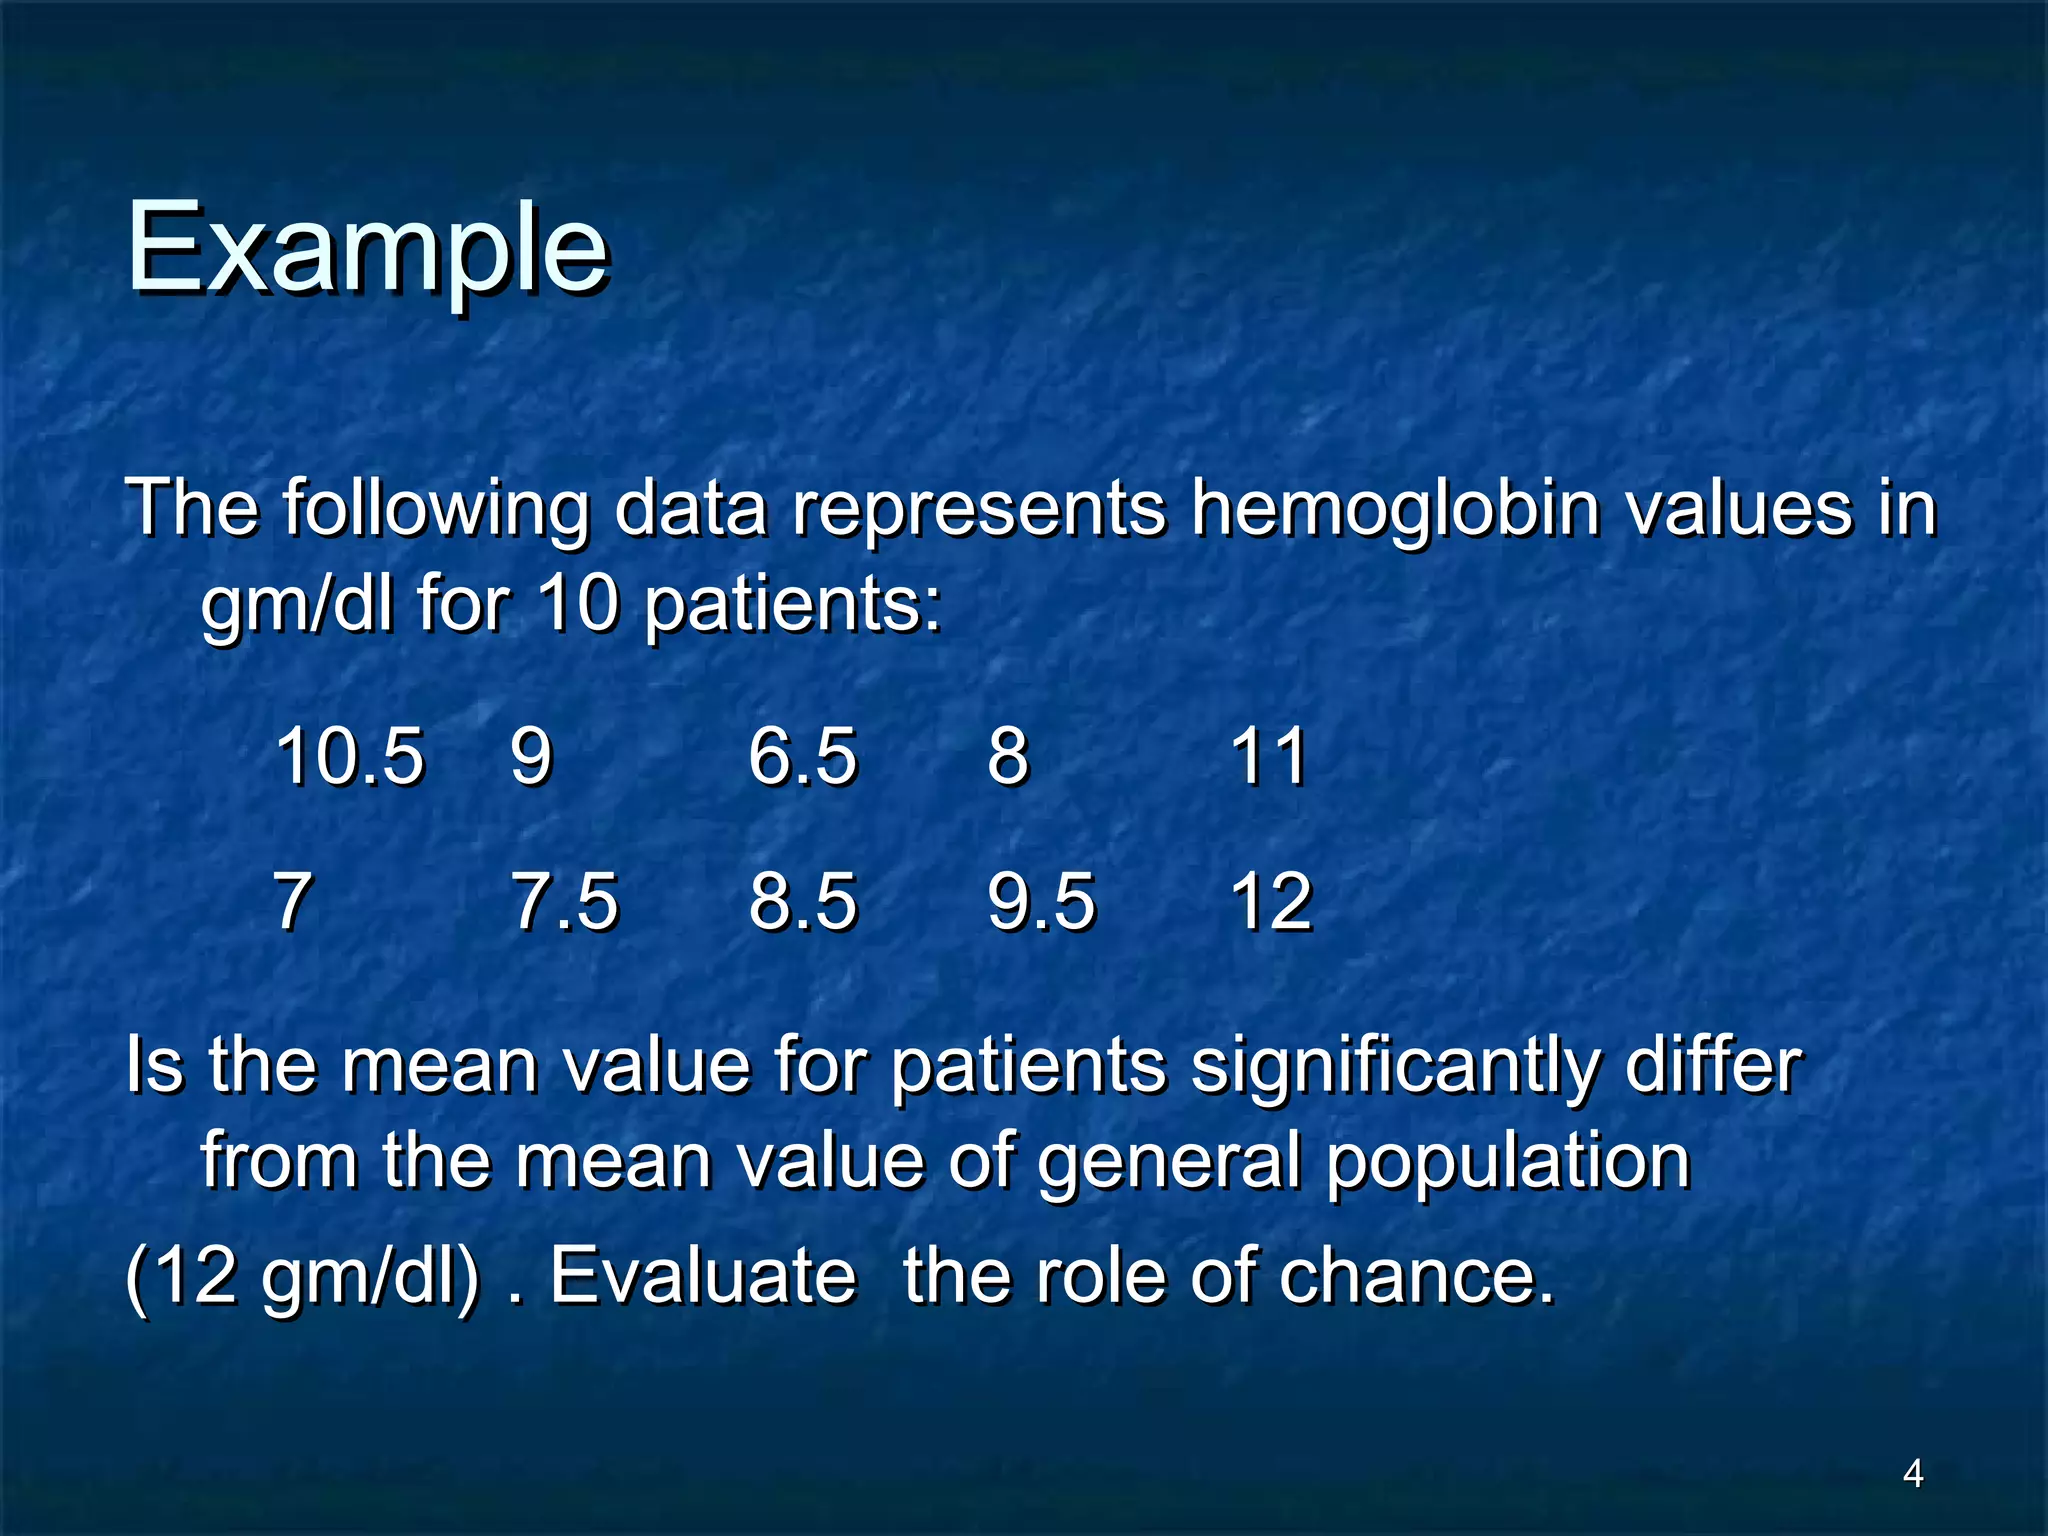
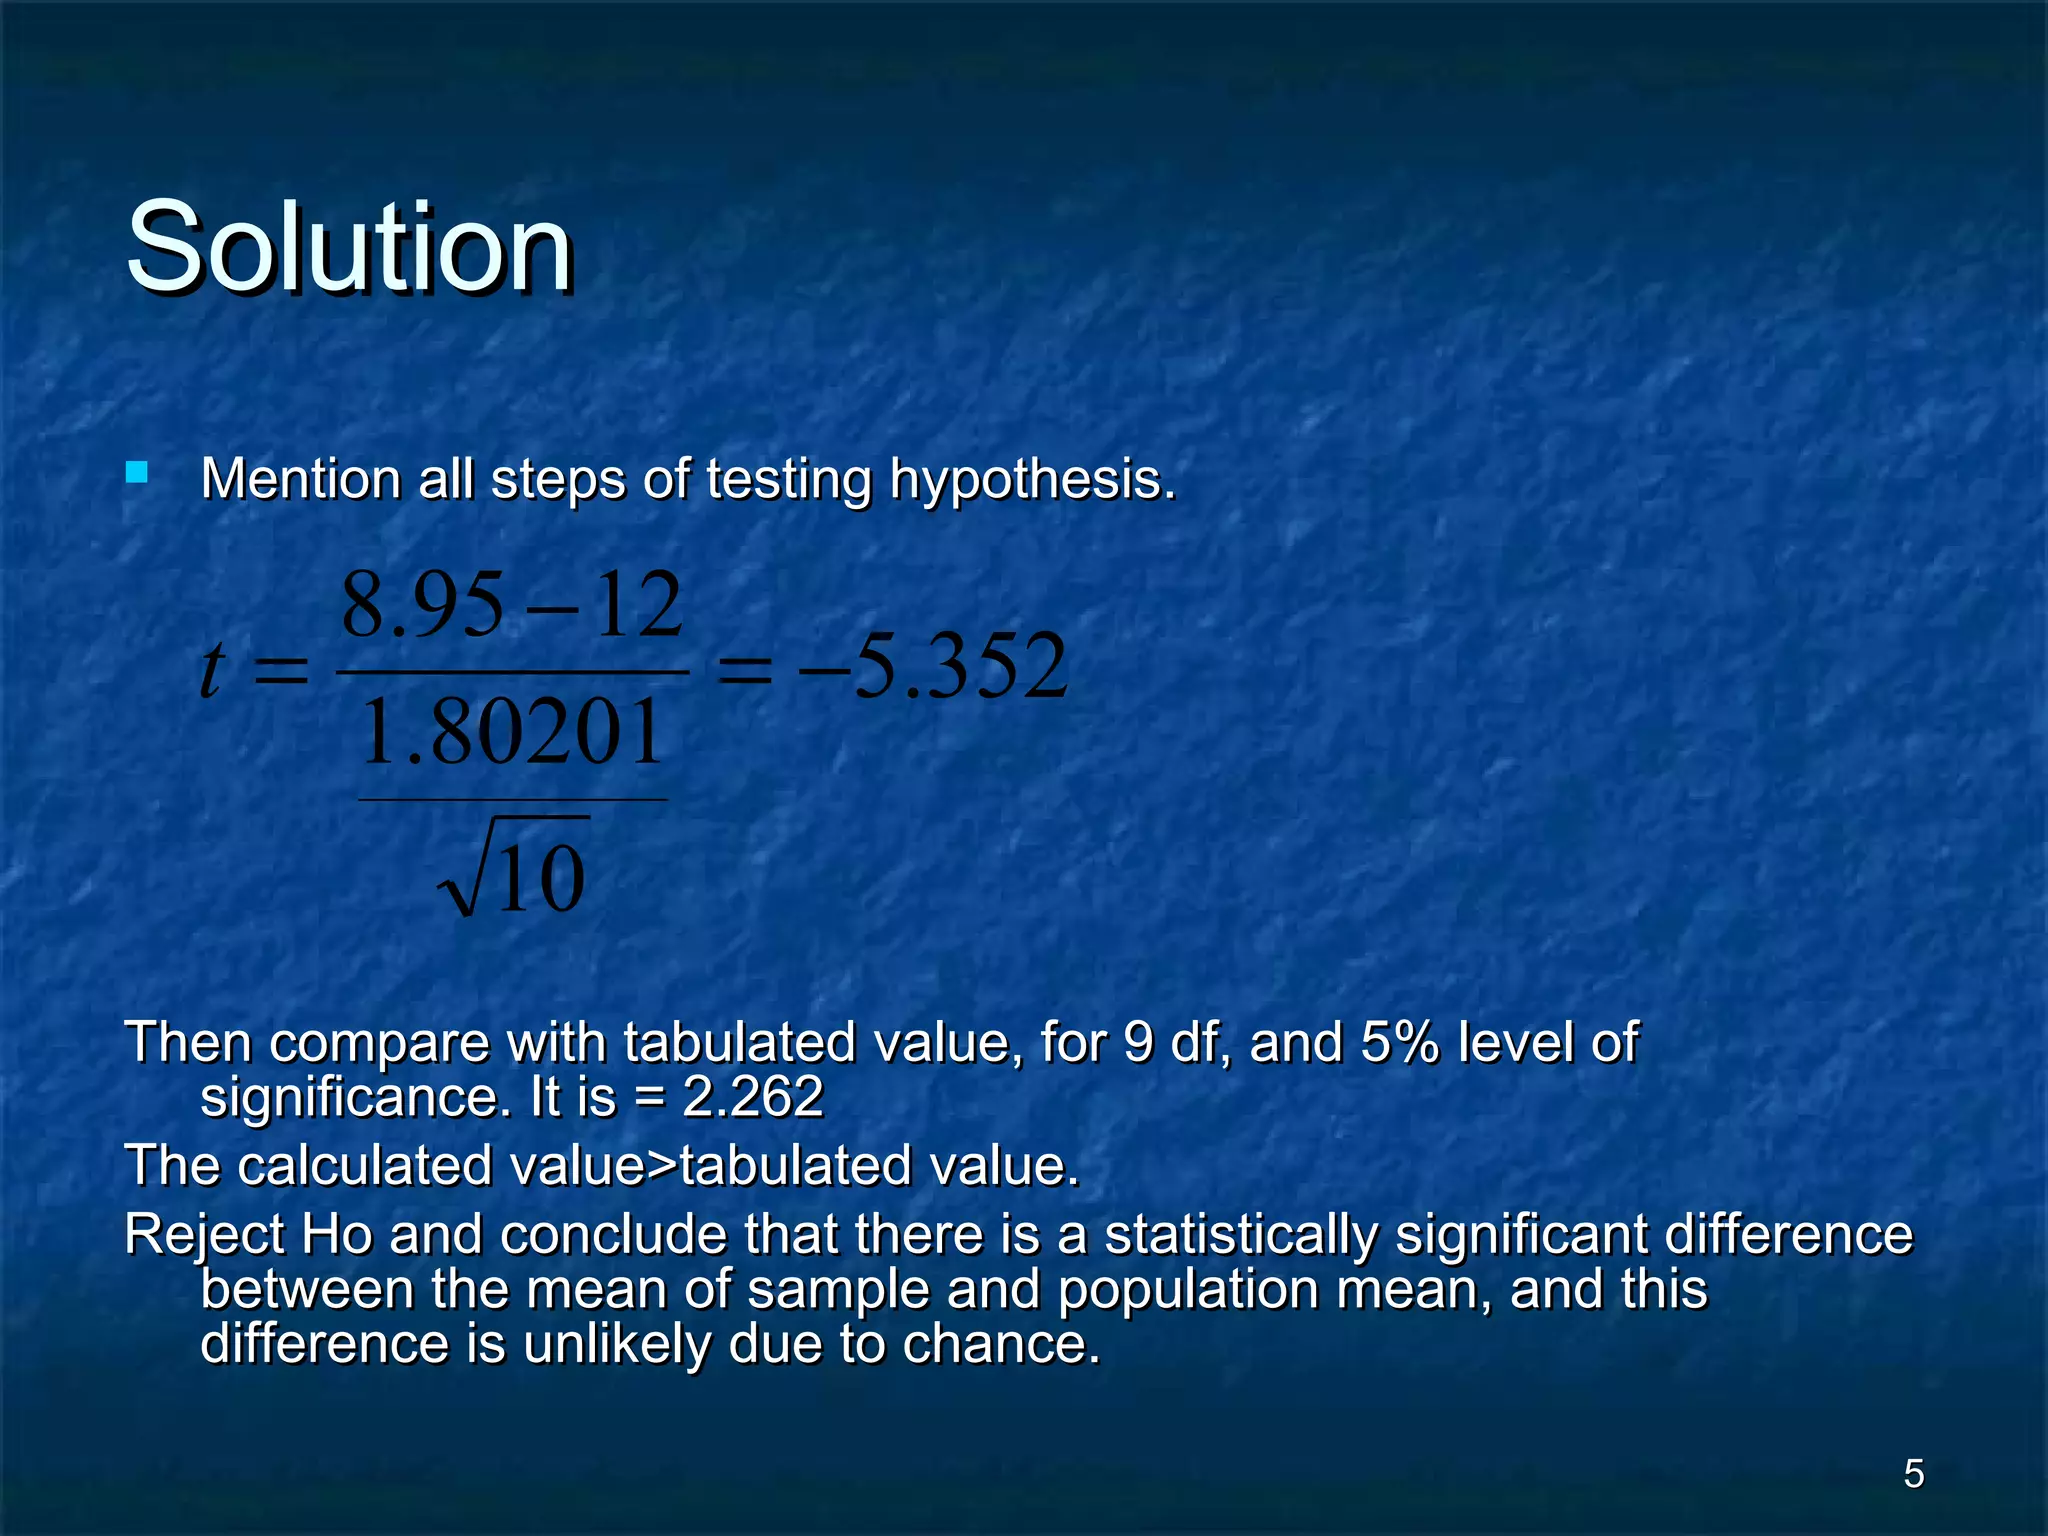
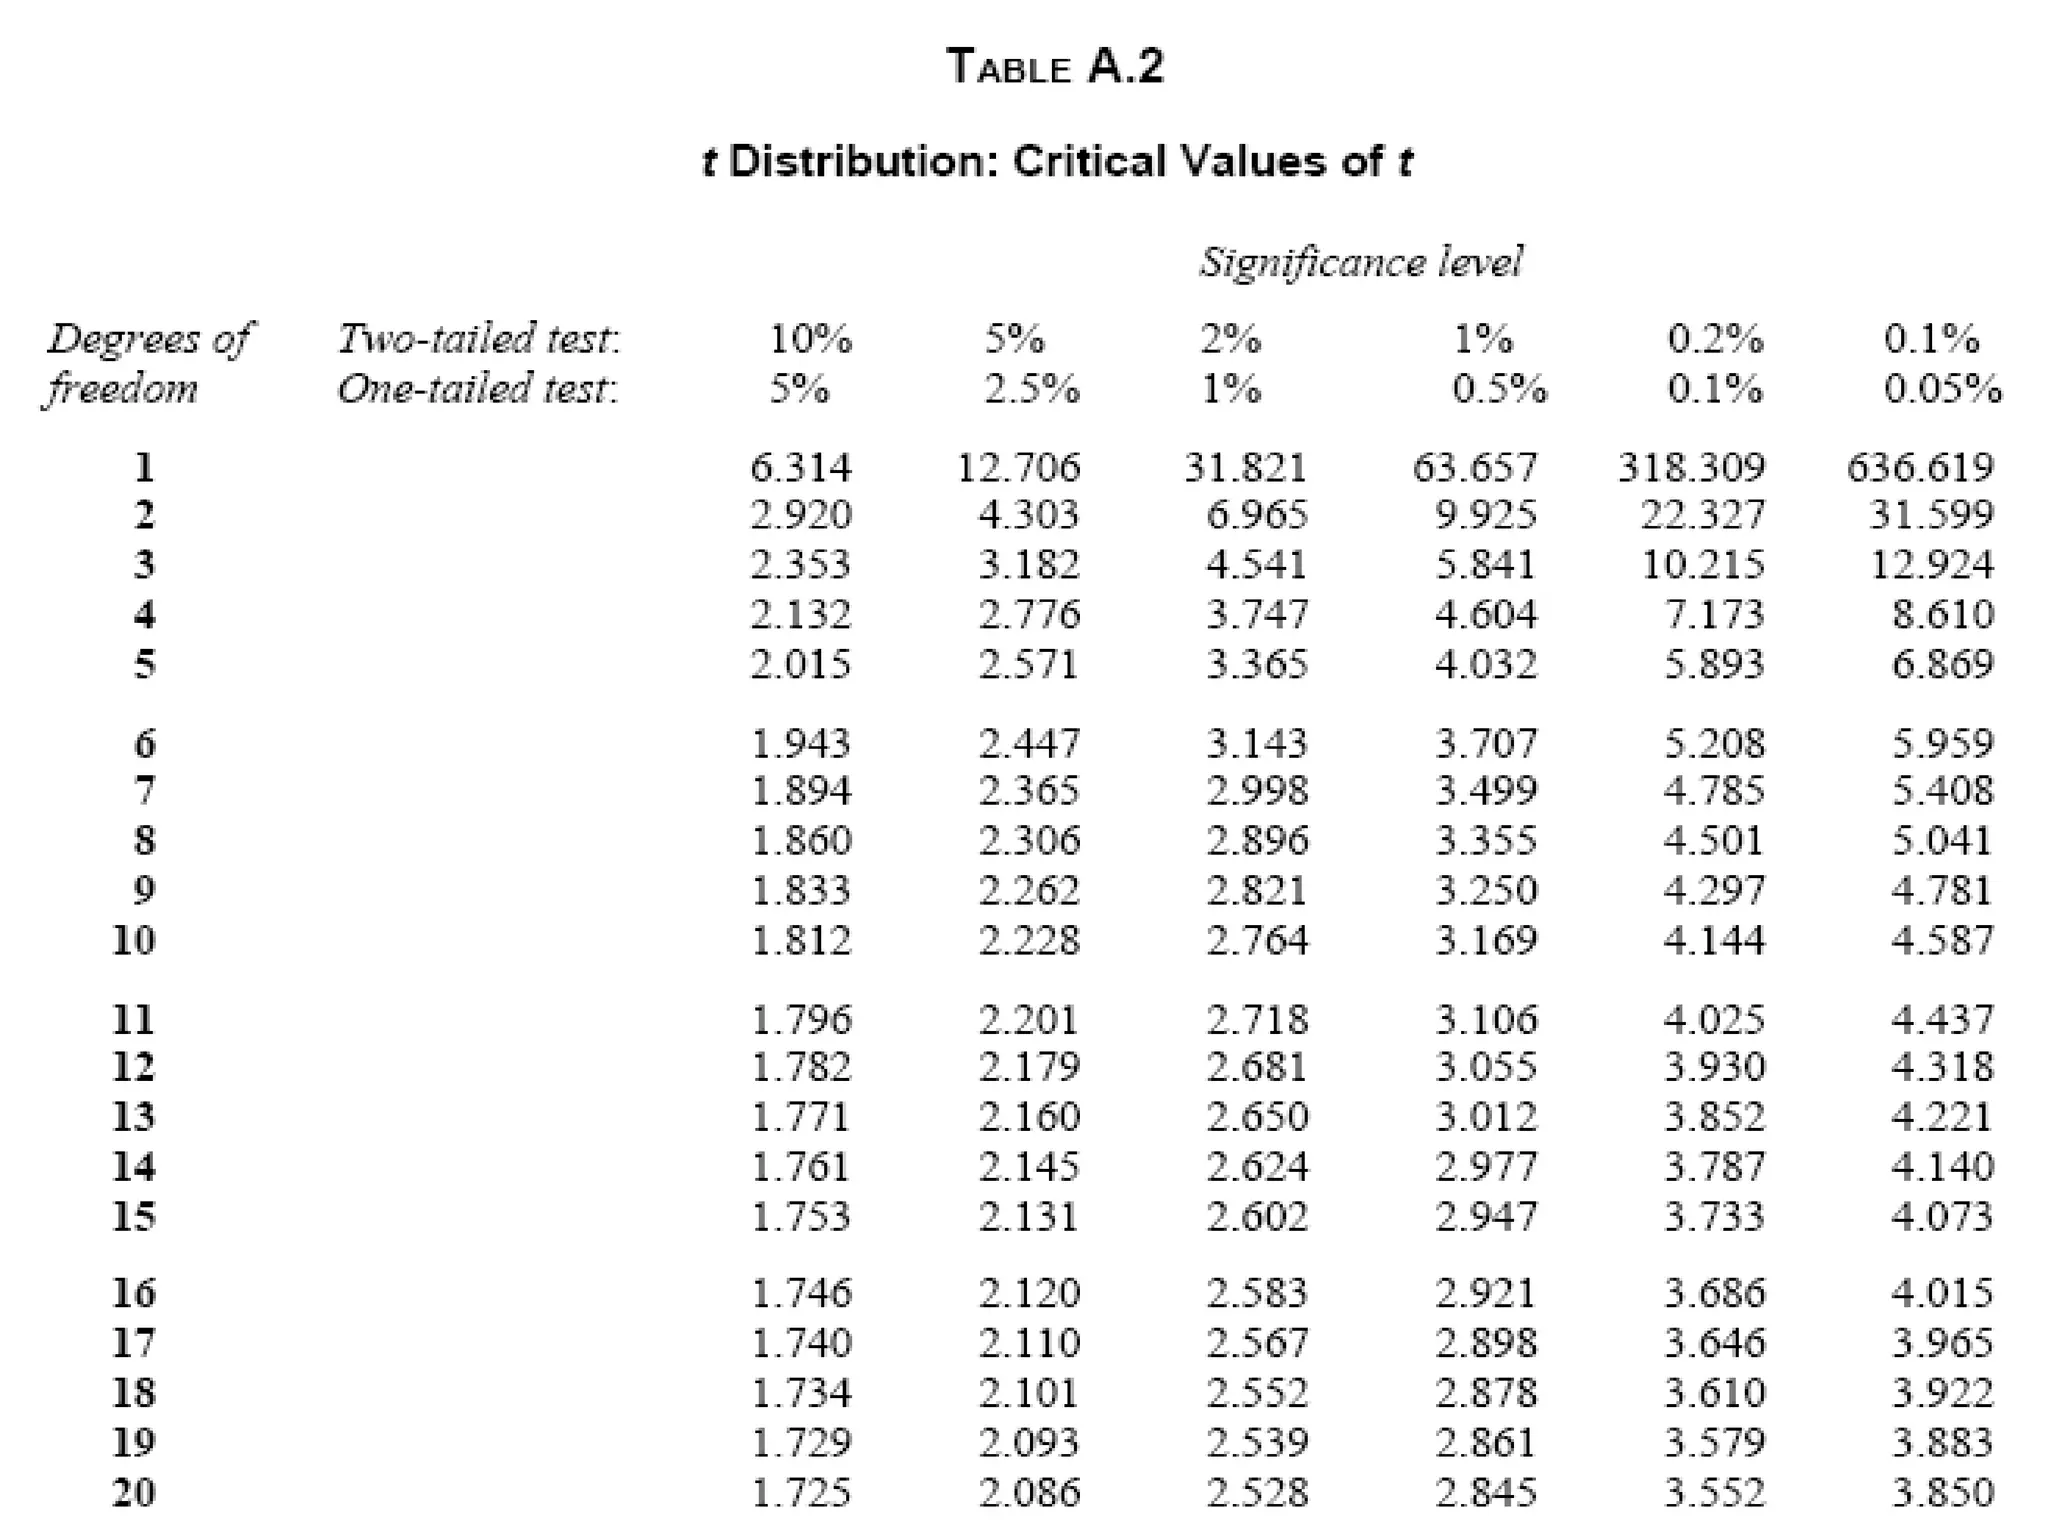
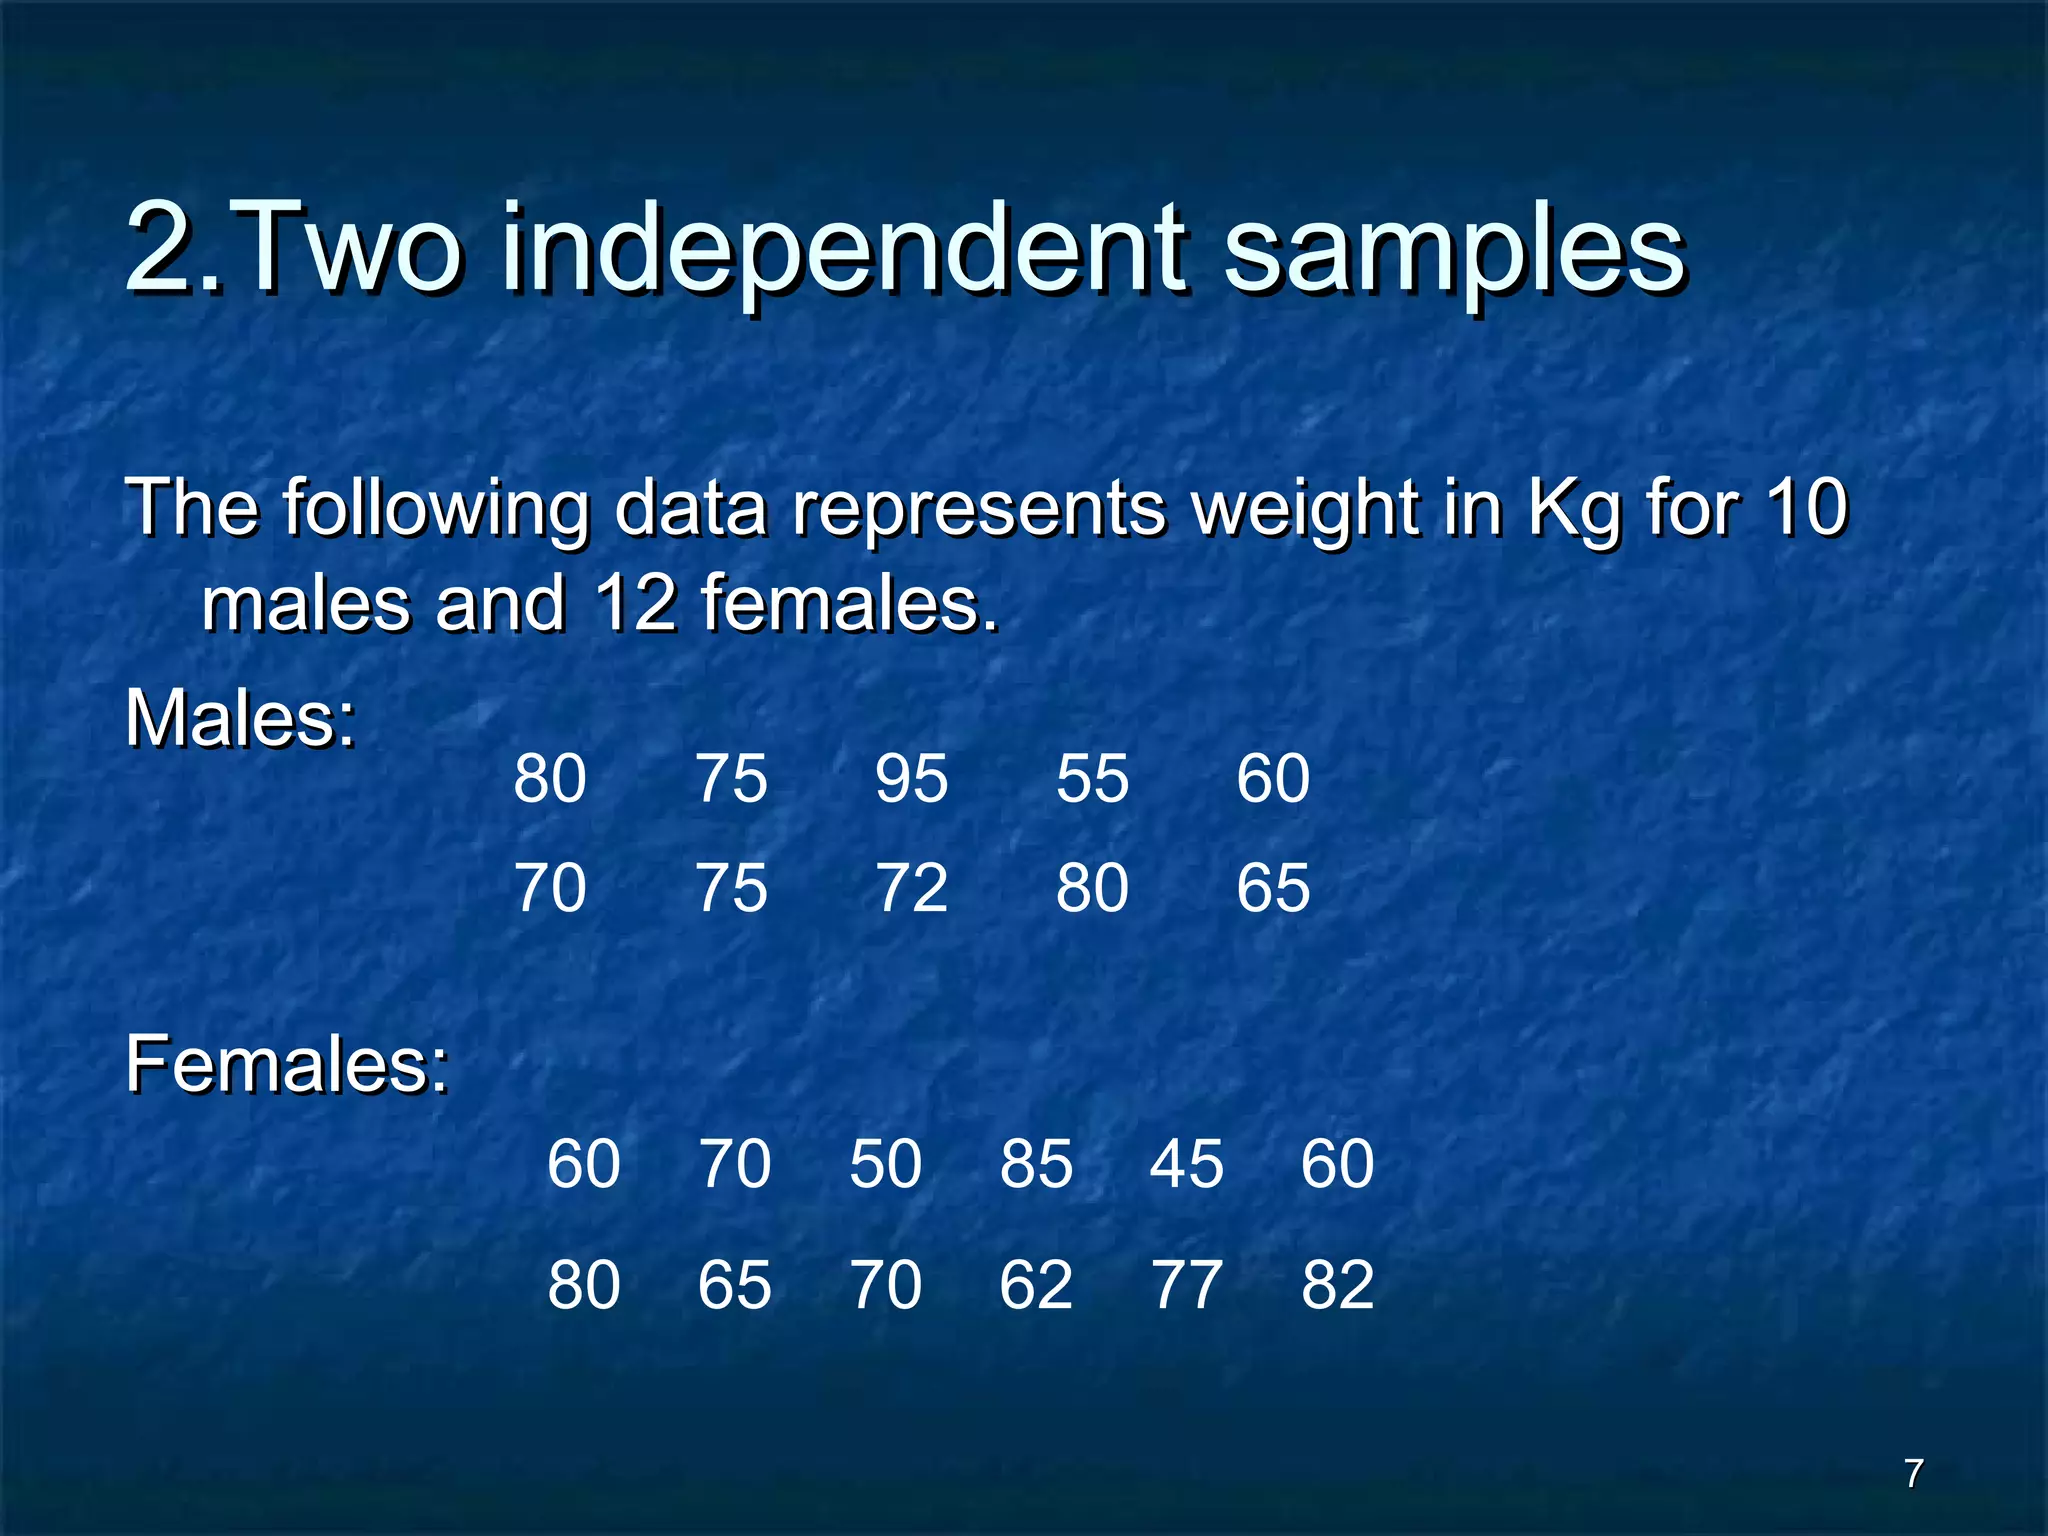
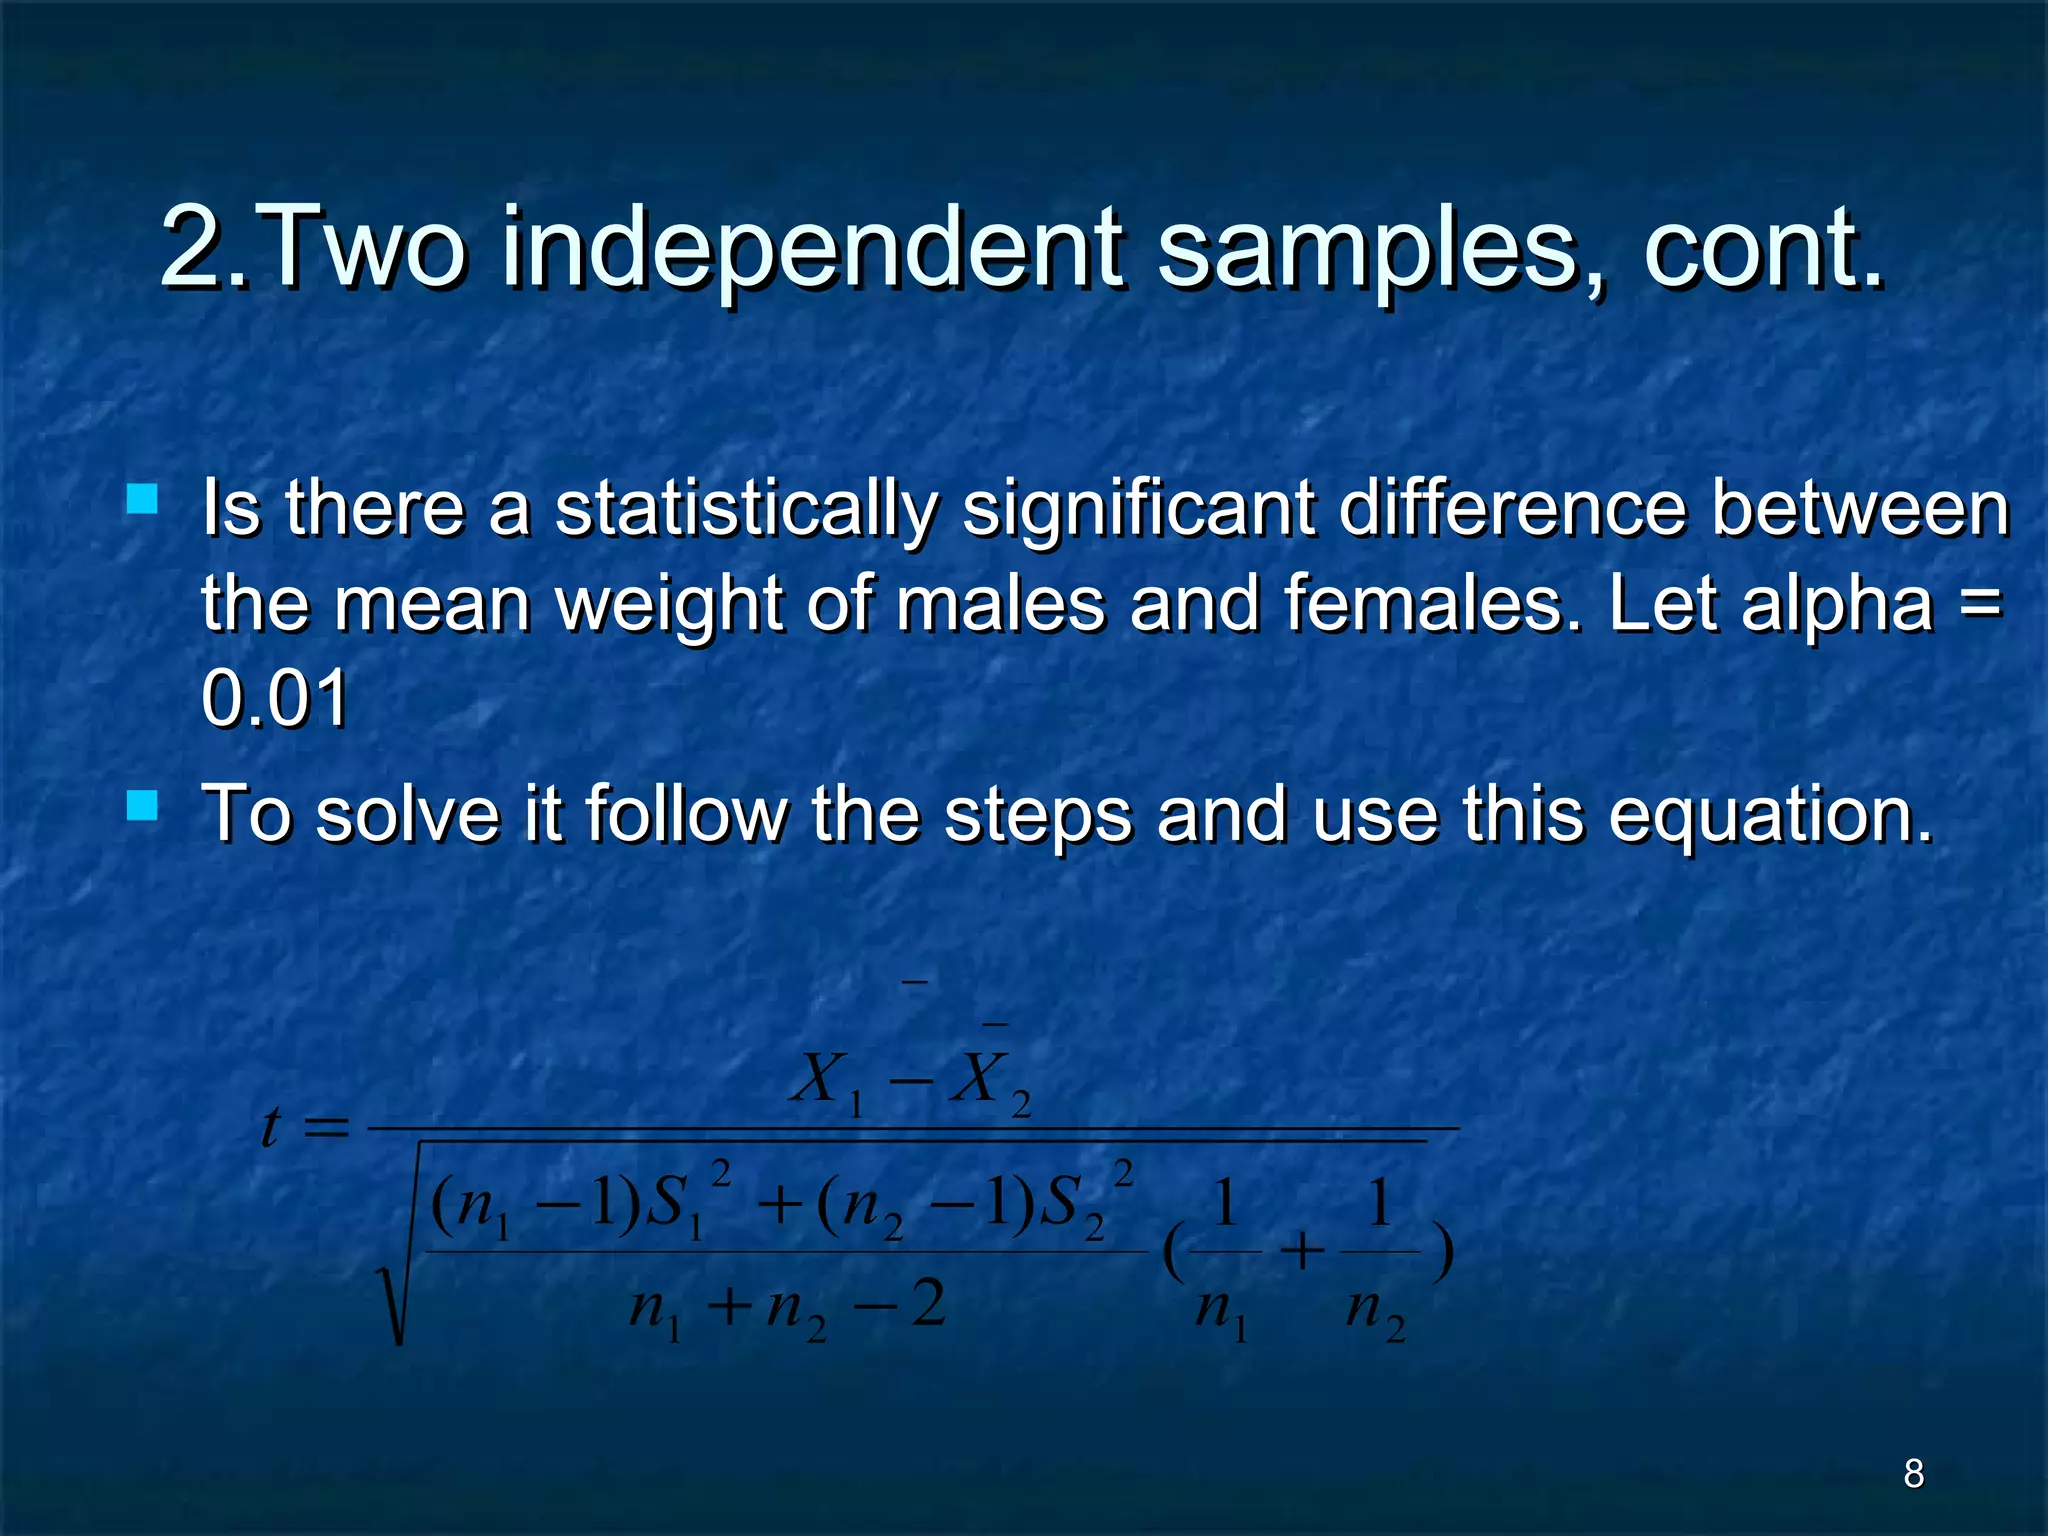
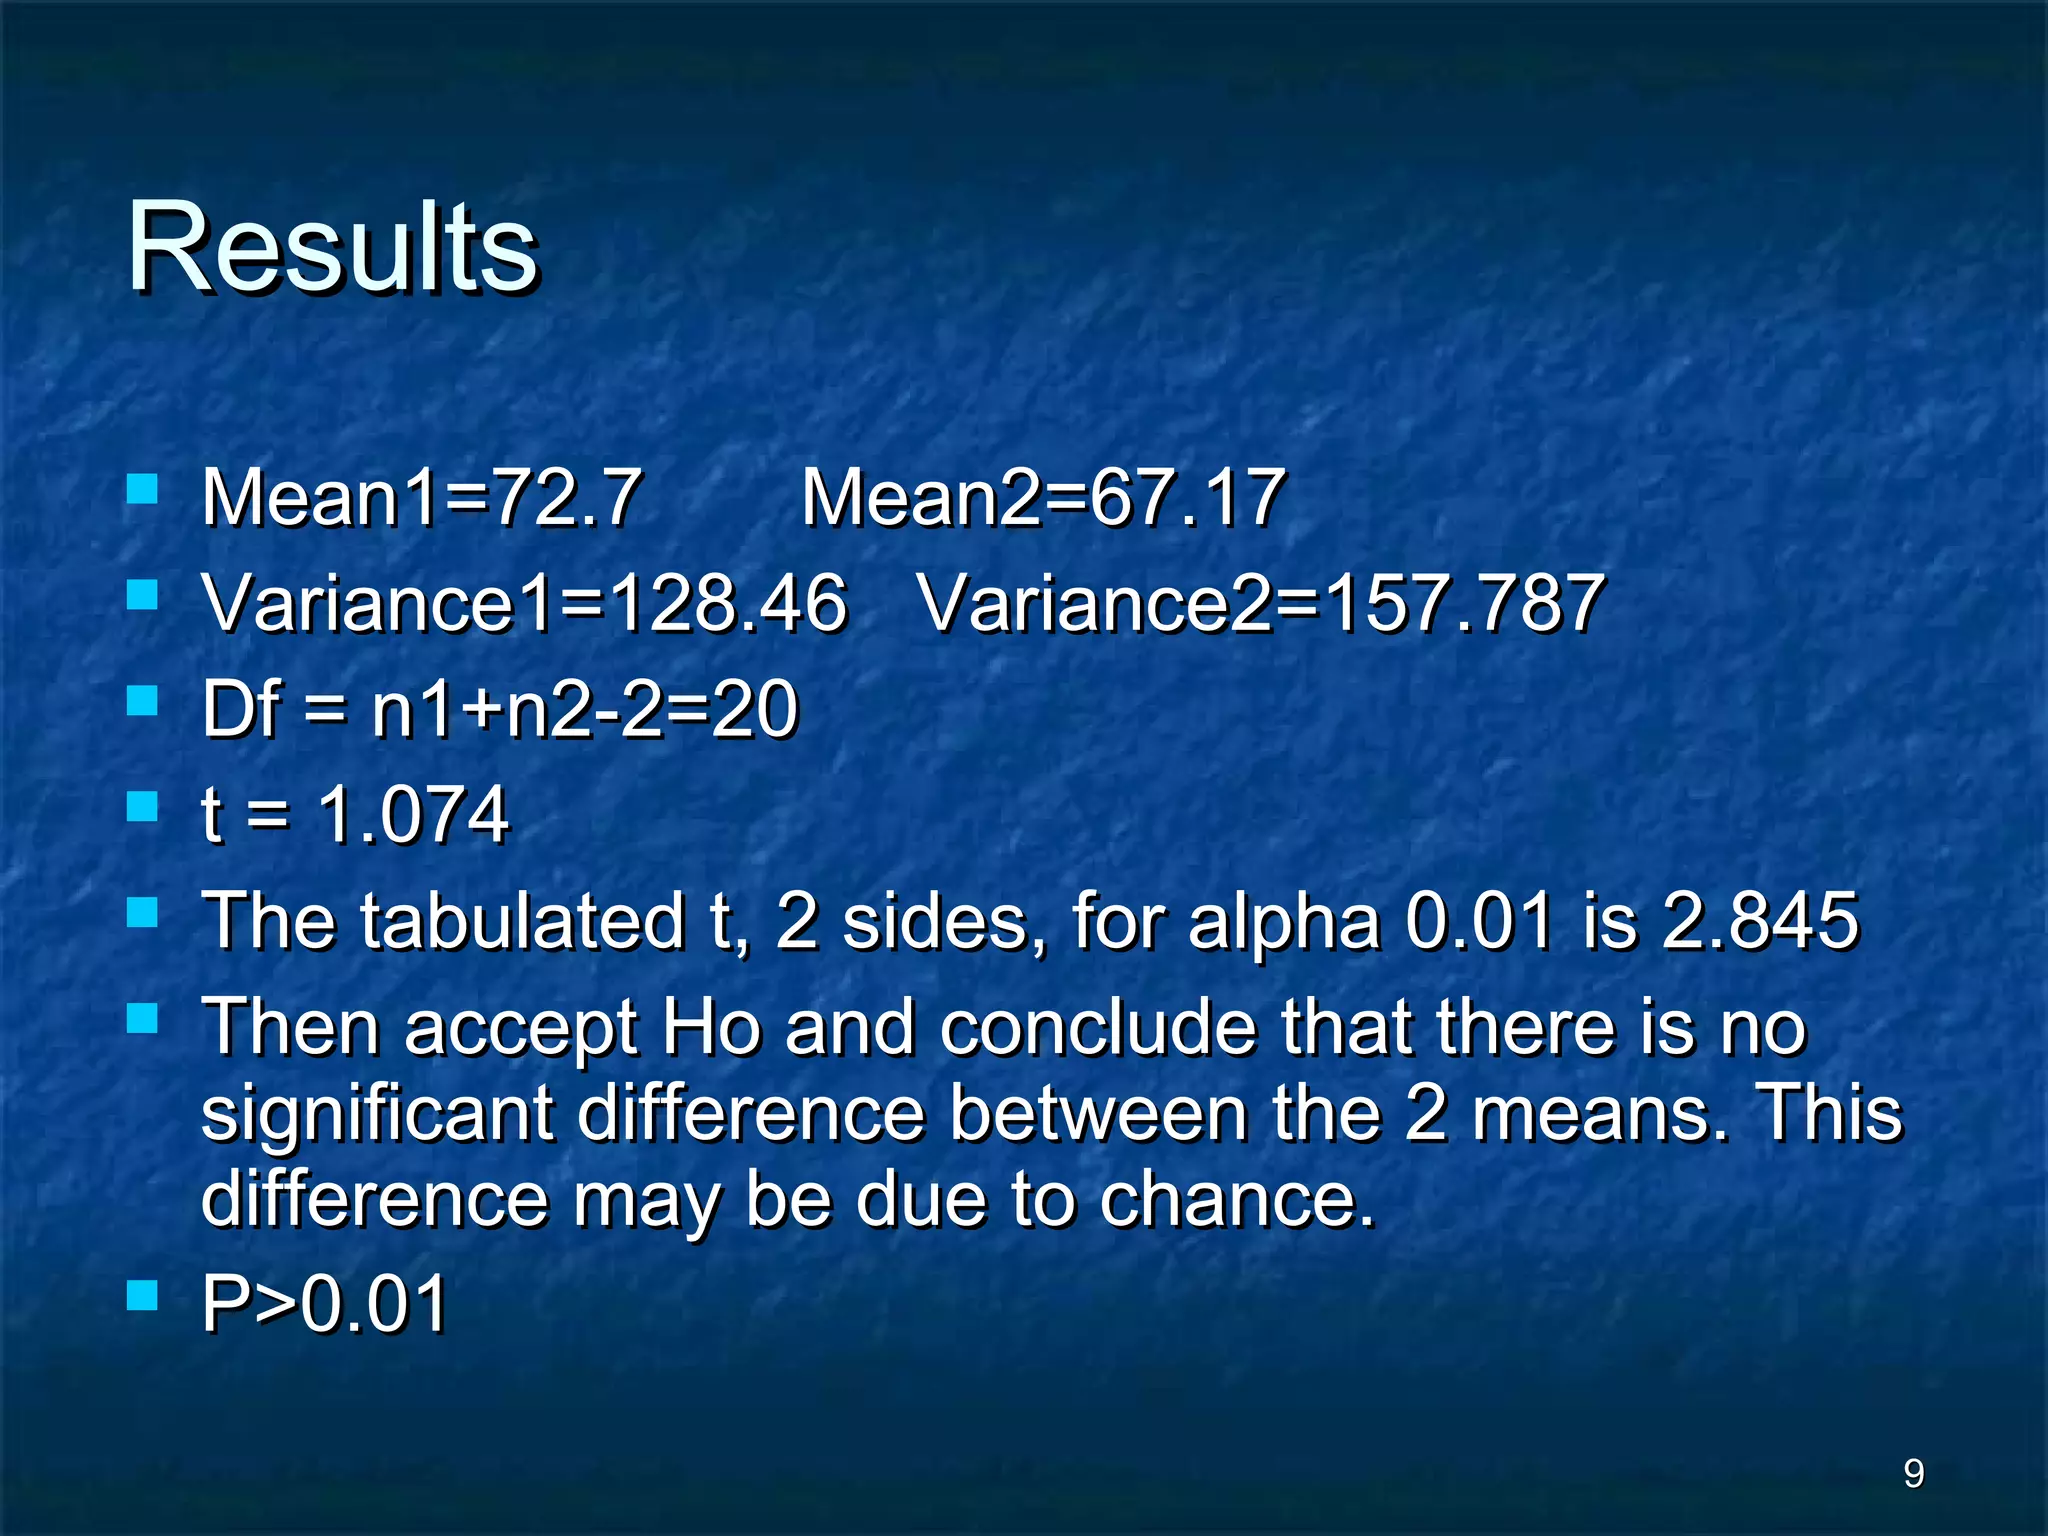
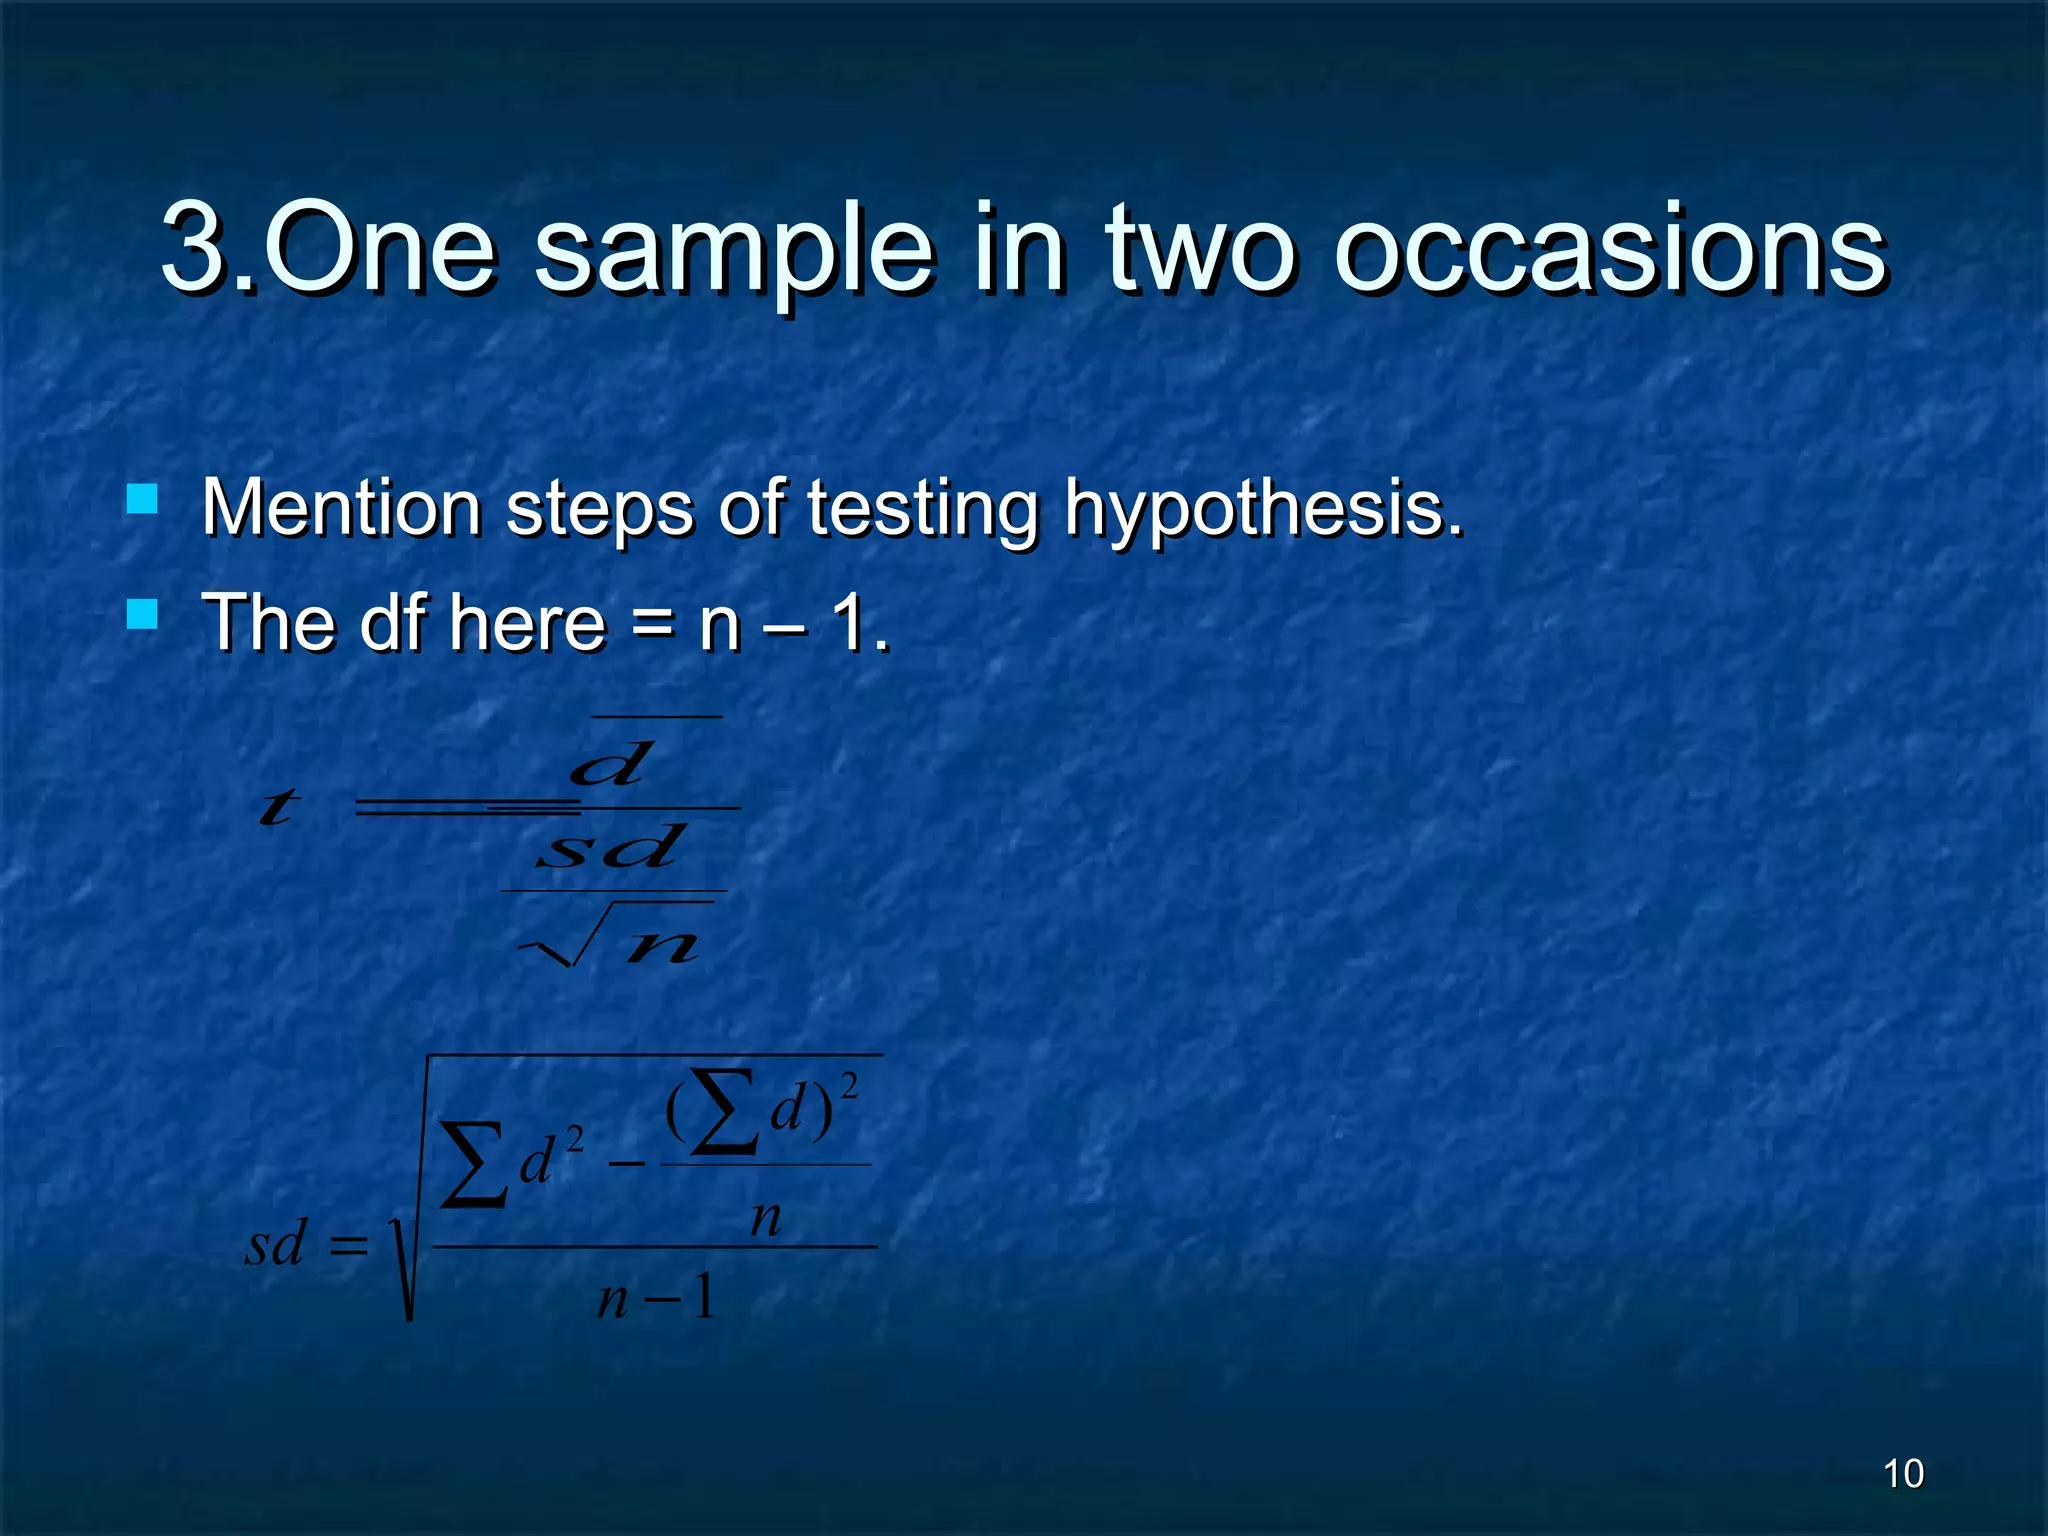
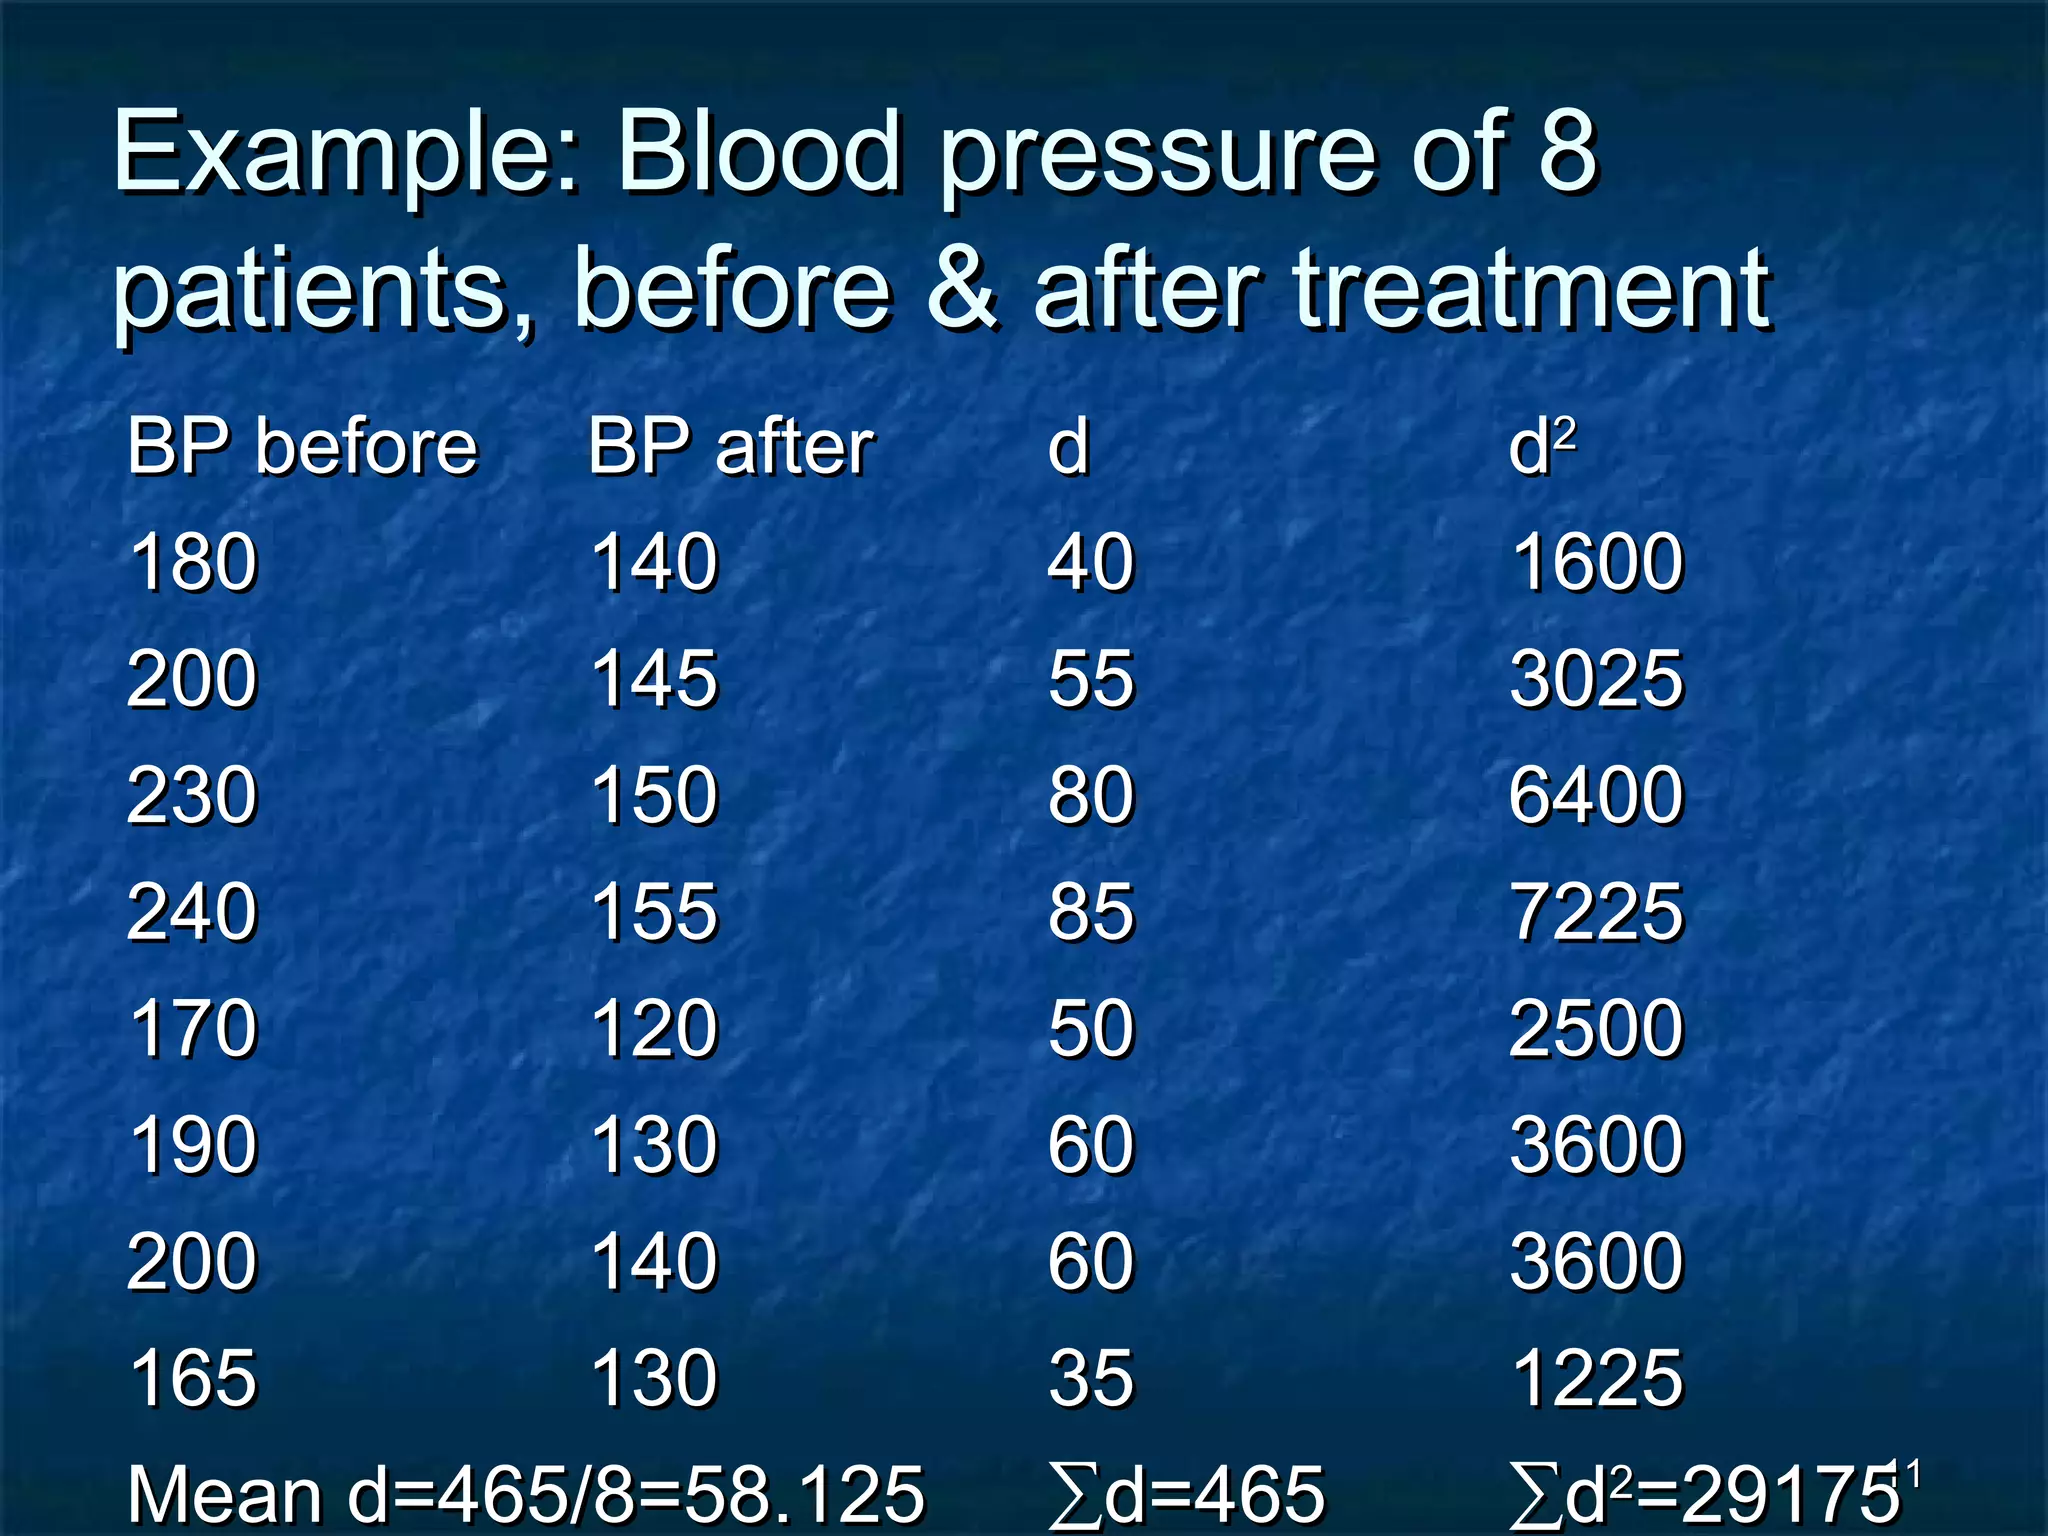
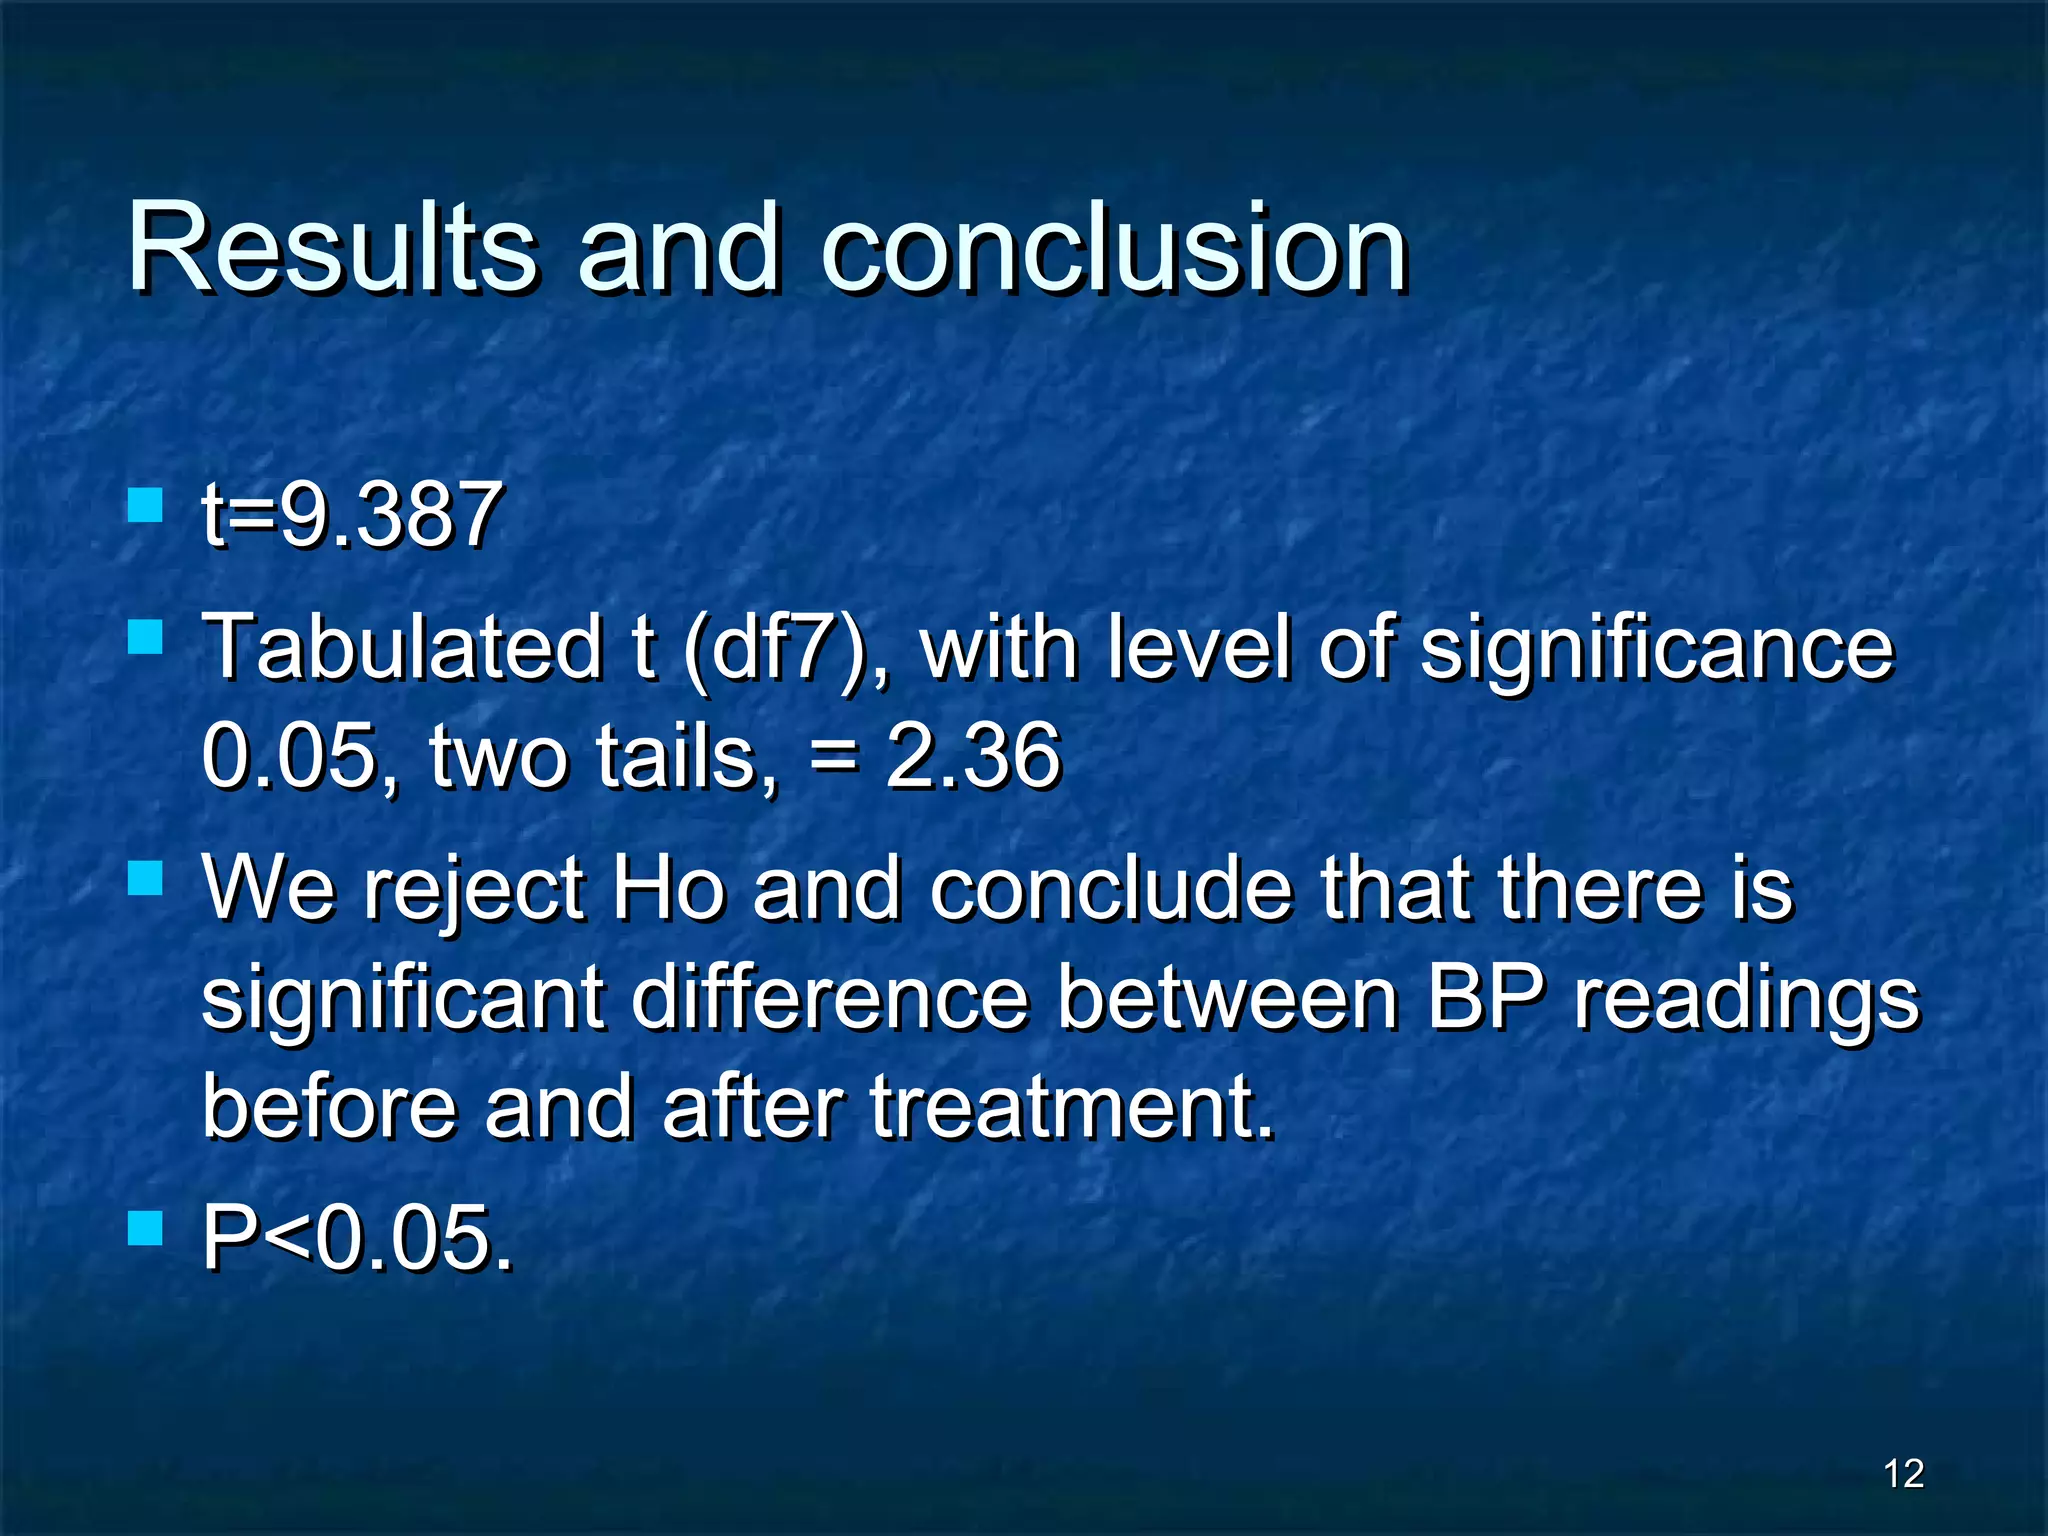
11
The t testThe t test
22
ApplicationsApplications
 To compare the mean of a sample withTo compare the mean of a sample with
population mean.population mean.
 To compare the mean of one sampleTo compare the mean of one sample
with the mean of another independentwith the mean of another independent
sample.sample.
 To compare between the valuesTo compare between the values
(readings) of one sample but in 2(readings) of one sample but in 2
occasions.occasions.
33
1.Sample mean and population1.Sample mean and population
meanmean
 The general steps of testing hypothesis must beThe general steps of testing hypothesis must be
followed.followed.
 Ho: Sample mean=Population mean.Ho: Sample mean=Population mean.
 Degrees of freedom = n - 1Degrees of freedom = n - 1
SE
X
t
−
−
=
µ
44
ExampleExample
The following data represents hemoglobin values inThe following data represents hemoglobin values in
gm/dl for 10 patients:gm/dl for 10 patients:
Is the mean value for patients significantly differIs the mean value for patients significantly differ
from the mean value of general populationfrom the mean value of general population
(12 gm/dl) . Evaluate the role of chance.(12 gm/dl) . Evaluate the role of chance.
10.510.5 99 6.56.5 88 1111
77 7.57.5 8.58.5 9.59.5 1212
55
SolutionSolution
 Mention all steps of testing hypothesis.Mention all steps of testing hypothesis.
Then compare with tabulated value, for 9 df, and 5% level ofThen compare with tabulated value, for 9 df, and 5% level of
significance. It is = 2.262significance. It is = 2.262
The calculated value>tabulated value.The calculated value>tabulated value.
Reject Ho and conclude that there is a statistically significant differenceReject Ho and conclude that there is a statistically significant difference
between the mean of sample and population mean, and thisbetween the mean of sample and population mean, and this
difference is unlikely due to chance.difference is unlikely due to chance.
352.5
10
80201.1
1295.8
−=
−
=t
66
77
2.Two independent samples2.Two independent samples
The following data represents weight in Kg for 10The following data represents weight in Kg for 10
males and 12 females.males and 12 females.
Males:Males:
Females:Females:
80 75 95 55 60
70 75 72 80 65
60 70 50 85 45 60
80 65 70 62 77 82
88
2.Two independent samples, cont.2.Two independent samples, cont.
 Is there a statistically significant difference betweenIs there a statistically significant difference between
the mean weight of males and females. Let alpha =the mean weight of males and females. Let alpha =
0.010.01
 To solve it follow the steps and use this equation.To solve it follow the steps and use this equation.
)
11
(
2
)1()1(
2121
2
22
2
11
21
nnnn
SnSn
XX
t
+
−+
−+−
−
=
−
−
99
ResultsResults
 Mean1=72.7 Mean2=67.17Mean1=72.7 Mean2=67.17
 Variance1=128.46 Variance2=157.787Variance1=128.46 Variance2=157.787
 Df = n1+n2-2=20Df = n1+n2-2=20
 t = 1.074t = 1.074
 The tabulated t, 2 sides, for alpha 0.01 is 2.845The tabulated t, 2 sides, for alpha 0.01 is 2.845
 Then accept Ho and conclude that there is noThen accept Ho and conclude that there is no
significant difference between the 2 means. Thissignificant difference between the 2 means. This
difference may be due to chance.difference may be due to chance.
 P>0.01P>0.01
1010
3.One sample in two occasions3.One sample in two occasions
 Mention steps of testing hypothesis.Mention steps of testing hypothesis.
 The df here = n – 1.The df here = n – 1.
n
sd
d
t
−
=
1
)( 2
2
−
−
=
∑
∑
n
n
d
d
sd
1111
Example: Blood pressure of 8Example: Blood pressure of 8
patients, before & after treatmentpatients, before & after treatment
BP beforeBP before BP afterBP after dd dd22
180180 140140 4040 16001600
200200 145145 5555 30253025
230230 150150 8080 64006400
240240 155155 8585 72257225
170170 120120 5050 25002500
190190 130130 6060 36003600
200200 140140 6060 36003600
165165 130130 3535 12251225
Mean d=465/8=58.125Mean d=465/8=58.125 ∑∑d=465d=465 ∑∑dd22
=29175=29175
1212
Results and conclusionResults and conclusion
 t=9.387t=9.387
 Tabulated t (df7), with level of significanceTabulated t (df7), with level of significance
0.05, two tails, = 2.360.05, two tails, = 2.36
 We reject Ho and conclude that there isWe reject Ho and conclude that there is
significant difference between BP readingssignificant difference between BP readings
before and after treatment.before and after treatment.
 P<0.05.P<0.05.

Stat5 the t test

  • 1.
  • 2.
    22 ApplicationsApplications  To comparethe mean of a sample withTo compare the mean of a sample with population mean.population mean.  To compare the mean of one sampleTo compare the mean of one sample with the mean of another independentwith the mean of another independent sample.sample.  To compare between the valuesTo compare between the values (readings) of one sample but in 2(readings) of one sample but in 2 occasions.occasions.
  • 3.
    33 1.Sample mean andpopulation1.Sample mean and population meanmean  The general steps of testing hypothesis must beThe general steps of testing hypothesis must be followed.followed.  Ho: Sample mean=Population mean.Ho: Sample mean=Population mean.  Degrees of freedom = n - 1Degrees of freedom = n - 1 SE X t − − = µ
  • 4.
    44 ExampleExample The following datarepresents hemoglobin values inThe following data represents hemoglobin values in gm/dl for 10 patients:gm/dl for 10 patients: Is the mean value for patients significantly differIs the mean value for patients significantly differ from the mean value of general populationfrom the mean value of general population (12 gm/dl) . Evaluate the role of chance.(12 gm/dl) . Evaluate the role of chance. 10.510.5 99 6.56.5 88 1111 77 7.57.5 8.58.5 9.59.5 1212
  • 5.
    55 SolutionSolution  Mention allsteps of testing hypothesis.Mention all steps of testing hypothesis. Then compare with tabulated value, for 9 df, and 5% level ofThen compare with tabulated value, for 9 df, and 5% level of significance. It is = 2.262significance. It is = 2.262 The calculated value>tabulated value.The calculated value>tabulated value. Reject Ho and conclude that there is a statistically significant differenceReject Ho and conclude that there is a statistically significant difference between the mean of sample and population mean, and thisbetween the mean of sample and population mean, and this difference is unlikely due to chance.difference is unlikely due to chance. 352.5 10 80201.1 1295.8 −= − =t
  • 6.
  • 7.
    77 2.Two independent samples2.Twoindependent samples The following data represents weight in Kg for 10The following data represents weight in Kg for 10 males and 12 females.males and 12 females. Males:Males: Females:Females: 80 75 95 55 60 70 75 72 80 65 60 70 50 85 45 60 80 65 70 62 77 82
  • 8.
    88 2.Two independent samples,cont.2.Two independent samples, cont.  Is there a statistically significant difference betweenIs there a statistically significant difference between the mean weight of males and females. Let alpha =the mean weight of males and females. Let alpha = 0.010.01  To solve it follow the steps and use this equation.To solve it follow the steps and use this equation. ) 11 ( 2 )1()1( 2121 2 22 2 11 21 nnnn SnSn XX t + −+ −+− − = − −
  • 9.
    99 ResultsResults  Mean1=72.7 Mean2=67.17Mean1=72.7Mean2=67.17  Variance1=128.46 Variance2=157.787Variance1=128.46 Variance2=157.787  Df = n1+n2-2=20Df = n1+n2-2=20  t = 1.074t = 1.074  The tabulated t, 2 sides, for alpha 0.01 is 2.845The tabulated t, 2 sides, for alpha 0.01 is 2.845  Then accept Ho and conclude that there is noThen accept Ho and conclude that there is no significant difference between the 2 means. Thissignificant difference between the 2 means. This difference may be due to chance.difference may be due to chance.  P>0.01P>0.01
  • 10.
    1010 3.One sample intwo occasions3.One sample in two occasions  Mention steps of testing hypothesis.Mention steps of testing hypothesis.  The df here = n – 1.The df here = n – 1. n sd d t − = 1 )( 2 2 − − = ∑ ∑ n n d d sd
  • 11.
    1111 Example: Blood pressureof 8Example: Blood pressure of 8 patients, before & after treatmentpatients, before & after treatment BP beforeBP before BP afterBP after dd dd22 180180 140140 4040 16001600 200200 145145 5555 30253025 230230 150150 8080 64006400 240240 155155 8585 72257225 170170 120120 5050 25002500 190190 130130 6060 36003600 200200 140140 6060 36003600 165165 130130 3535 12251225 Mean d=465/8=58.125Mean d=465/8=58.125 ∑∑d=465d=465 ∑∑dd22 =29175=29175
  • 12.
    1212 Results and conclusionResultsand conclusion  t=9.387t=9.387  Tabulated t (df7), with level of significanceTabulated t (df7), with level of significance 0.05, two tails, = 2.360.05, two tails, = 2.36  We reject Ho and conclude that there isWe reject Ho and conclude that there is significant difference between BP readingssignificant difference between BP readings before and after treatment.before and after treatment.  P<0.05.P<0.05.