Downloaded 905 times


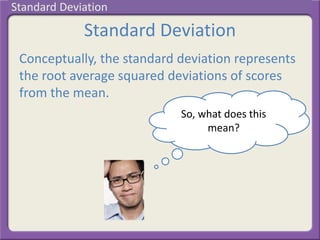


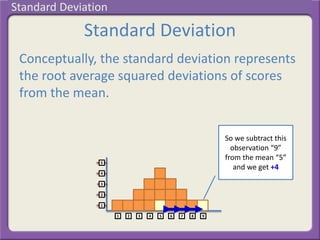


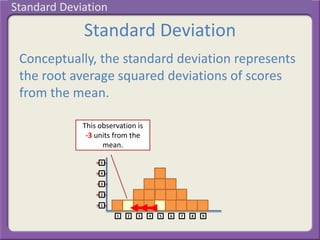


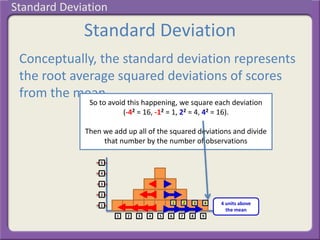
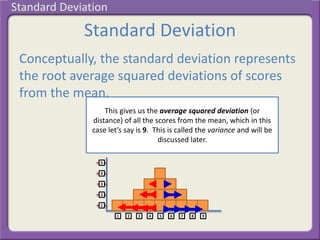


The document discusses the conceptual definition of standard deviation. Standard deviation represents the root average of the squared deviations of scores from the mean. It explains that to calculate standard deviation, each score's deviation from the mean is squared, those squared deviations are averaged, and then the square root of the average is taken to determine the standard deviation in the original units of measurement.