Download as PDF, PPTX


![Normal distribution problem
1) X is a normally distributed variable with mean μ = 30 and standard deviation σ = 4. Find
a) P(x < 40)
b) P(x > 21)
c) P(30 < x < 35)
Soln:
For x = 40, the z-value z = (40 - 30) / 4 = 2.5
Hence P(x < 40) = P(z < 2.5) = [area to the left of 2.5] = 0.9938](https://image.slidesharecdn.com/typesofdistribution-210305104942/85/Binomial-Poisson-Geometric-Normal-distribution-25-320.jpg)
![b) For x = 21, z = (21 - 30) / 4 = -2.25
Hence P(x > 21) = P(z > -2.25) = [total area] - [area to the left of -2.25]
= 1 - 0.0122 = 0.9878
c) For x = 30 , z = (30 - 30) / 4 = 0 and for x = 35, z = (35 - 30) / 4 = 1.25
Hence P(30 < x < 35) = P(0 < z < 1.25) = [area to the left of z = 1.25] - [area to the left of 0]
= 0.8944 - 0.5 = 0.3944](https://image.slidesharecdn.com/typesofdistribution-210305104942/85/Binomial-Poisson-Geometric-Normal-distribution-26-320.jpg)

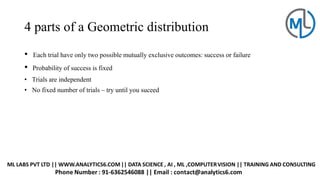
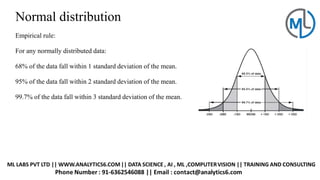
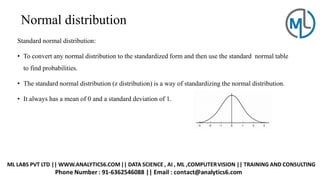
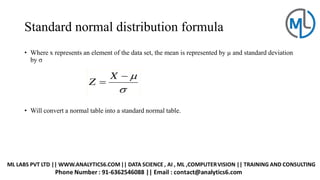
This document discusses several common probability distributions: binomial, Poisson, geometric, and normal. It provides characteristics, formulas, and examples of each. The binomial distribution describes independent yes/no trials with fixed probabilities. The Poisson distribution applies when the probability of an event is very small. The geometric distribution gives the number of trials until the first success. The normal distribution is symmetric and bell-shaped, describing many natural phenomena.


