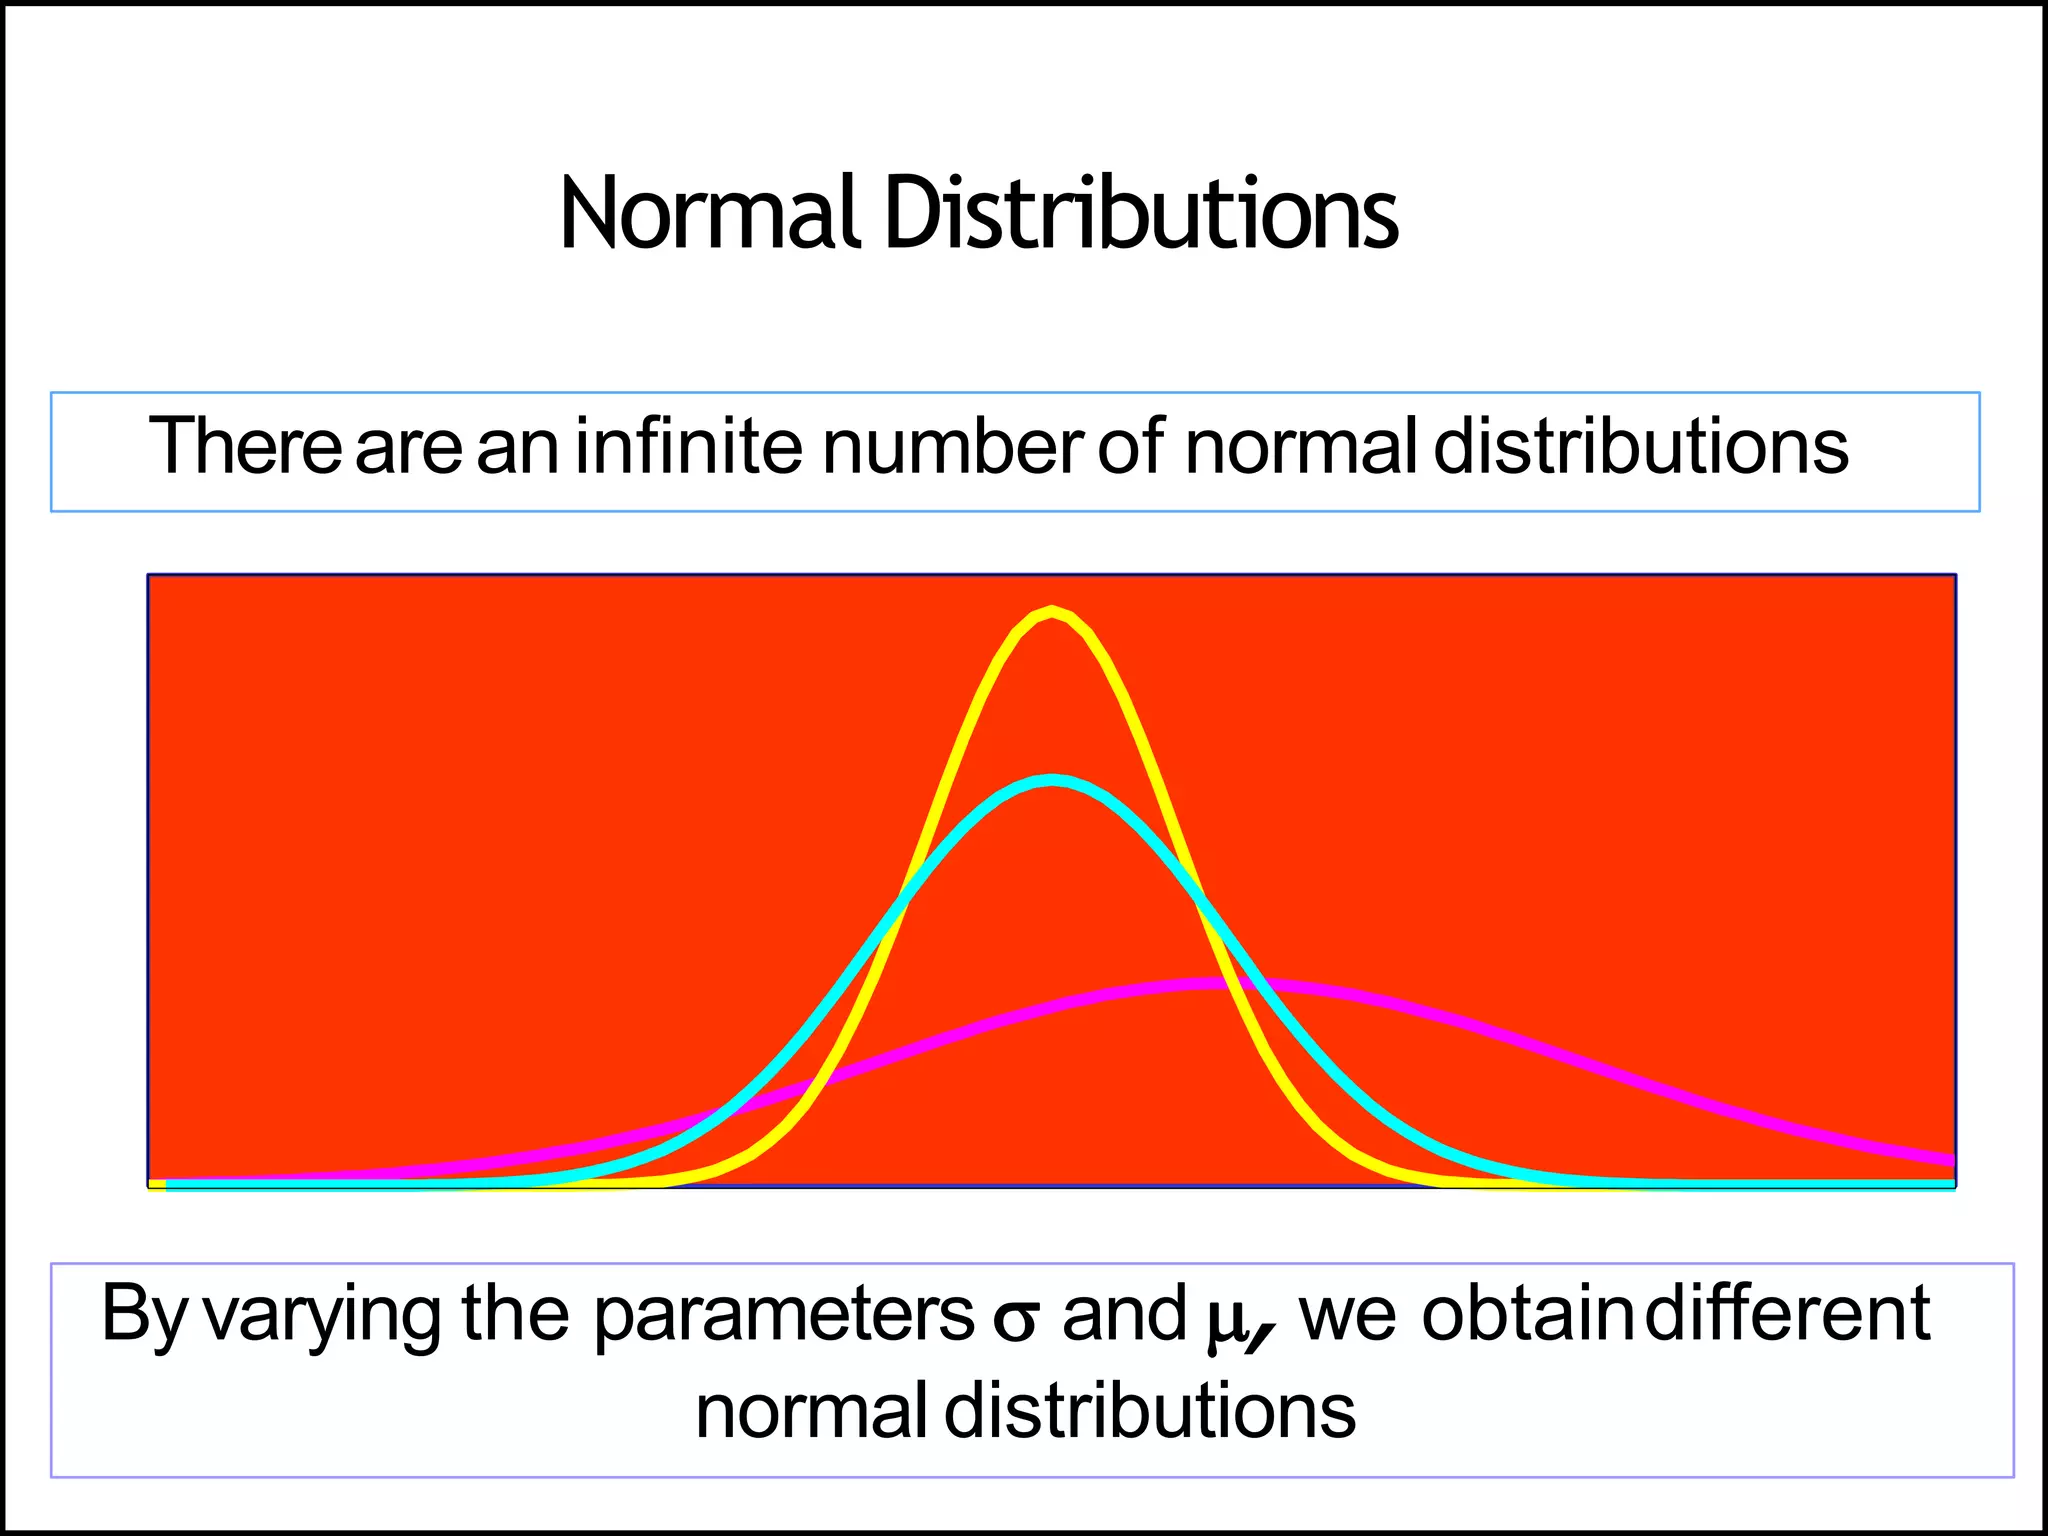
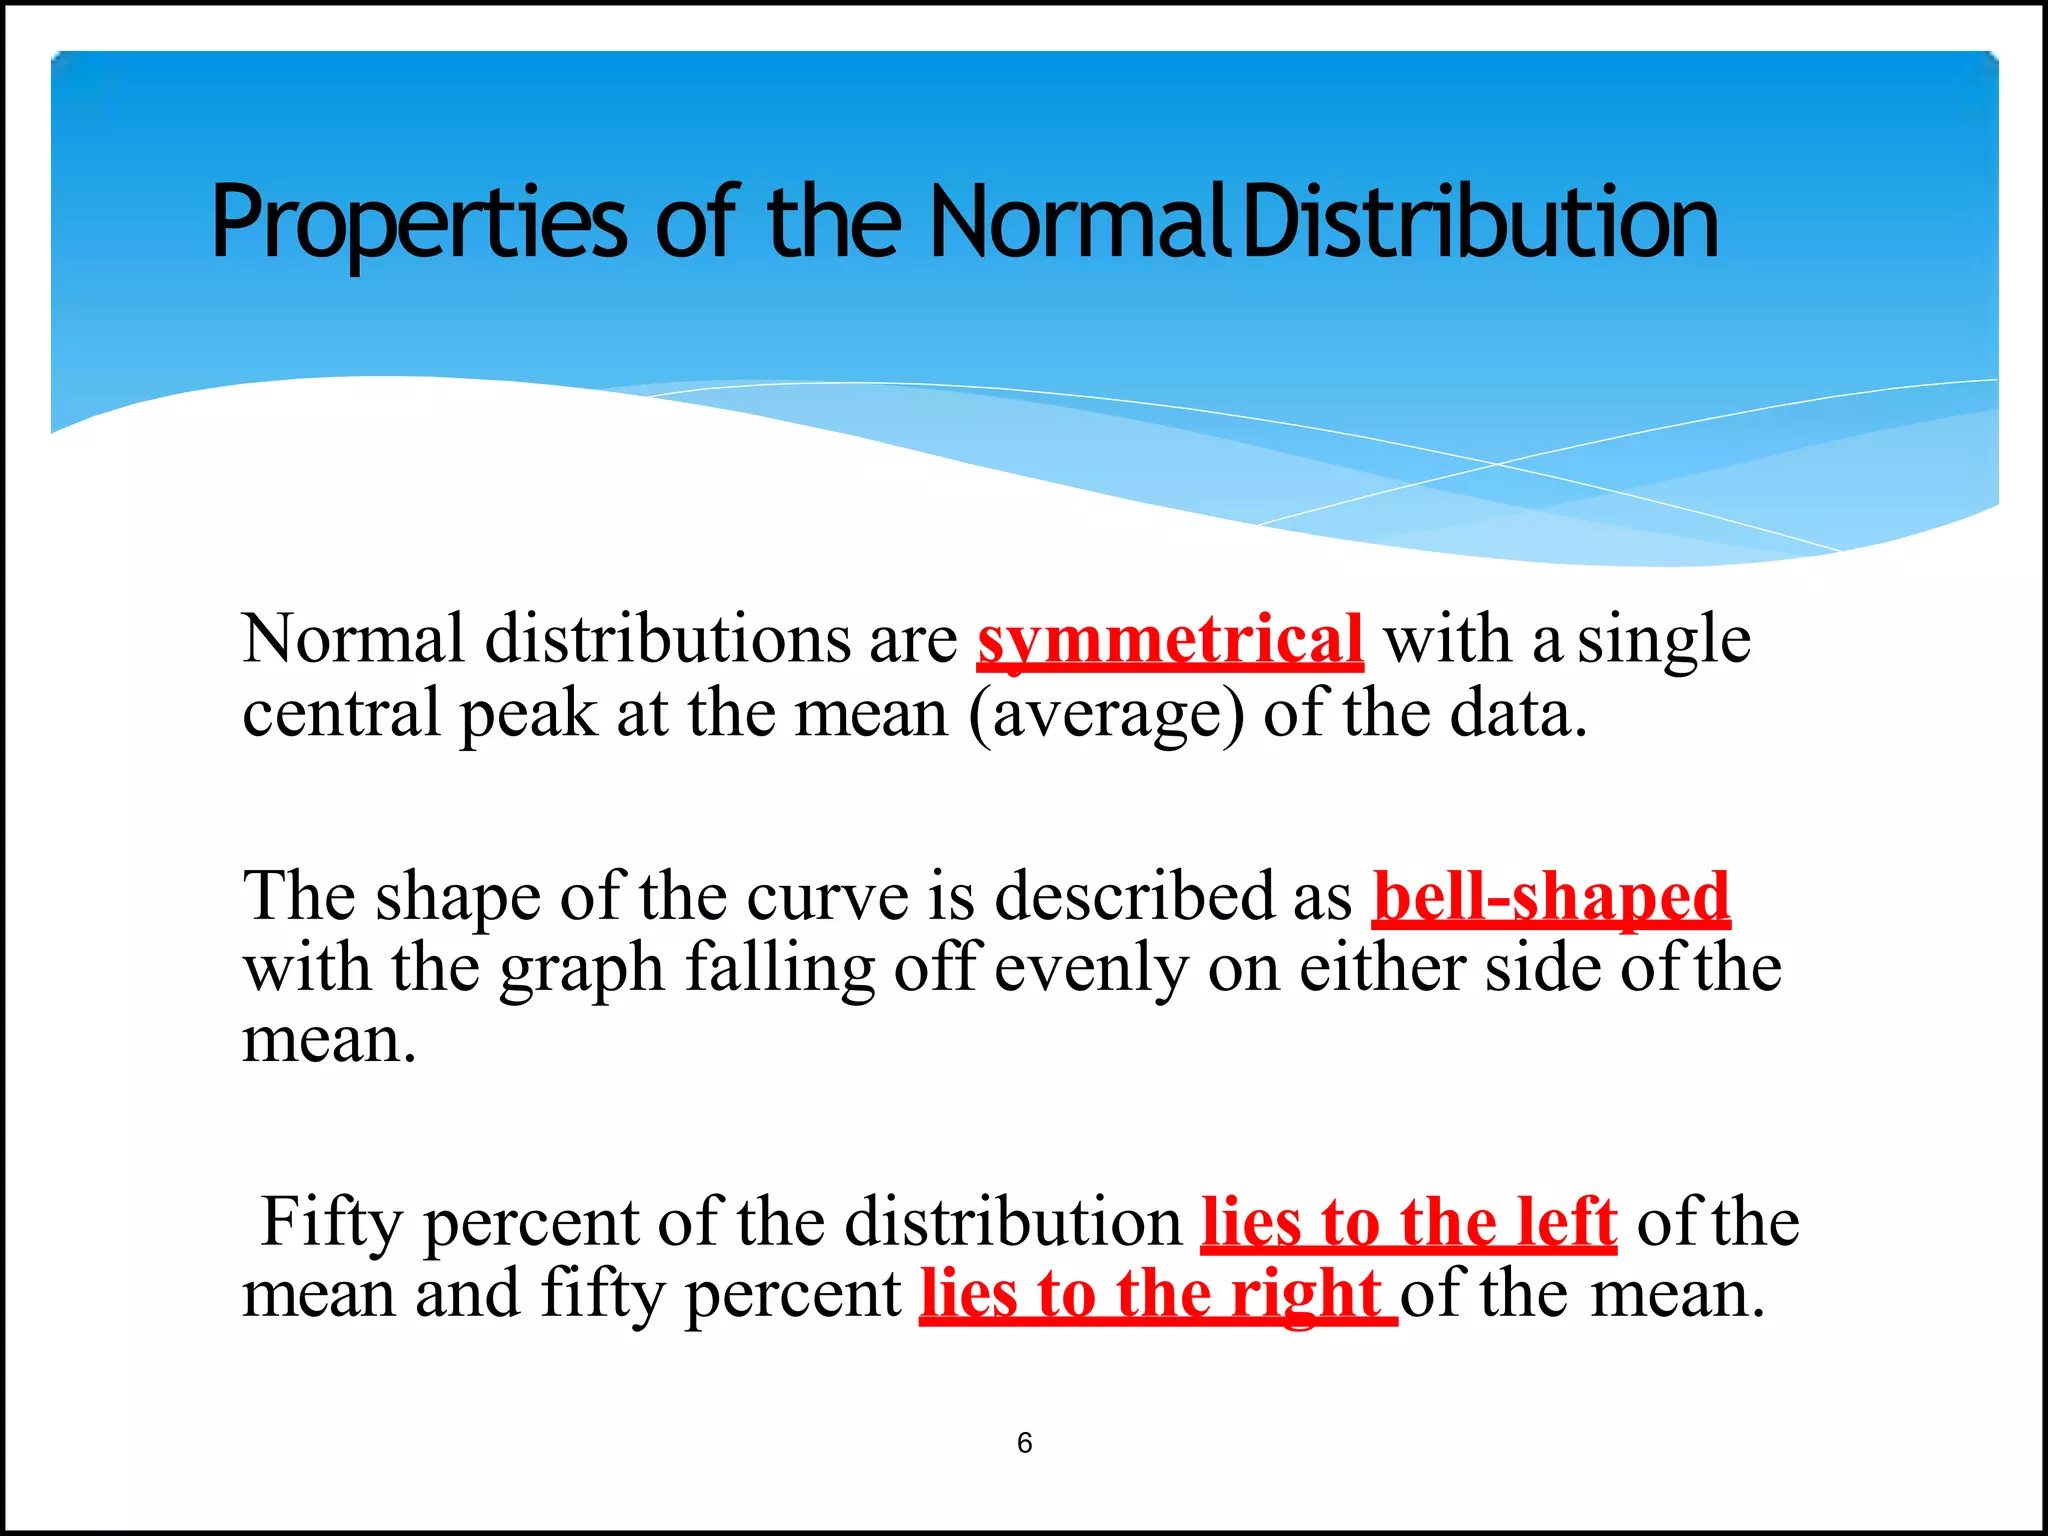
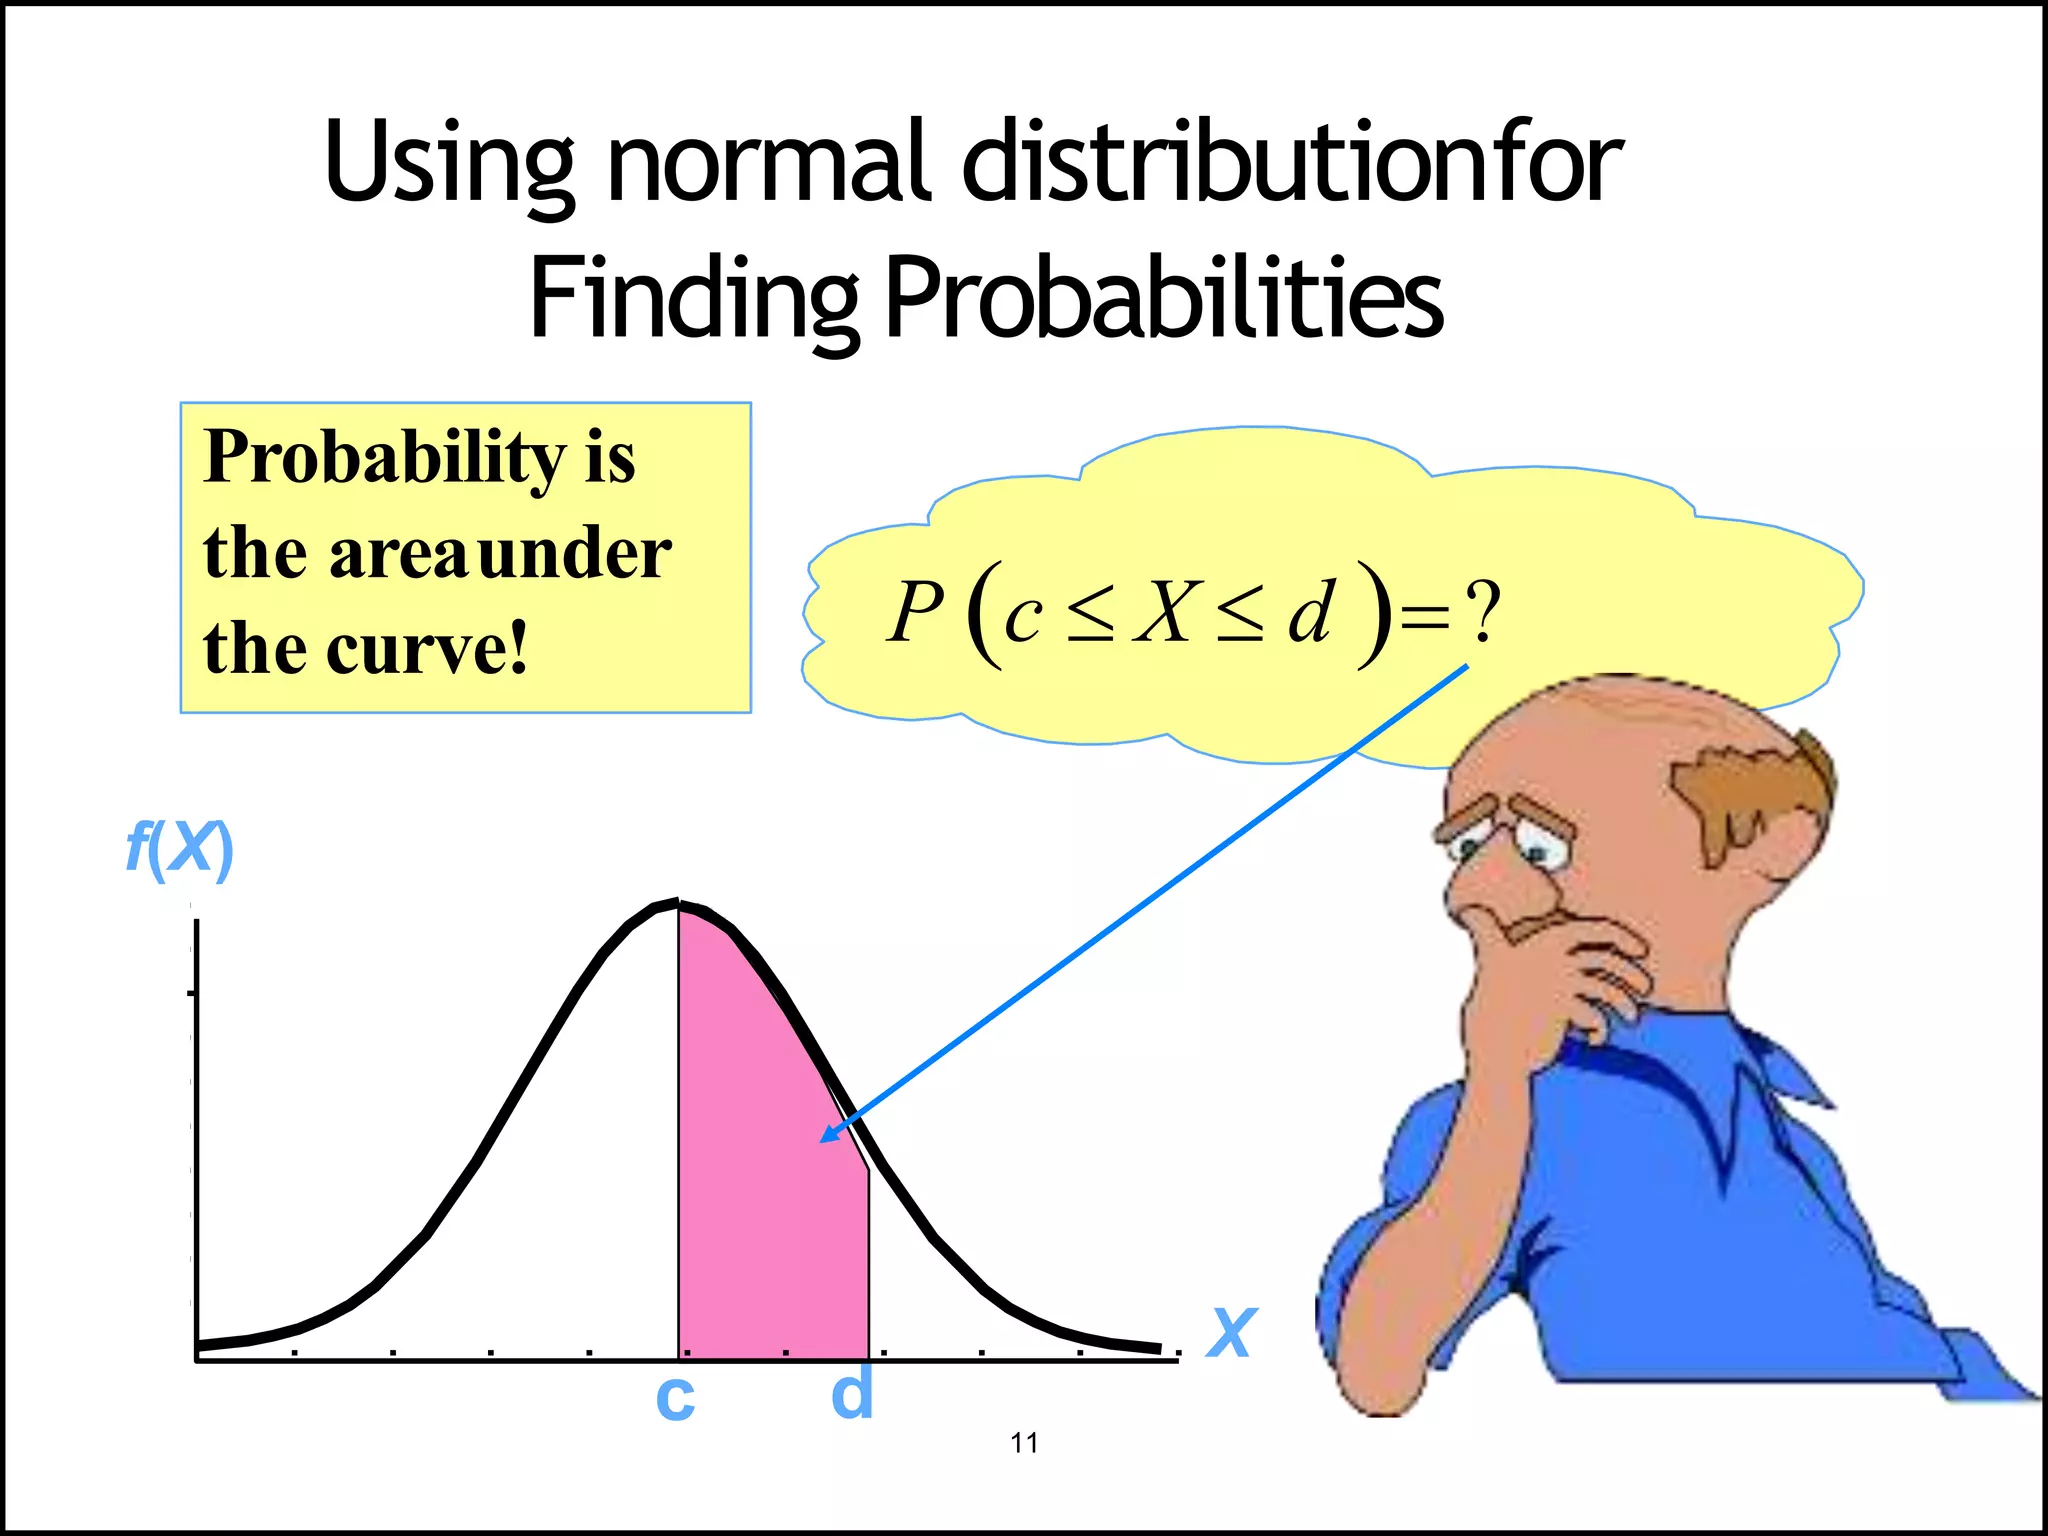
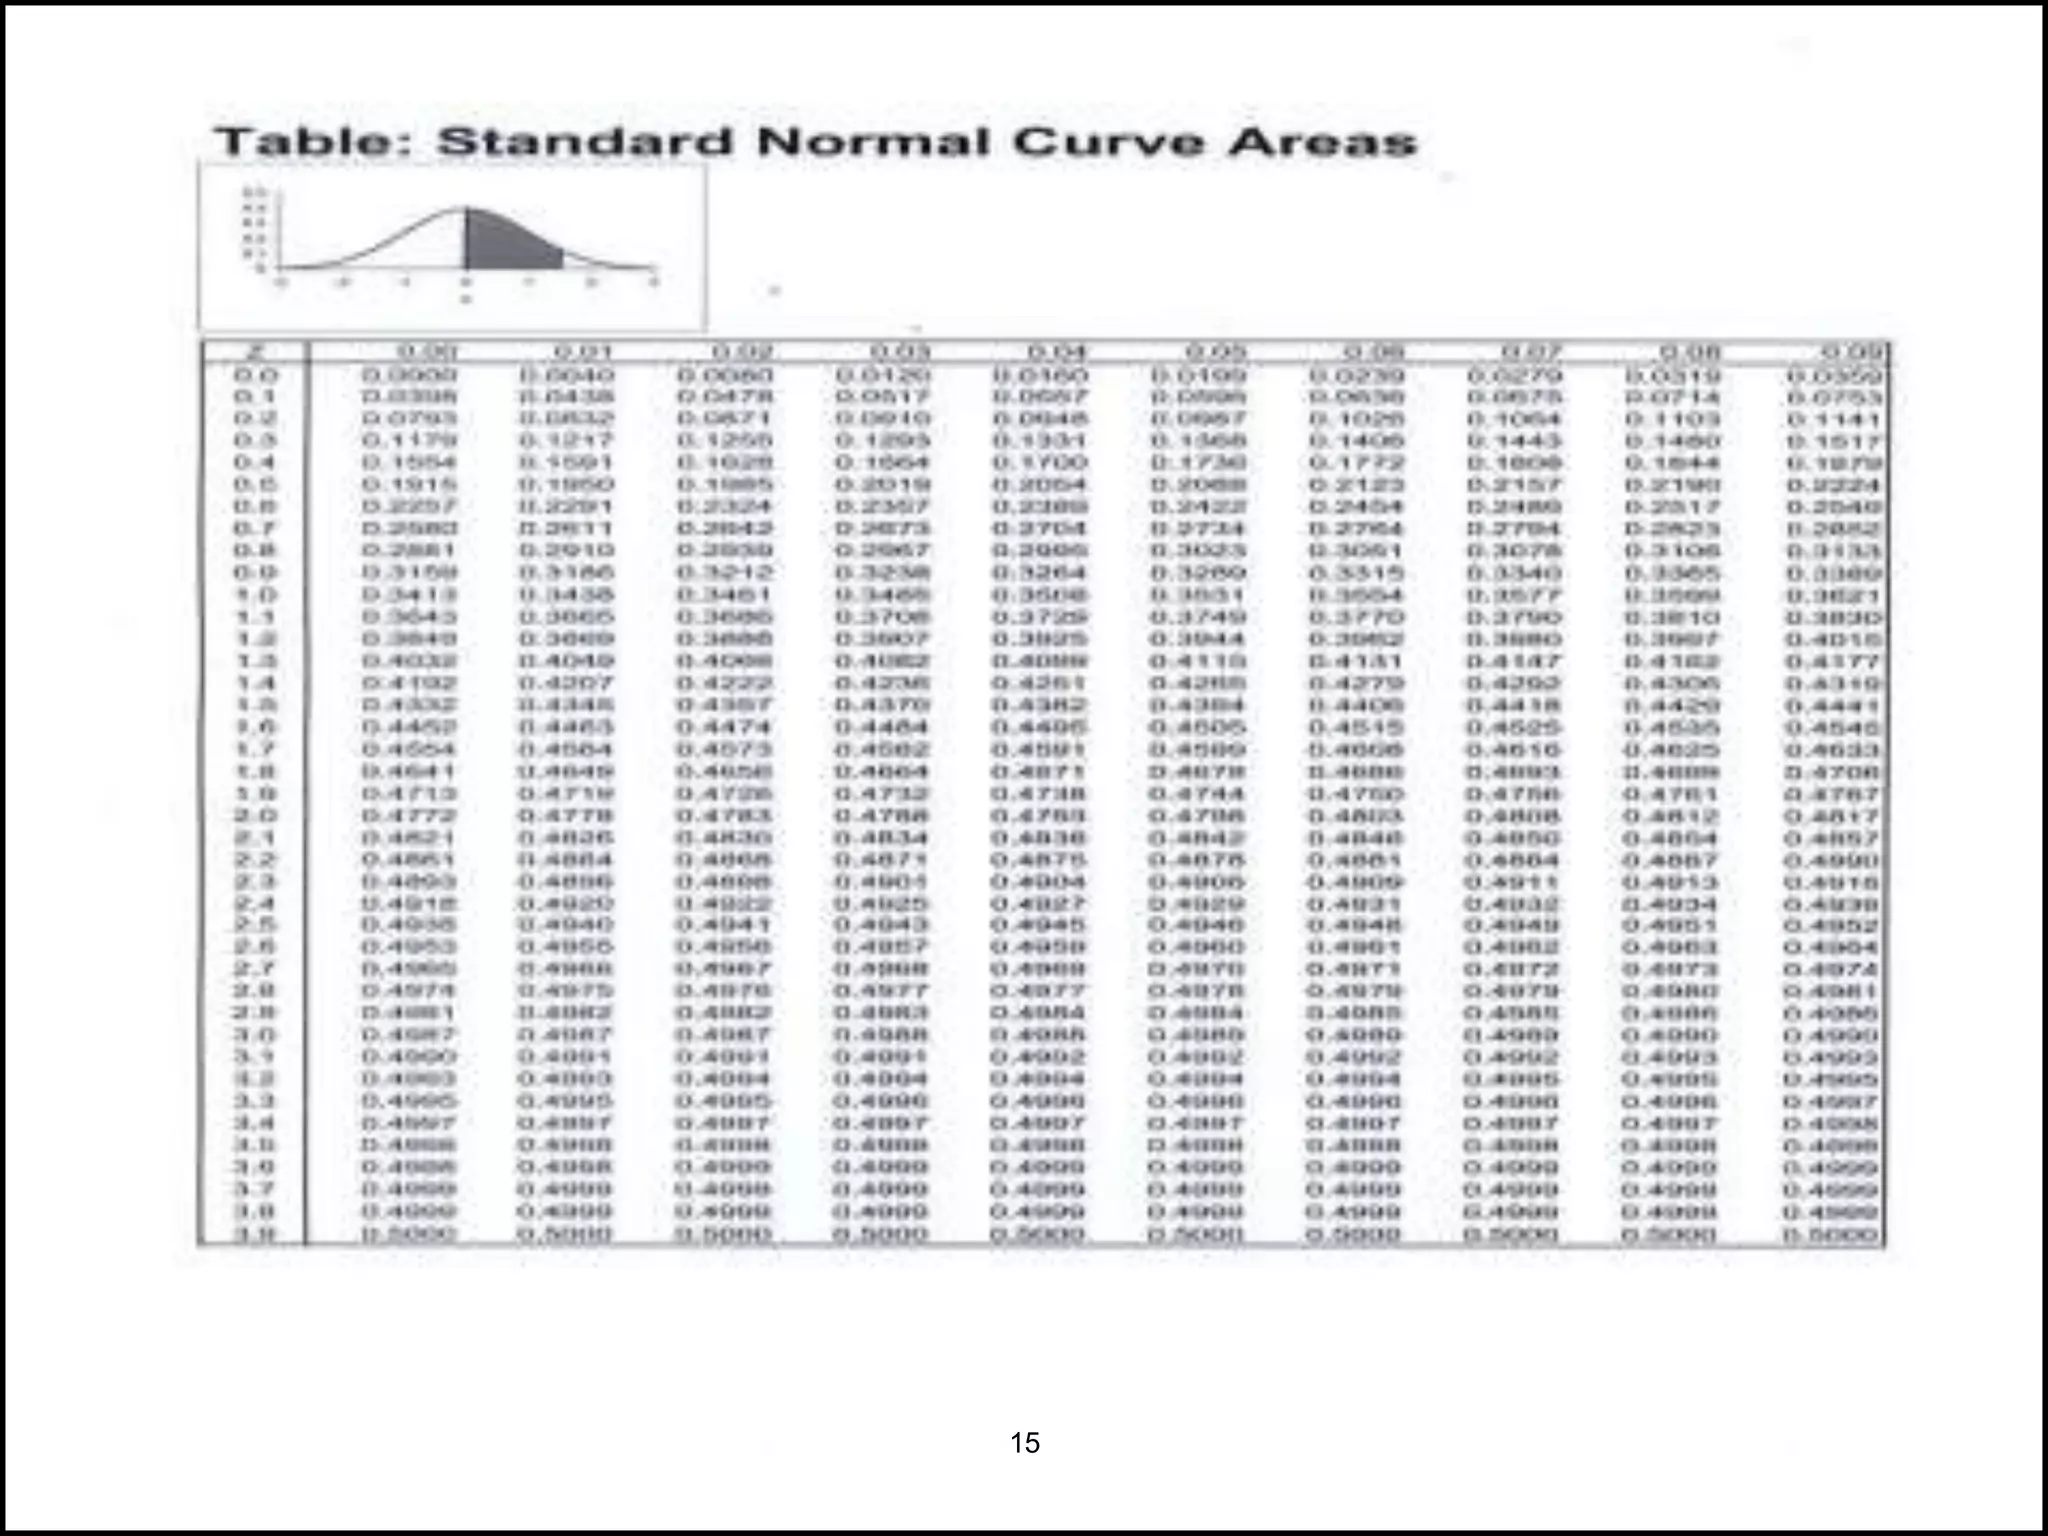
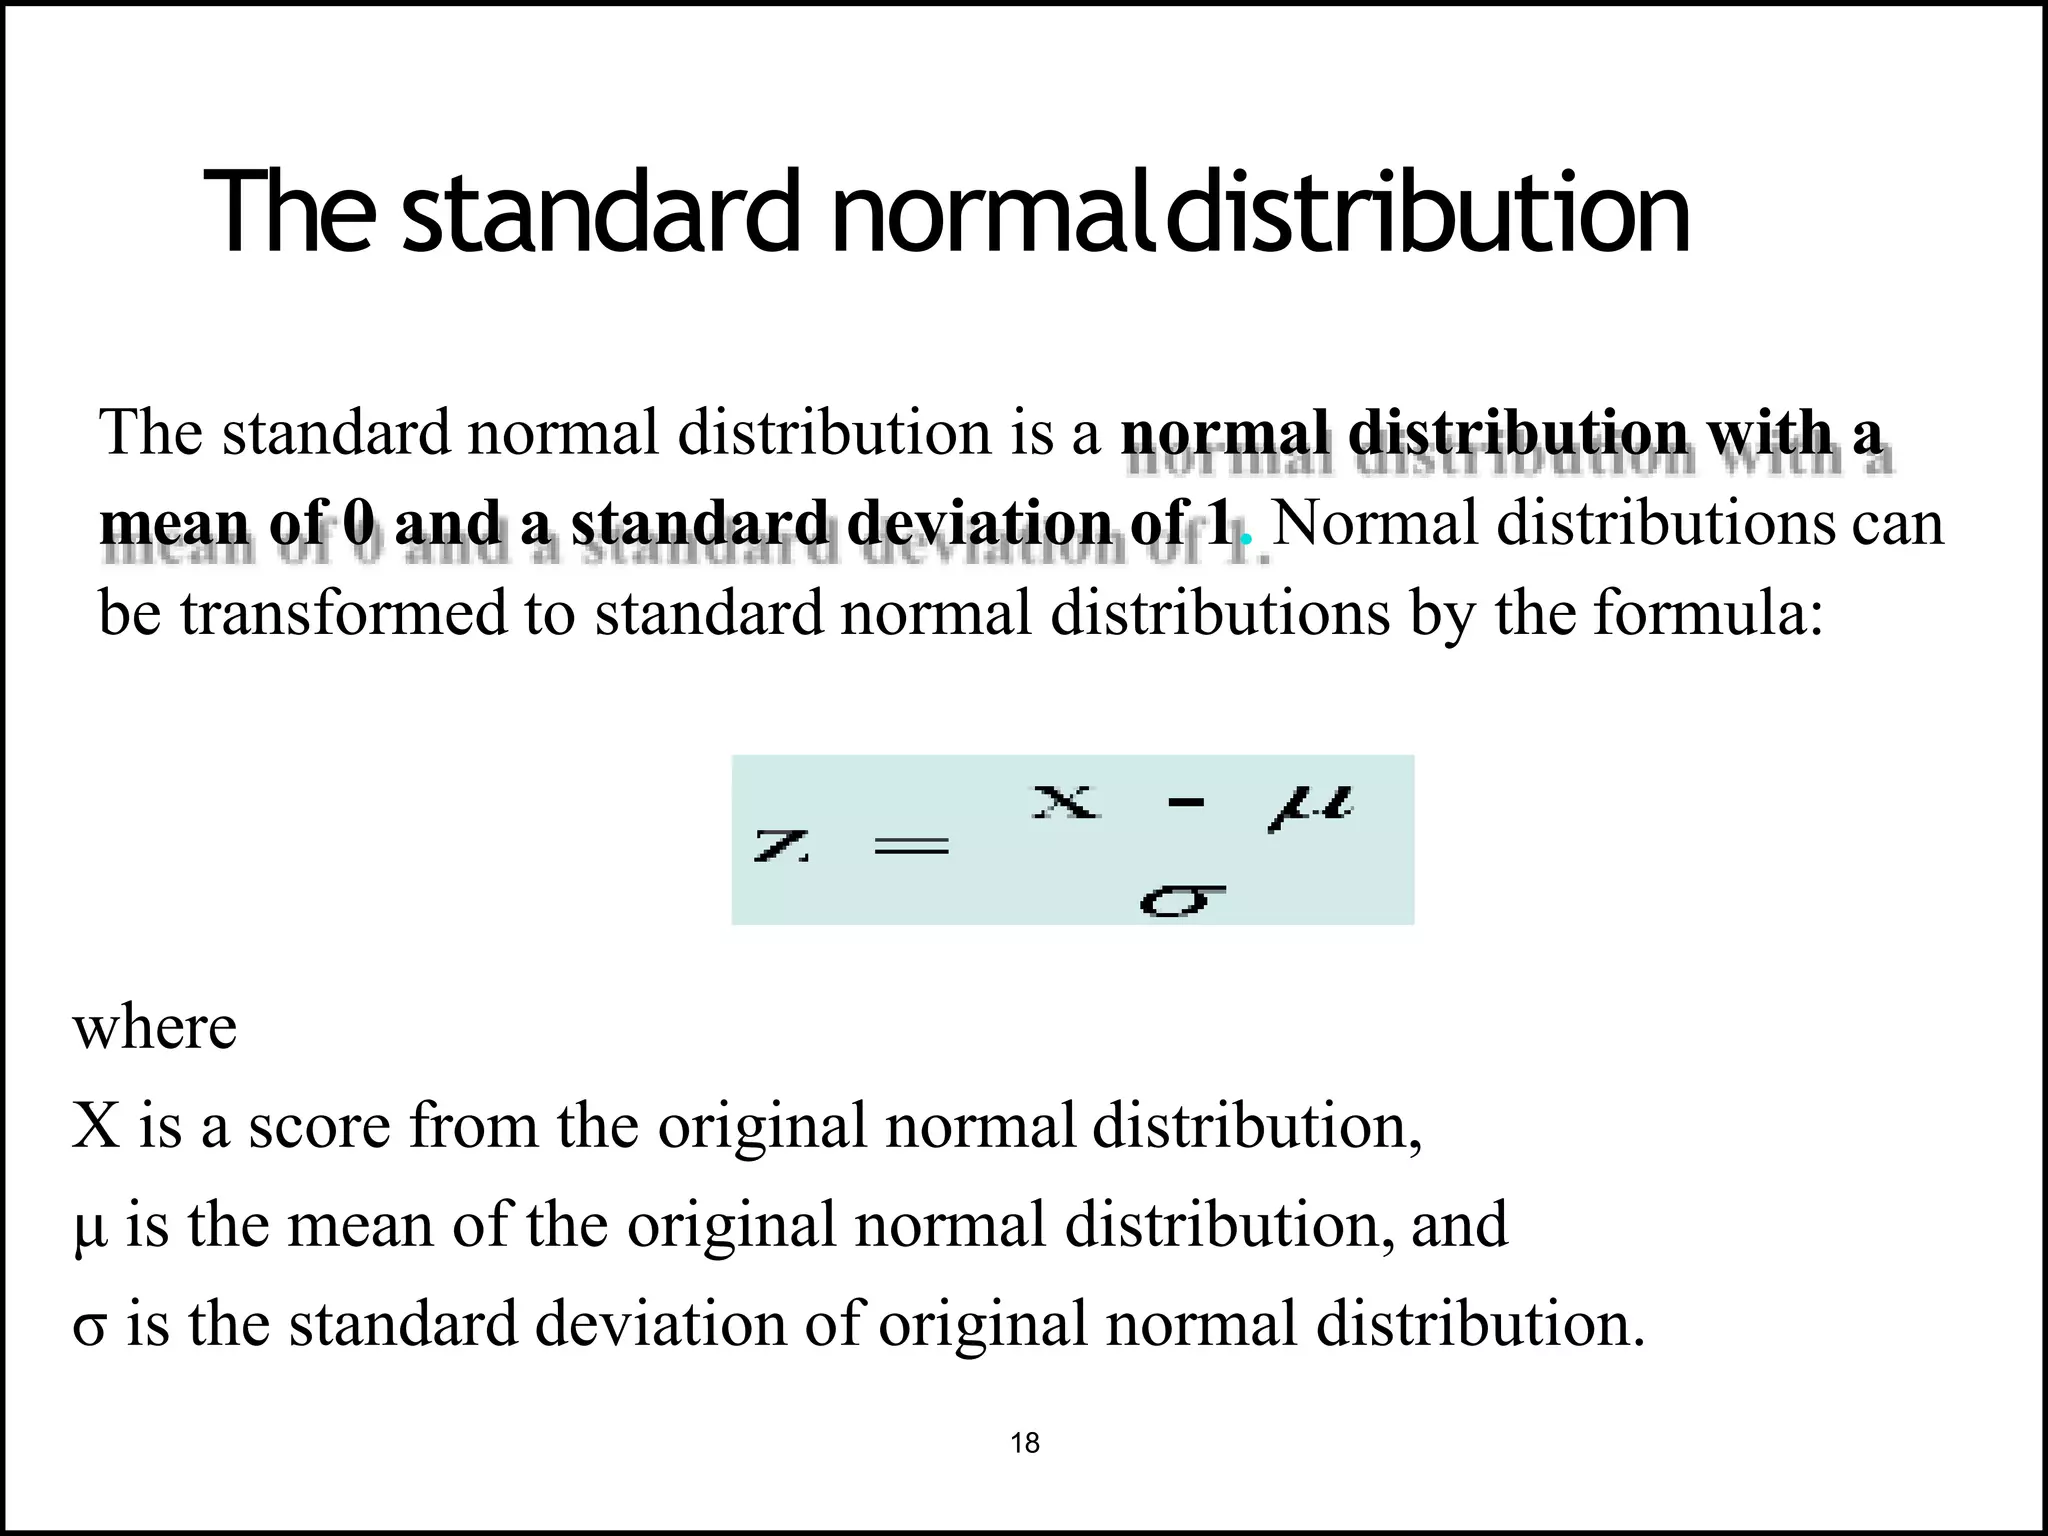
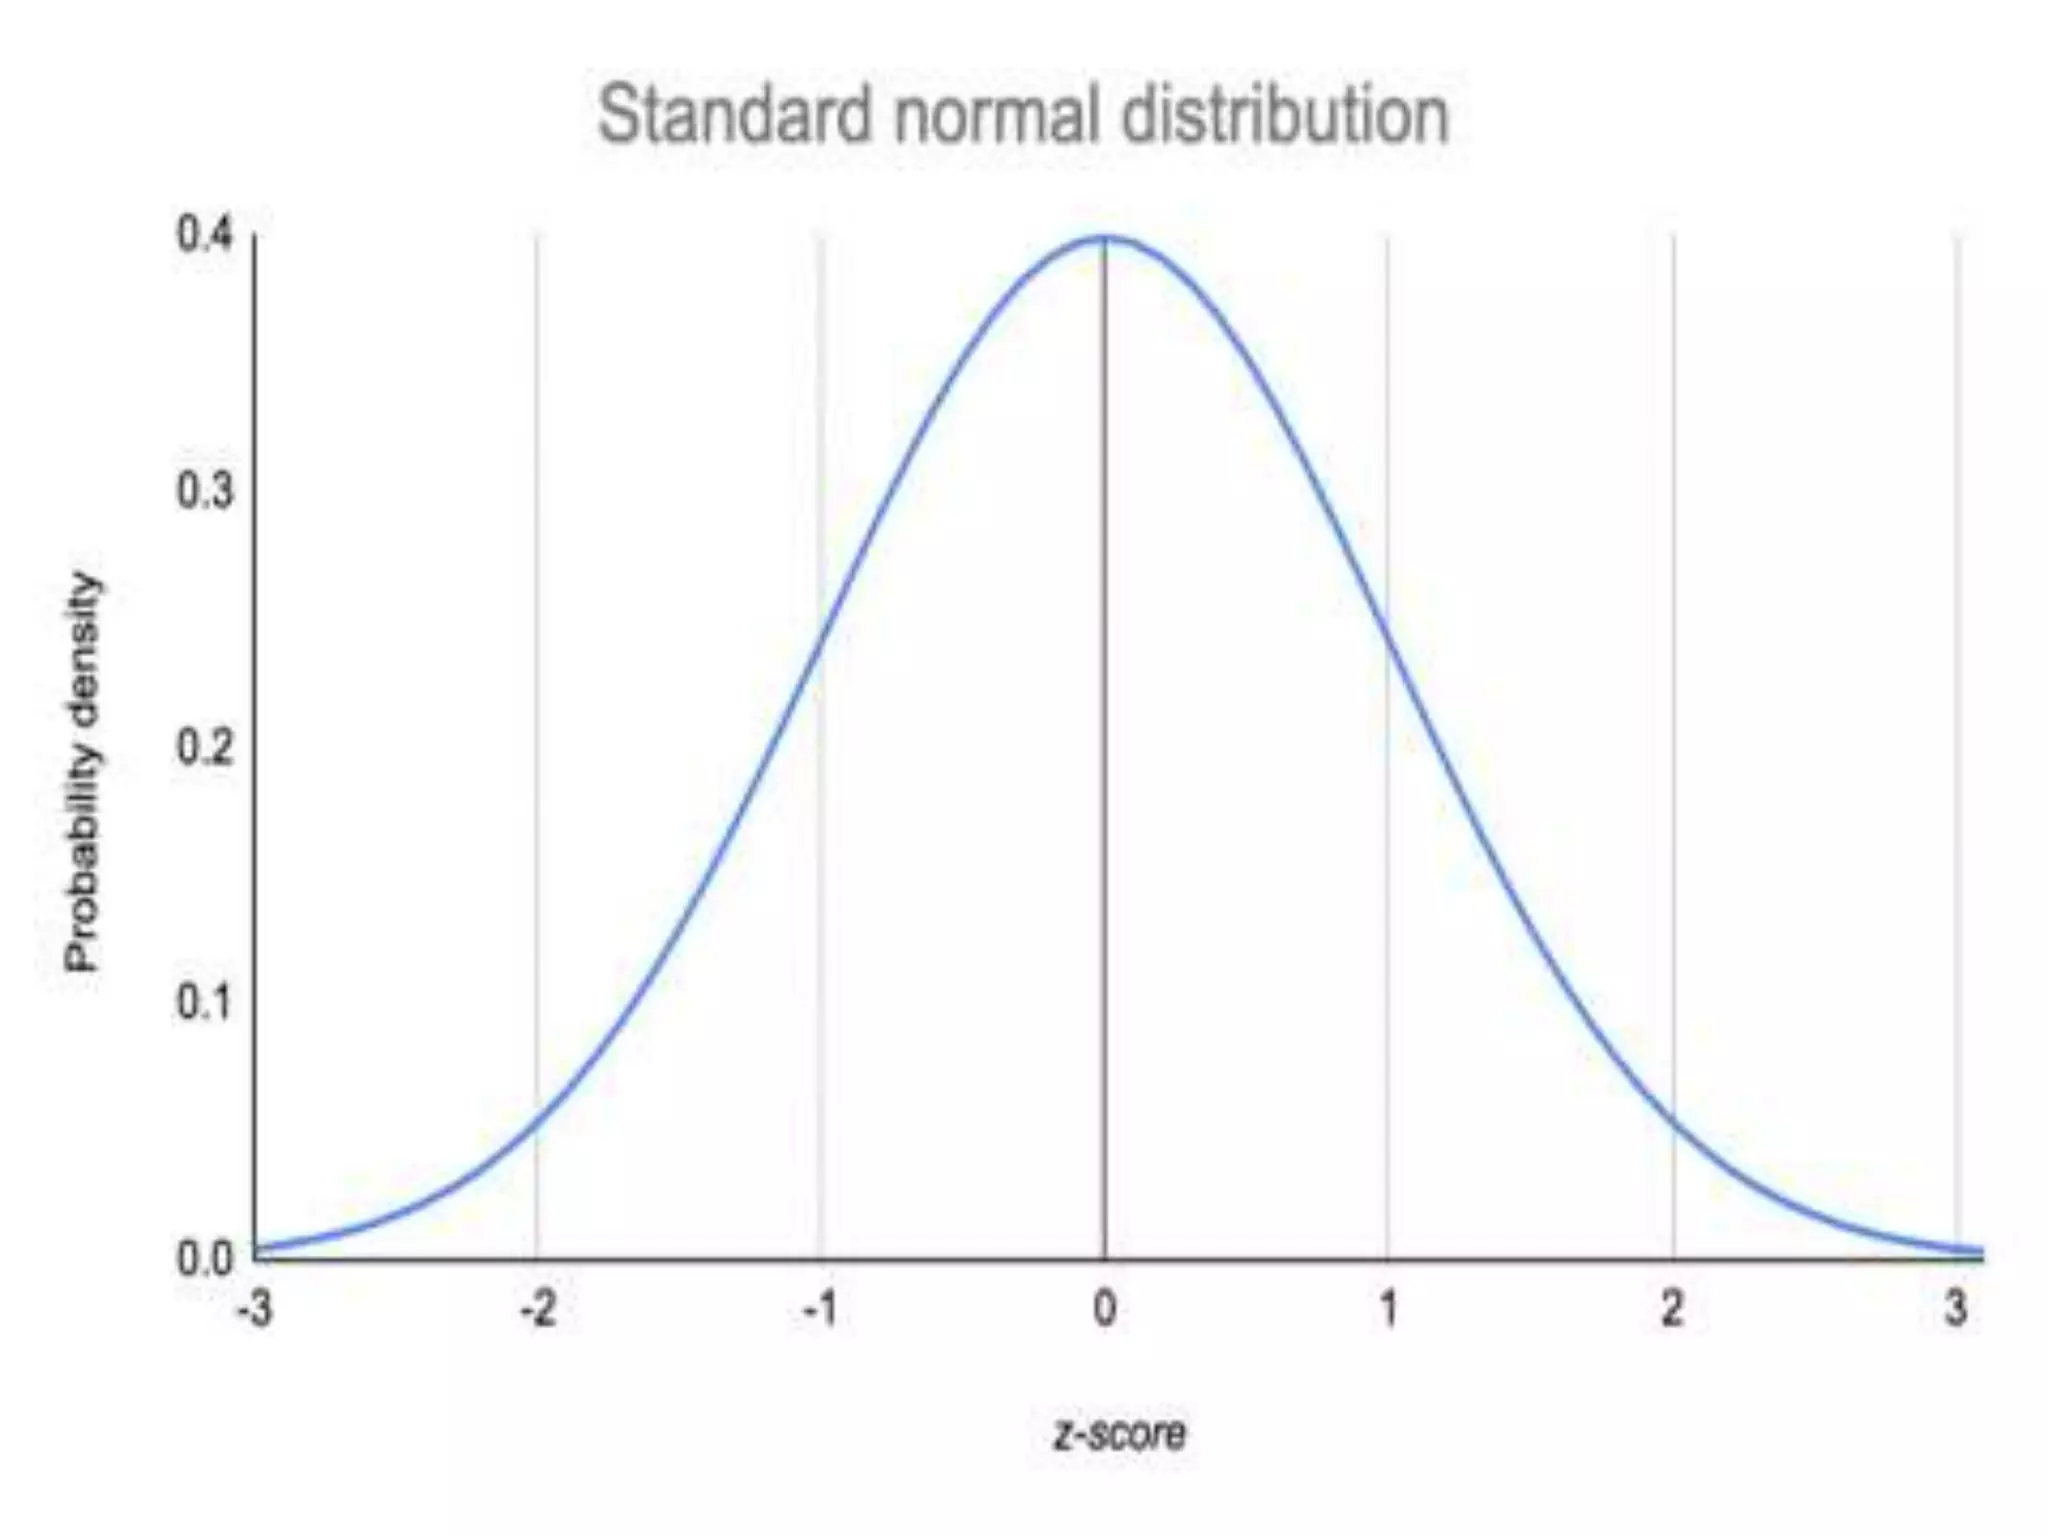
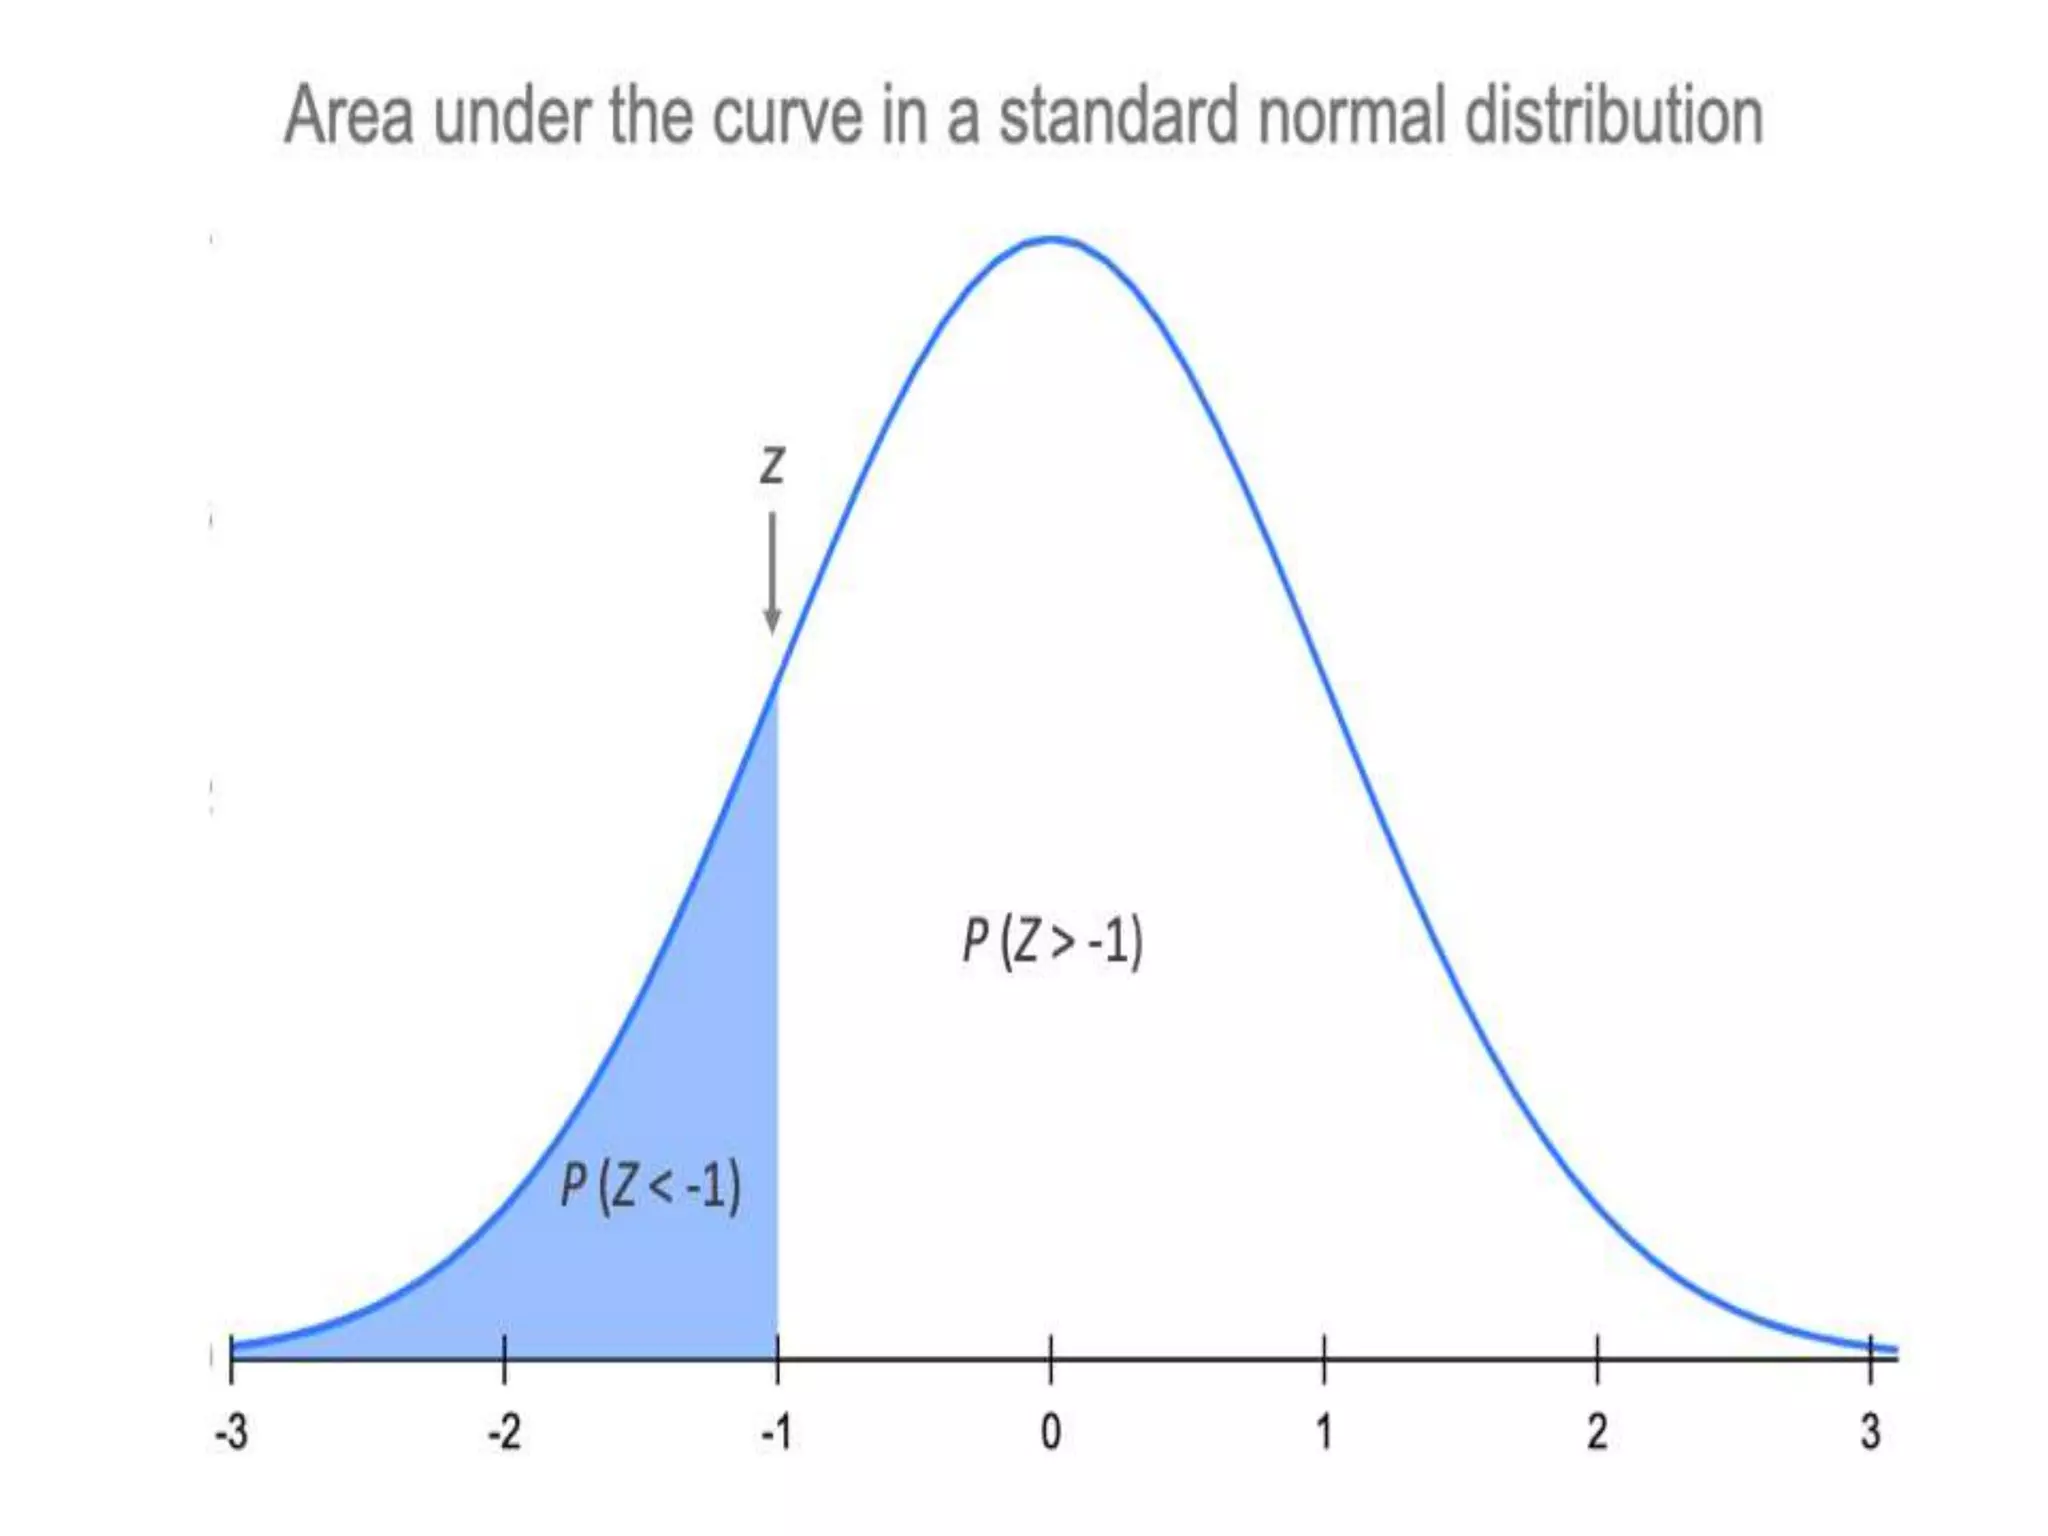
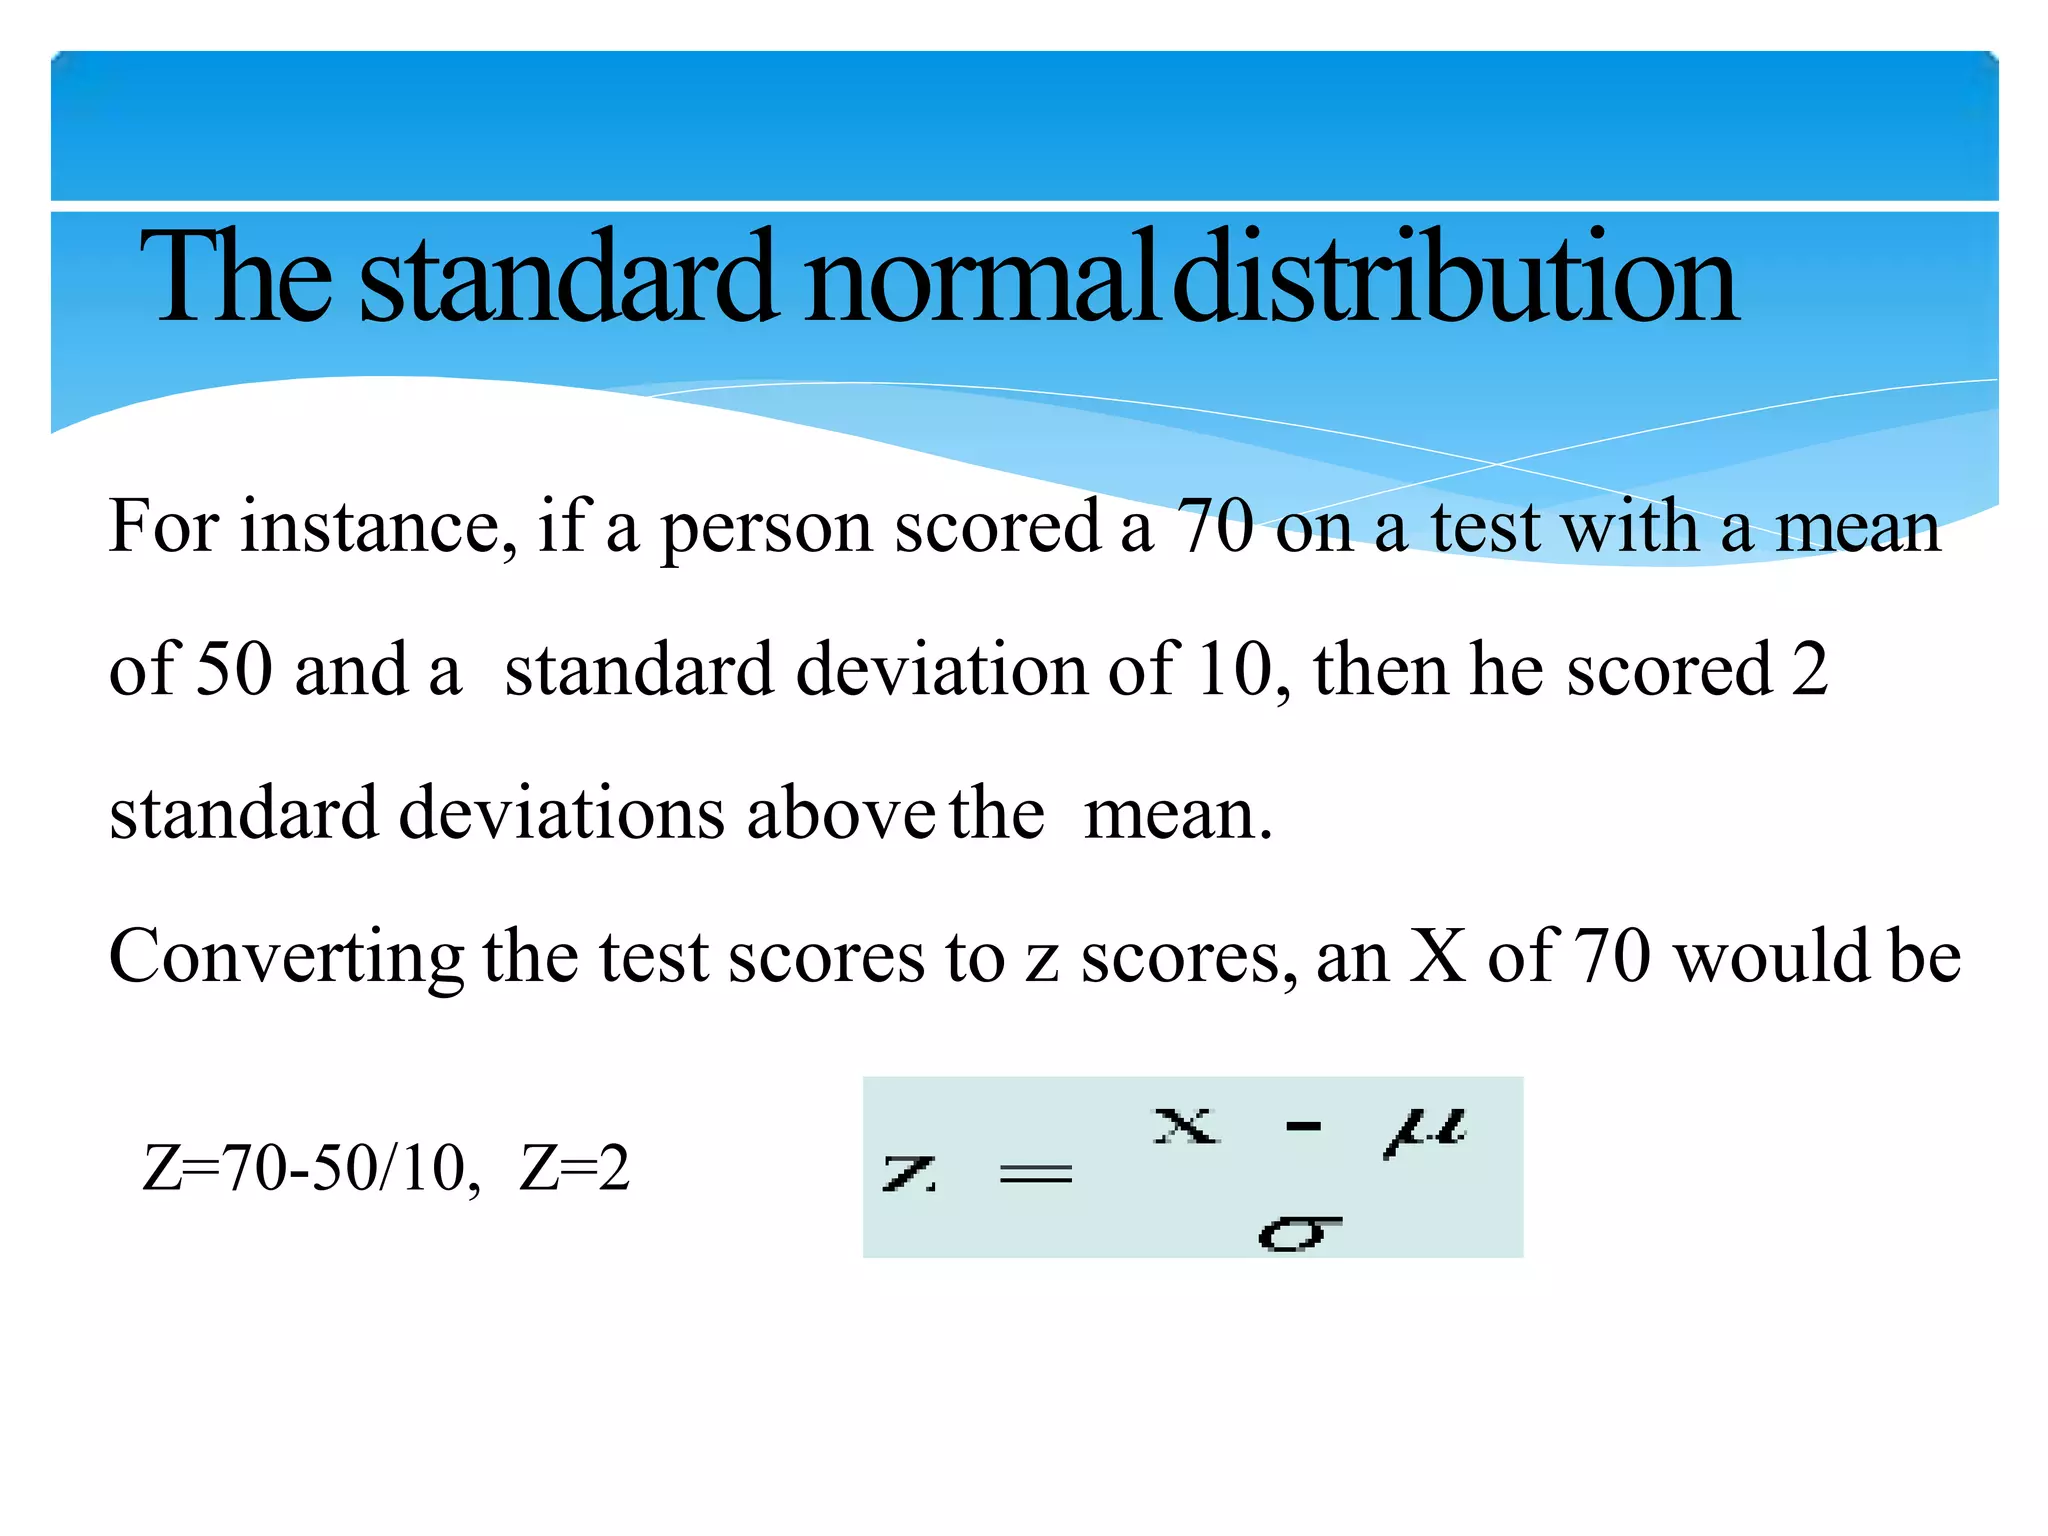
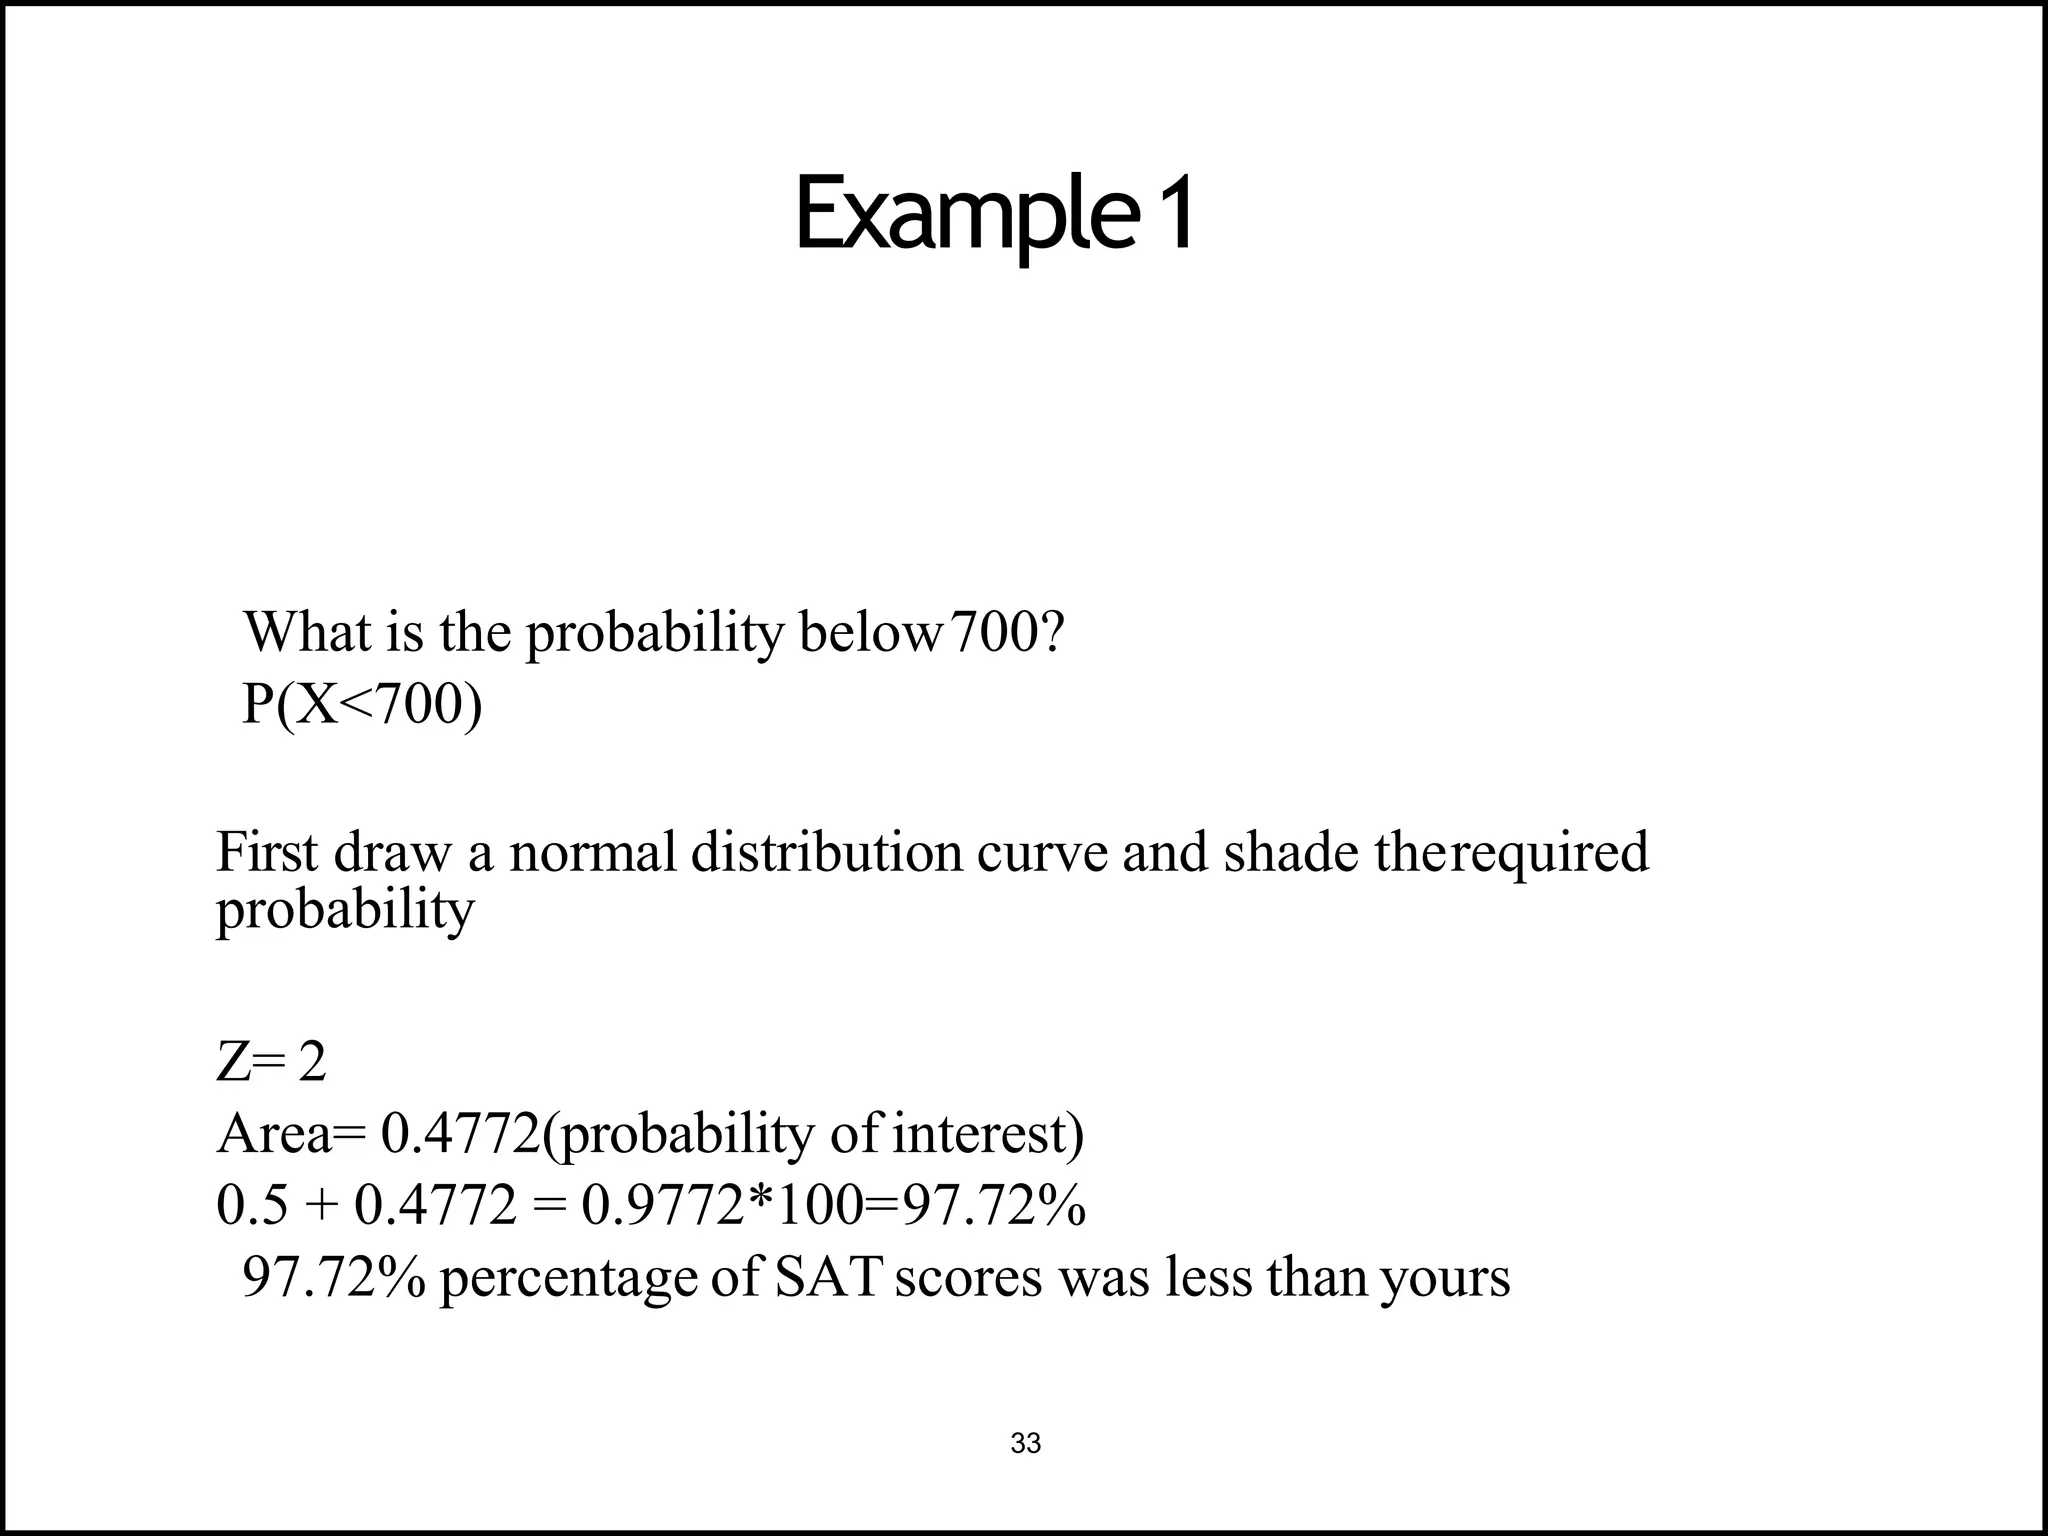
The Normal Distribution:
There are different distributions namely Normal, Skewed, and Binomial etc.
Objectives:
Normal distribution its properties its use in biostatistics
Transformation to standard normal distribution
Calculation of probabilities from standard normal distribution using Z table.
Normal distribution:
- Certain data, when graphed as a histogram (data on the horizontal axis, frequency on the vertical axis), creates a bell-shaped curve known as a normal curve, or normal distribution.
- Two parameters define the normal distribution, the mean (µ) and the standard deviation (σ).
Properties of the Normal Distribution:
Normal distributions are symmetrical with a single central peak at the mean (average) of the data.
The shape of the curve is described as bell-shaped with the graph falling off evenly on either side of the mean.
Fifty percent of the distribution lies to the left of the mean and fifty percent lies to the right of the mean.
-The mean, the median, and the mode fall in the same place. In a normal distribution the mean = the median = the mode.
- The spread of a normal distribution is controlled by the
standard deviation.
In all normal distributions the range ±3σ includes nearly
all cases (99%).
Uni modal:
One mode
Symmetrical:
Left and right halves are mirror images
Bell-shaped:
With maximum height at the mean, median, mode
Continuous:
There is a value of Y for every value of X
Asymptotic:
The farther the curve goes from the mean, the closer it gets to the X axis but it never touches it (or goes to 0).
The total area under a normal distribution curve is equal to 1.00, or 100%.
Using Normal distribution for finding probability:
While finding out the probability of any particular observation we find out the area under the curve which is covered by that particular observation. Which is always 0-1.
Transforming normal distribution to standard normal distribution:
Given the mean and standard deviation of a normal distribution the probability of occurrence can be worked out for any value.
But these would differ from one distribution to another because of differences in the numerical value of the means and standard deviations.
To get out of this problem it is necessary to find a common unit of measurement into which any score could be converted so that one table will do for all normal distributions.
This common unit is the standard normal distribution or Z
score and the table used for this is called Z table.
- A z score always reflects the number of standard deviations above or below the mean a particular score or value is.
where
X is a score from the original normal distribution,
μ is the mean of the original normal distribution, and
σ is the standard deviation of original normal distribution.
Steps for calculating probability using the Z-
score:
-Sketch a bell-shaped curve,
- Shade the area (which represents the probability)
-Use the Z-score formula to calculate Z-value(s)
-Look up Z-values in table
Presiding Officer Training module 2024 lok sabha elections
Lecture 4 The Normal Distribution.pptx
1.
2. The Normal Distribution
Shakir Rahman
BScN, MScN, MSc Applied Psychology, PhD Nursing (Candidate)
University of Minnesota USA.
Principal & Assistant Professor
Ayub International College of Nursing & AHS Peshawar
Visiting Faculty
Swabi College of Nursing & Health Sciences Swabi
Nowshera College of Nursing & Health Sciences Nowshera
2
3. There are different distributions namely
Normal, Skewed, and Binomial etc.
Wewill learn about:
- Normal distribution its properties its
usein biostatistics
- Transformation to standard normal
distribution
- Calculation of probabilities from standard
normal distribution using Z table
Gist of today’ssession
3
4. - Certain data, when graphed as a histogram (data on the horizontal
axis, frequency on the vertical axis), creates a bell-shaped curve
known as a normal curve, or normal distribution.
- Twoparameters define the normal distribution, the
mean (µ) and the standard deviation (σ).
Normaldistribution
4
5. 4
Normal Distributions
Byvarying the parameters and , we obtaindifferent
normal distributions
Thereareaninfinite number of normal distributions
6. Normal distributions are symmetrical with a single
central peak at the mean (average) of the data.
The shape of the curve is described as bell-shaped
with the graph falling off evenly on either side of the
mean.
Fifty percent of the distribution lies to the left of the
mean and fifty percent lies to the right of the mean.
Properties of the NormalDistribution
6
7. -The mean, the median, and the mode fall in the same
place. In a normal distribution the mean = the median =the
mode.
- The spread of a normal distribution is controlled bythe
standard deviation.
In all normal distributions the range ±3σ includesnearly
all cases (99%).
Properties of the NormalDistribution
7
8. Uni modal
One mode
Symmetrical
Left and right halves are mirrorimages
Bell-shaped
Withmaximum height at the mean, median, mode
Continuous
There is a value of Y for every value ofX
Asymptotic
The farther the curve goes from the mean, the closer it gets to the X axis
but it never touches it (or goes to 0)
7
Properties of the NormalDistribution
9. The total area under a normal distribution curveis
equal to 1.00, or100%
The MostImportant Property of
Normal Distribution
9
13. While finding out the probability of any
particular observation we find out the area
under the curve which is covered by that
particular observation. Which is always 0-1
Using Normal distributionfor
findingprobability
13
16. Given the mean and standard deviation of a normal
distribution the probability of occurrence can be
worked out for any value.
But these would differ from one distribution to
another because of differences in the numerical value
of the means and standard deviations.
Transforming normal distributionto
standard normaldistribution
16
17. - To get out of this problem it is necessary to find a common
unit of measurement into which any score could be converted
so that one table will do for all normaldistributions.
- This common unit is the standard normal distribution orZ
score and the table used for this is called Ztable.
- A z score always reflects the number of standard deviations
above or below the mean a particular score orvalueis.
Transforming normal distributionto
standard normaldistribution
17
18. The standard normal distribution is a normal distribution with a
mean of 0 and a standard deviation of 1. Normal distributions can
be transformed to standard normal distributions by the formula:
where
X is a score from the original normal distribution,
μ is the mean of the original normal distribution, and
σ is the standard deviation of original normal distribution.
The standard normaldistribution
18
19. -Sketch a bell-shaped curve, indicate the mean and the value(s) of x of
interest.
- Shade the area (which represents the probability) you are interested in
obtaining.
-Use the Z-score formula to calculate Z-value(s) for the value of X of
interested.
-Look up Z-values in table to find corresponding area(s). You need to use Z-
table.
- Calculate thearea
- Interpret thefindings 17
Stepsforcalculatingprobability using the Z-
score
23. Thestandard normaldistribution
For instance, if a person scored a 70 on a test with a mean
of 50 and a standard deviation of 10, then he scored 2
standard deviations abovethe mean.
Converting the test scores to z scores, an X of 70 would be
Z=70-50/10, Z=2
24. So, a z score of 2 means the original score was2
standard deviations above the mean.
Now we will refer to Z table for looking the
probability of the value.
(how many have scored 70) which is 0.4772 or
47.72%
The standard normaldistribution
24
25. Thestandard normaldistribution
•The area in front of 2.0 in z table is 0.4772
•This means that the probability or proportion of
people getting the score of 70 is 0.4772 or 47.72%
28. Scores on the verbal or math portion ofthe
post RN aptitude test are approximately
normally distributed with
mean µ = 500
standard deviation σ = 100.
The scores range from 200 to 800.
Example1
28
29. Example 1
If your score was x = 700, then find
How many standard deviations from the
mean was it?
What is the z-score for x = 700.
What percentage of SATscores was higher
than yours?
What is the cumulative probability below
700?
29
30. Example 1
If your verbal SATscore was x = 700, how many
standard deviations from the mean was it? Findthe
z-score for x = 700.
First draw a normal distribution curve andshade
the required probability , then change x in toz
So the verbal score 700 is 2 standarddeviation
away from mean and X 700 = Z2
100
z x - 700 - 500 2 = +2
30
32. What percentage of SAT scores was higher thanyours?
P (X= >700)
First draw a normal distribution curve and shade the required
probability.
As we know that Z= 2
Area for Z=2 = 0.4772(probability ofinterest)
0.5 - 0.4772 = 0.0228*100 =2.28%
2.28% percentage of SAT scores was higher than yours.
Example 1
32
33. What is the probability below700?
P(X<700)
First draw a normal distribution curve and shade therequired
probability
Z= 2
Area= 0.4772(probability of interest)
0.5 + 0.4772 = 0.9772*100=97.72%
97.72% percentage of SATscores was less than yours
Example1
33
34. Example of comparing an aptitude test scoresof
AKUSON and LNH
Mary’s AKU score is 26.
Jason’s LNH score is 900. Who did better?
The mean LNH score is 1000 with a standard deviation
of 100 points.
The mean AKU score is 22 with a standarddeviation
of 2 points.
Comparing variables with verydifferent
observed units ofmeasure
34
35. Let’s findthez-scores
Jason: 900-1000
Mary: 26-22
2
From these findings, we gather that Jason’s score is 1 standard
deviation below the mean SATscore and Mary’s score is 2standard
deviations above the meanACTscore.
Therefore,
Mary’s score is relatively better.
Zx =
100
Zx= =
= -1
+2
35
36. Bluman (2012). Elementary Statistics: A Step byStep
Approach (8th.). McGrawHill.
Daniel (2014). Biostatistics: Basic Concepts and
Methodology for the Health Sciences. NewYork:
John Wiley & Sons.
References
36
37. Acknowledgments
Dr Tazeen Saeed Ali
RM, RM, BScN, MSc ( Epidemiology & Biostatistics), Phd (Medical
Sciences), Post Doctorate (Health Policy & Planning)
Associate Dean School of Nursing & Midwifery
The Aga Khan University Karachi.
Kiran Ramzan Ali Lalani
BScN, MSc Epidemiology & Biostatistics
Registered Nurse (NICU)
Aga Khan University Hospital