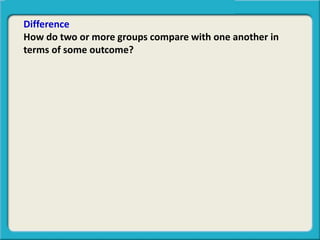
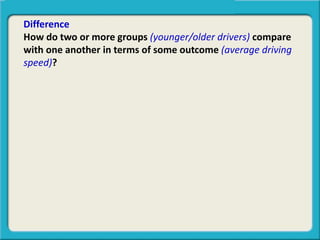
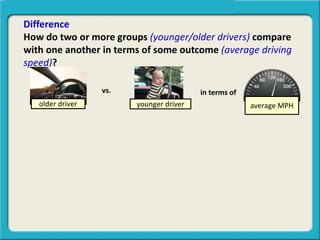
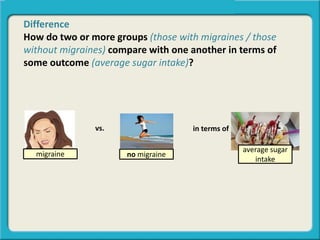
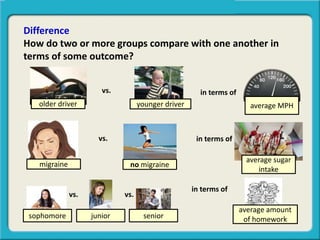
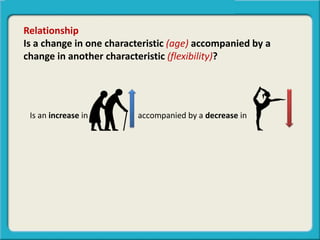
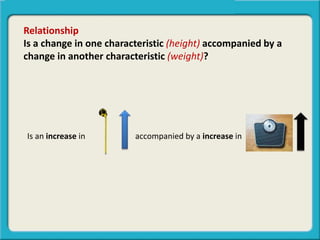
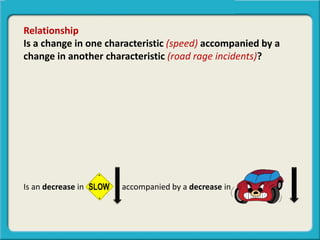
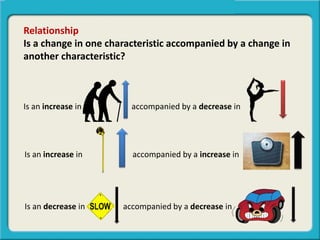
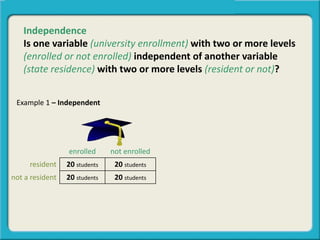
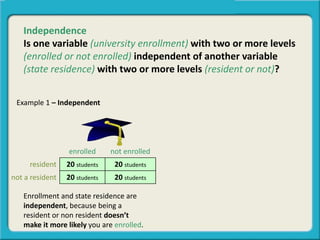
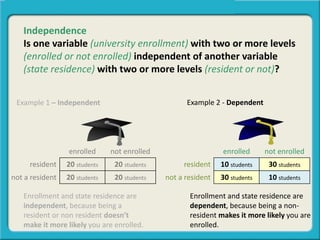
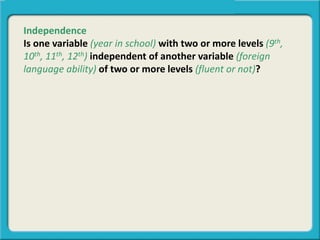
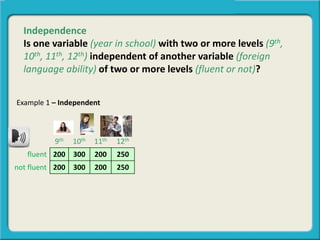
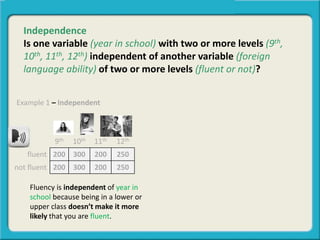
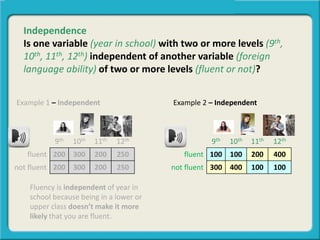
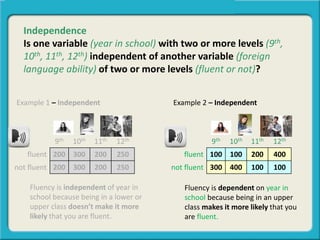
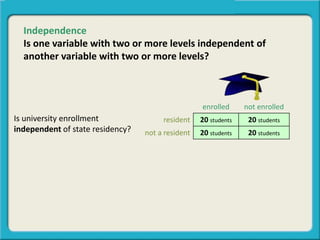
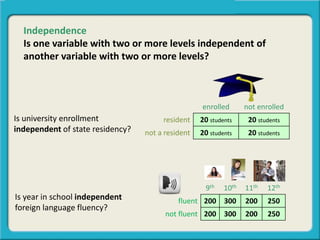
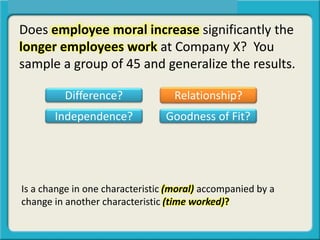
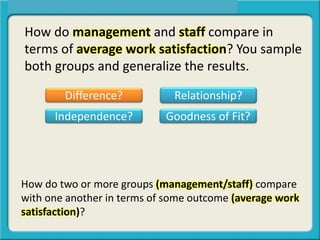
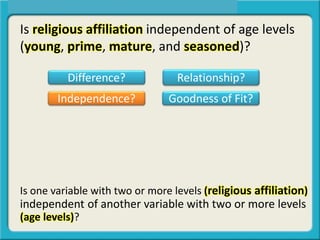
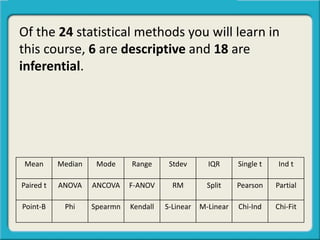
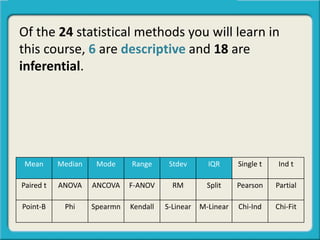
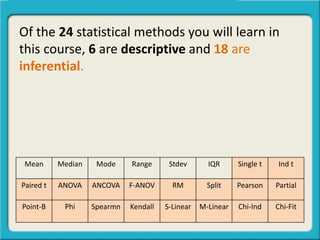
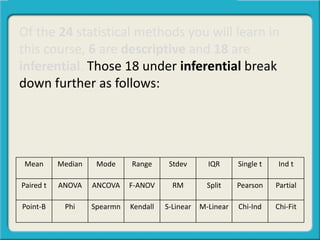
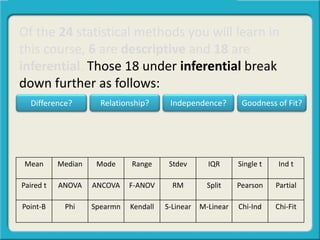
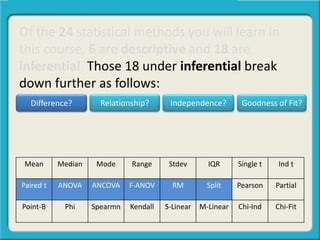
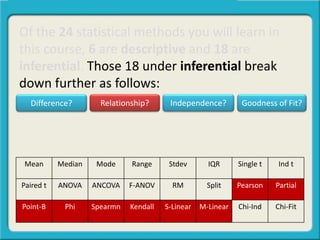
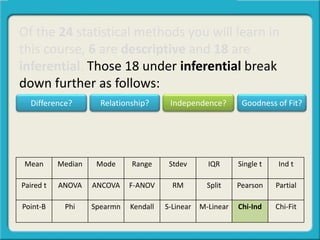
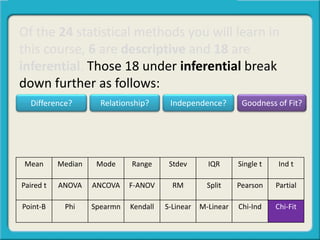
Is your question a question of:
Difference? Relationship?
Goodness of Fit?Independence?
Is your question a question of: Difference?
Difference
How do two or more groups compare with one another in
terms of some outcome?
Difference
How do two or more groups (younger/older drivers) compare
with one another in terms of some outcome (average driving
speed)?
Difference
How do two or more groups (younger/older drivers) compare
with one another in terms of some outcome (average driving
speed)?
vs.
average MPHolder driver younger driver
in terms of
Difference
How do two or more groups (those with migraines / those
without migraines) compare with one another in terms of
some outcome (average sugar intake)?
vs.
migraine no migraine
average sugar
intake
in terms of
Difference
How do two or more groups (sophomores/juniors/seniors)
compare with one another in terms of some outcome
(average amount of homework)?
sophomore
vs.
average amount
of homework
in terms of
junior senior
vs.
In summary
Difference
How do two or more groups compare with one another in
terms of some outcome?
vs.
average MPHolder driver younger driver
in terms of
vs.
migraine no migraine
average sugar
intake
in terms of
sophomore
vs.
average amount
of homework
in terms of
junior senior
vs.
Is your question a question of: Relationship?
Relationship
Is a change in one characteristic accompanied by a change in
another characteristic?
Relationship
Is a change in one characteristic (age) accompanied by a
change in another characteristic (flexibility)?
Relationship
Is a change in one characteristic (age) accompanied by a
change in another characteristic (flexibility)?
Is an increase in accompanied by a decrease in
Relationship
Is a change in one characteristic (height) accompanied by a
change in another characteristic (weight)?
Is an increase in accompanied by a increase in
Relationship
Is a change in one characteristic (speed) accompanied by a
change in another characteristic (road rage incidents)?
Is an decrease in accompanied by a decrease in
In summary
Relationship
Is a change in one characteristic accompanied by a change in
another characteristic?
Is an decrease in accompanied by a decrease in
Is an increase in accompanied by a increase in
Is an increase in accompanied by a decrease in
Is your question a question of: Independence?
Independence
Is one variable with two or more levels independent of
another variable with two or more levels?
Independence
Is one variable (university enrollment) with two or more levels
(enrolled or not enrolled) independent of another variable
(state residence) with two or more levels (resident or not)?
Example 1 – Independent
Independence
Is one variable (university enrollment) with two or more levels
(enrolled or not enrolled) independent of another variable
(state residence) with two or more levels (resident or not)?
enrolled not enrolled
resident 20 students 20 students
not a resident 20 students 20 students
Example 1 – Independent
Enrollment and state residence are
independent, because being a
resident or non resident doesn’t
make it more likely you are enrolled.
Independence
Is one variable (university enrollment) with two or more levels
(enrolled or not enrolled) independent of another variable
(state residence) with two or more levels (resident or not)?
enrolled not enrolled
resident 20 students 20 students
not a resident 20 students 20 students
enrolled not enrolled
resident 10 students 30 students
not a resident 30 students 10 students
Example 1 – Independent
Enrollment and state residence are
dependent, because being a non-
resident makes it more likely you are
enrolled.
Enrollment and state residence are
independent, because being a
resident or non resident doesn’t
make it more likely you are enrolled.
Example 2 - Dependent
Independence
Is one variable (university enrollment) with two or more levels
(enrolled or not enrolled) independent of another variable
(state residence) with two or more levels (resident or not)?
Independence
Is one variable (year in school) with two or more levels (9th,
10th, 11th, 12th) independent of another variable (foreign
language ability) of two or more levels (fluent or not)?
Independence
Is one variable (year in school) with two or more levels (9th,
10th, 11th, 12th) independent of another variable (foreign
language ability) of two or more levels (fluent or not)?
9th 10th 11th 12th
fluent 200 300 200 250
not fluent 200 300 200 250
Example 1 – Independent
Independence
Is one variable (year in school) with two or more levels (9th,
10th, 11th, 12th) independent of another variable (foreign
language ability) of two or more levels (fluent or not)?
9th 10th 11th 12th
fluent 200 300 200 250
not fluent 200 300 200 250
Example 1 – Independent
Fluency is independent of year in
school because being in a lower or
upper class doesn’t make it more
likely that you are fluent.
9th 10th 11th 12th
fluent 100 100 200 400
not fluent 300 400 100 100
Example 2 – Independent
Fluency is dependent on year in
school because being in an upper
class makes it more likely that you
are fluent.
In summary
Independence
Is one variable with two or more levels independent of
another variable with two or more levels?
Independence
Is one variable with two or more levels independent of
another variable with two or more levels?
enrolled not enrolled
resident 20 students 20 students
not a resident 20 students 20 students
Is university enrollment
independent of state residency?
Independence
Is one variable with two or more levels independent of
another variable with two or more levels?
9th 10th 11th 12th
fluent 200 300 200 250
not fluent 200 300 200 250
enrolled not enrolled
resident 20 students 20 students
not a resident 20 students 20 students
Is university enrollment
independent of state residency?
Is year in school independent
foreign language fluency?
Is your question a question of: Goodness of Fit?
Goodness of Fit
Does your claim fit reality?
(4 out of 5 dentist recommend flavored floss) (3 out of 5 of
your dentist friends recommend flavored floss)
Goodness of Fit
Does your claim (4 out of 5 dentist recommend flavored floss)
fit reality (3 out of 5 of your dentist friends recommend
flavored floss)?
Goodness of Fit
Does your claim (4 out of 5 dentist recommend flavored floss)
fit reality (3 out of 5 of your dentist friends recommend
flavored floss)?
Does the CLAIM . . . FIT REALITY?
4 out of 5
recommend
3 out of 5
recommend
Goodness of Fit
Does your claim (72% of the county will vote democrat) fit
reality (65% of the county actually voted democrat)?
Does the CLAIM . . . FIT REALITY?
65% 72%
18%35%
In summary
Goodness of Fit
Does your claim fit reality?
(4 out of 5 dentist recommend flavored floss) (3 out of 5 of
your dentist friends recommend flavored floss)
Goodness of Fit
Does your claim fit reality?
(4 out of 5 dentist recommend flavored floss) (3 out of 5 of
your dentist friends recommend flavored floss)
4 out of 5
recommend
3 out of 5
recommend
65% 72%
18%35%
The Claim The Reality
Final Summary
Final Summary
Difference – (average) between groups. vs.
Relationship – increase or decrease in two variables
Independence – two+ levels by two+ levels.
Does the CLAIM . . . FIT REALITY?
Goodness of Fit – claim versus reality
enrolled not enrolled
resident 20 students 20 students
not a resident 20 students 20 students
Let’s Practice!
Does employee moral increase significantly the
longer employees work at Company X? You
sample a group of 45 and generalize the results.
Difference? Relationship?
Independence? Goodness of Fit?
Does employee moral increase significantly the
longer employees work at Company X? You
sample a group of 45 and generalize the results.
Difference? Relationship?
Independence? Goodness of Fit?
Does employee moral increase significantly the
longer employees work at Company X? You
sample a group of 45 and generalize the results.
Difference? Relationship?
Independence? Goodness of Fit?
Does employee moral increase significantly the
longer employees work at Company X? You
sample a group of 45 and generalize the results.
Is a change in one characteristic (moral) accompanied by a
change in another characteristic (time worked)?
Difference? Relationship?
Independence? Goodness of Fit?
Next Example
How do management and staff compare in
terms of average work satisfaction? You sample
both groups and generalize the results.
Difference? Relationship?
Independence? Goodness of Fit?
How do management and staff compare in
terms of average work satisfaction? You sample
both groups and generalize the results.
Difference? Relationship?
Independence? Goodness of Fit?
How do management and staff compare in
terms of average work satisfaction? You sample
both groups and generalize the results.
Difference? Relationship?
Independence? Goodness of Fit?
How do management and staff compare in
terms of average work satisfaction? You sample
both groups and generalize the results.
Difference? Relationship?
Independence? Goodness of Fit?
How do two or more groups (management/staff) compare
with one another in terms of some outcome (average work
satisfaction)?
Next Example
A salesman claims that 95% of employees
increase their work productivity using his
software. You test that claim with a sample of 26
employees and find that 86% increase their
productivity.
Difference? Relationship?
Independence? Goodness of Fit?
A salesman claims that 95% of employees
increase their work productivity using his
software. You test that claim with a sample of 26
employees and find that 86% increase their
productivity.
Difference? Relationship?
Independence? Goodness of Fit?
A salesman claims that 95% of employees
increase their work productivity using his
software. You test that claim with a sample of
26 employees and find that 86% increase their
productivity.
Difference? Relationship?
Independence? Goodness of Fit?
A salesman claims that 95% of employees
increase their work productivity using his
software. You test that claim with a sample of
26 employees and find that 86% increase their
productivity.
Difference? Relationship?
Independence? Goodness of Fit?
Does your claim (95% increase work productivity) fit reality
(86% increase work productivity)?
Is religious affiliation independent of age levels
(young, prime, mature, and seasoned)?
Difference? Relationship?
Independence? Goodness of Fit?
Is religious affiliation independent of age levels
(young, prime, mature, and seasoned)?
Difference? Relationship?
Independence? Goodness of Fit?
Is religious affiliation independent of age levels
(young, prime, mature, and seasoned)?
Difference? Relationship?
Independence? Goodness of Fit?
Is religious affiliation independent of age levels
(young, prime, mature, and seasoned)?
Difference? Relationship?
Independence? Goodness of Fit?
Is one variable with two or more levels (religious affiliation)
independent of another variable with two or more levels
(age levels)?
Important Note
Of the 24 statistical methods you will learn in
this course, 6 are descriptive and 18 are
inferential.
Of the 24 statistical methods you will learn in
this course, 6 are descriptive and 18 are
inferential.
Mean Median Mode Range Stdev IQR Single t Ind t
Paired t ANOVA ANCOVA F-ANOV RM Split Pearson Partial
Point-B Phi Spearmn Kendall S-Linear M-Linear Chi-Ind Chi-Fit
Of the 24 statistical methods you will learn in
this course, 6 are descriptive and 18 are
inferential.
Mean Median Mode Range Stdev IQR Single t Ind t
Paired t ANOVA ANCOVA F-ANOV RM Split Pearson Partial
Point-B Phi Spearmn Kendall S-Linear M-Linear Chi-Ind Chi-Fit
Of the 24 statistical methods you will learn in
this course, 6 are descriptive and 18 are
inferential.
Mean Median Mode Range Stdev IQR Single t Ind t
Paired t ANOVA ANCOVA F-ANOV RM Split Pearson Partial
Point-B Phi Spearmn Kendall S-Linear M-Linear Chi-Ind Chi-Fit
Of the 24 statistical methods you will learn in
this course, 6 are descriptive and 18 are
inferential. Those 18 under inferential break
down further as follows:
Mean Median Mode Range Stdev IQR Single t Ind t
Paired t ANOVA ANCOVA F-ANOV RM Split Pearson Partial
Point-B Phi Spearmn Kendall S-Linear M-Linear Chi-Ind Chi-Fit
Difference? Relationship? Goodness of Fit?Independence?
Is your question a question of:
Difference? Relationship?
Goodness of Fit?Independence?

Diff rel ind-fit practice - Copyright Updated

  • 1.
    Is your questiona question of: Difference? Relationship? Goodness of Fit?Independence?
  • 2.
    Is your questiona question of: Difference?
  • 3.
    Difference How do twoor more groups compare with one another in terms of some outcome?
  • 4.
    Difference How do twoor more groups (younger/older drivers) compare with one another in terms of some outcome (average driving speed)?
  • 5.
    Difference How do twoor more groups (younger/older drivers) compare with one another in terms of some outcome (average driving speed)? vs. average MPHolder driver younger driver in terms of
  • 6.
    Difference How do twoor more groups (those with migraines / those without migraines) compare with one another in terms of some outcome (average sugar intake)? vs. migraine no migraine average sugar intake in terms of
  • 7.
    Difference How do twoor more groups (sophomores/juniors/seniors) compare with one another in terms of some outcome (average amount of homework)? sophomore vs. average amount of homework in terms of junior senior vs.
  • 8.
  • 9.
    Difference How do twoor more groups compare with one another in terms of some outcome? vs. average MPHolder driver younger driver in terms of vs. migraine no migraine average sugar intake in terms of sophomore vs. average amount of homework in terms of junior senior vs.
  • 10.
    Is your questiona question of: Relationship?
  • 11.
    Relationship Is a changein one characteristic accompanied by a change in another characteristic?
  • 12.
    Relationship Is a changein one characteristic (age) accompanied by a change in another characteristic (flexibility)?
  • 13.
    Relationship Is a changein one characteristic (age) accompanied by a change in another characteristic (flexibility)? Is an increase in accompanied by a decrease in
  • 14.
    Relationship Is a changein one characteristic (height) accompanied by a change in another characteristic (weight)? Is an increase in accompanied by a increase in
  • 15.
    Relationship Is a changein one characteristic (speed) accompanied by a change in another characteristic (road rage incidents)? Is an decrease in accompanied by a decrease in
  • 16.
  • 17.
    Relationship Is a changein one characteristic accompanied by a change in another characteristic? Is an decrease in accompanied by a decrease in Is an increase in accompanied by a increase in Is an increase in accompanied by a decrease in
  • 18.
    Is your questiona question of: Independence?
  • 19.
    Independence Is one variablewith two or more levels independent of another variable with two or more levels?
  • 20.
    Independence Is one variable(university enrollment) with two or more levels (enrolled or not enrolled) independent of another variable (state residence) with two or more levels (resident or not)?
  • 21.
    Example 1 –Independent Independence Is one variable (university enrollment) with two or more levels (enrolled or not enrolled) independent of another variable (state residence) with two or more levels (resident or not)?
  • 22.
    enrolled not enrolled resident20 students 20 students not a resident 20 students 20 students Example 1 – Independent Independence Is one variable (university enrollment) with two or more levels (enrolled or not enrolled) independent of another variable (state residence) with two or more levels (resident or not)?
  • 23.
    enrolled not enrolled resident20 students 20 students not a resident 20 students 20 students Example 1 – Independent Enrollment and state residence are independent, because being a resident or non resident doesn’t make it more likely you are enrolled. Independence Is one variable (university enrollment) with two or more levels (enrolled or not enrolled) independent of another variable (state residence) with two or more levels (resident or not)?
  • 24.
    enrolled not enrolled resident20 students 20 students not a resident 20 students 20 students enrolled not enrolled resident 10 students 30 students not a resident 30 students 10 students Example 1 – Independent Enrollment and state residence are dependent, because being a non- resident makes it more likely you are enrolled. Enrollment and state residence are independent, because being a resident or non resident doesn’t make it more likely you are enrolled. Example 2 - Dependent Independence Is one variable (university enrollment) with two or more levels (enrolled or not enrolled) independent of another variable (state residence) with two or more levels (resident or not)?
  • 25.
    Independence Is one variable(year in school) with two or more levels (9th, 10th, 11th, 12th) independent of another variable (foreign language ability) of two or more levels (fluent or not)?
  • 26.
    Independence Is one variable(year in school) with two or more levels (9th, 10th, 11th, 12th) independent of another variable (foreign language ability) of two or more levels (fluent or not)? 9th 10th 11th 12th fluent 200 300 200 250 not fluent 200 300 200 250 Example 1 – Independent
  • 27.
    Independence Is one variable(year in school) with two or more levels (9th, 10th, 11th, 12th) independent of another variable (foreign language ability) of two or more levels (fluent or not)? 9th 10th 11th 12th fluent 200 300 200 250 not fluent 200 300 200 250 Example 1 – Independent Fluency is independent of year in school because being in a lower or upper class doesn’t make it more likely that you are fluent.
  • 28.
    Independence Is one variable(year in school) with two or more levels (9th, 10th, 11th, 12th) independent of another variable (foreign language ability) of two or more levels (fluent or not)? 9th 10th 11th 12th fluent 200 300 200 250 not fluent 200 300 200 250 Example 1 – Independent Fluency is independent of year in school because being in a lower or upper class doesn’t make it more likely that you are fluent. 9th 10th 11th 12th fluent 100 100 200 400 not fluent 300 400 100 100 Example 2 – Independent
  • 29.
    Independence Is one variable(year in school) with two or more levels (9th, 10th, 11th, 12th) independent of another variable (foreign language ability) of two or more levels (fluent or not)? 9th 10th 11th 12th fluent 200 300 200 250 not fluent 200 300 200 250 Example 1 – Independent Fluency is independent of year in school because being in a lower or upper class doesn’t make it more likely that you are fluent. 9th 10th 11th 12th fluent 100 100 200 400 not fluent 300 400 100 100 Example 2 – Independent Fluency is dependent on year in school because being in an upper class makes it more likely that you are fluent.
  • 30.
  • 31.
    Independence Is one variablewith two or more levels independent of another variable with two or more levels?
  • 32.
    Independence Is one variablewith two or more levels independent of another variable with two or more levels? enrolled not enrolled resident 20 students 20 students not a resident 20 students 20 students Is university enrollment independent of state residency?
  • 33.
    Independence Is one variablewith two or more levels independent of another variable with two or more levels? 9th 10th 11th 12th fluent 200 300 200 250 not fluent 200 300 200 250 enrolled not enrolled resident 20 students 20 students not a resident 20 students 20 students Is university enrollment independent of state residency? Is year in school independent foreign language fluency?
  • 34.
    Is your questiona question of: Goodness of Fit?
  • 35.
    Goodness of Fit Doesyour claim fit reality? (4 out of 5 dentist recommend flavored floss) (3 out of 5 of your dentist friends recommend flavored floss)
  • 36.
    Goodness of Fit Doesyour claim (4 out of 5 dentist recommend flavored floss) fit reality (3 out of 5 of your dentist friends recommend flavored floss)?
  • 37.
    Goodness of Fit Doesyour claim (4 out of 5 dentist recommend flavored floss) fit reality (3 out of 5 of your dentist friends recommend flavored floss)? Does the CLAIM . . . FIT REALITY? 4 out of 5 recommend 3 out of 5 recommend
  • 38.
    Goodness of Fit Doesyour claim (72% of the county will vote democrat) fit reality (65% of the county actually voted democrat)? Does the CLAIM . . . FIT REALITY? 65% 72% 18%35%
  • 39.
  • 40.
    Goodness of Fit Doesyour claim fit reality? (4 out of 5 dentist recommend flavored floss) (3 out of 5 of your dentist friends recommend flavored floss)
  • 41.
    Goodness of Fit Doesyour claim fit reality? (4 out of 5 dentist recommend flavored floss) (3 out of 5 of your dentist friends recommend flavored floss) 4 out of 5 recommend 3 out of 5 recommend 65% 72% 18%35% The Claim The Reality The Claim The Reality
  • 42.
  • 43.
    Final Summary Difference –(average) between groups. vs. Relationship – increase or decrease in two variables Independence – two+ levels by two+ levels. Does the CLAIM . . . FIT REALITY? Goodness of Fit – claim versus reality enrolled not enrolled resident 20 students 20 students not a resident 20 students 20 students
  • 44.
  • 45.
    Does employee moralincrease significantly the longer employees work at Company X? You sample a group of 45 and generalize the results. Difference? Relationship? Independence? Goodness of Fit?
  • 46.
    Does employee moralincrease significantly the longer employees work at Company X? You sample a group of 45 and generalize the results. Difference? Relationship? Independence? Goodness of Fit?
  • 47.
    Does employee moralincrease significantly the longer employees work at Company X? You sample a group of 45 and generalize the results. Difference? Relationship? Independence? Goodness of Fit?
  • 48.
    Does employee moralincrease significantly the longer employees work at Company X? You sample a group of 45 and generalize the results. Is a change in one characteristic (moral) accompanied by a change in another characteristic (time worked)? Difference? Relationship? Independence? Goodness of Fit?
  • 49.
  • 50.
    How do managementand staff compare in terms of average work satisfaction? You sample both groups and generalize the results. Difference? Relationship? Independence? Goodness of Fit?
  • 51.
    How do managementand staff compare in terms of average work satisfaction? You sample both groups and generalize the results. Difference? Relationship? Independence? Goodness of Fit?
  • 52.
    How do managementand staff compare in terms of average work satisfaction? You sample both groups and generalize the results. Difference? Relationship? Independence? Goodness of Fit?
  • 53.
    How do managementand staff compare in terms of average work satisfaction? You sample both groups and generalize the results. Difference? Relationship? Independence? Goodness of Fit? How do two or more groups (management/staff) compare with one another in terms of some outcome (average work satisfaction)?
  • 54.
  • 55.
    A salesman claimsthat 95% of employees increase their work productivity using his software. You test that claim with a sample of 26 employees and find that 86% increase their productivity. Difference? Relationship? Independence? Goodness of Fit?
  • 56.
    A salesman claimsthat 95% of employees increase their work productivity using his software. You test that claim with a sample of 26 employees and find that 86% increase their productivity. Difference? Relationship? Independence? Goodness of Fit?
  • 57.
    A salesman claimsthat 95% of employees increase their work productivity using his software. You test that claim with a sample of 26 employees and find that 86% increase their productivity. Difference? Relationship? Independence? Goodness of Fit?
  • 58.
    A salesman claimsthat 95% of employees increase their work productivity using his software. You test that claim with a sample of 26 employees and find that 86% increase their productivity. Difference? Relationship? Independence? Goodness of Fit? Does your claim (95% increase work productivity) fit reality (86% increase work productivity)?
  • 59.
    Is religious affiliationindependent of age levels (young, prime, mature, and seasoned)? Difference? Relationship? Independence? Goodness of Fit?
  • 60.
    Is religious affiliationindependent of age levels (young, prime, mature, and seasoned)? Difference? Relationship? Independence? Goodness of Fit?
  • 61.
    Is religious affiliationindependent of age levels (young, prime, mature, and seasoned)? Difference? Relationship? Independence? Goodness of Fit?
  • 62.
    Is religious affiliationindependent of age levels (young, prime, mature, and seasoned)? Difference? Relationship? Independence? Goodness of Fit? Is one variable with two or more levels (religious affiliation) independent of another variable with two or more levels (age levels)?
  • 63.
  • 64.
    Of the 24statistical methods you will learn in this course, 6 are descriptive and 18 are inferential.
  • 65.
    Of the 24statistical methods you will learn in this course, 6 are descriptive and 18 are inferential. Mean Median Mode Range Stdev IQR Single t Ind t Paired t ANOVA ANCOVA F-ANOV RM Split Pearson Partial Point-B Phi Spearmn Kendall S-Linear M-Linear Chi-Ind Chi-Fit
  • 66.
    Of the 24statistical methods you will learn in this course, 6 are descriptive and 18 are inferential. Mean Median Mode Range Stdev IQR Single t Ind t Paired t ANOVA ANCOVA F-ANOV RM Split Pearson Partial Point-B Phi Spearmn Kendall S-Linear M-Linear Chi-Ind Chi-Fit
  • 67.
    Of the 24statistical methods you will learn in this course, 6 are descriptive and 18 are inferential. Mean Median Mode Range Stdev IQR Single t Ind t Paired t ANOVA ANCOVA F-ANOV RM Split Pearson Partial Point-B Phi Spearmn Kendall S-Linear M-Linear Chi-Ind Chi-Fit
  • 68.
    Of the 24statistical methods you will learn in this course, 6 are descriptive and 18 are inferential. Those 18 under inferential break down further as follows: Mean Median Mode Range Stdev IQR Single t Ind t Paired t ANOVA ANCOVA F-ANOV RM Split Pearson Partial Point-B Phi Spearmn Kendall S-Linear M-Linear Chi-Ind Chi-Fit
  • 69.
    Of the 24statistical methods you will learn in this course, 6 are descriptive and 18 are inferential. Those 18 under inferential break down further as follows: Mean Median Mode Range Stdev IQR Single t Ind t Paired t ANOVA ANCOVA F-ANOV RM Split Pearson Partial Point-B Phi Spearmn Kendall S-Linear M-Linear Chi-Ind Chi-Fit Difference? Relationship? Goodness of Fit?Independence?
  • 70.
    Of the 24statistical methods you will learn in this course, 6 are descriptive and 18 are inferential. Those 18 under inferential break down further as follows: Mean Median Mode Range Stdev IQR Single t Ind t Paired t ANOVA ANCOVA F-ANOV RM Split Pearson Partial Point-B Phi Spearmn Kendall S-Linear M-Linear Chi-Ind Chi-Fit Difference? Relationship? Goodness of Fit?Independence?
  • 71.
    Of the 24statistical methods you will learn in this course, 6 are descriptive and 18 are inferential. Those 18 under inferential break down further as follows: Mean Median Mode Range Stdev IQR Single t Ind t Paired t ANOVA ANCOVA F-ANOV RM Split Pearson Partial Point-B Phi Spearmn Kendall S-Linear M-Linear Chi-Ind Chi-Fit Difference? Relationship? Goodness of Fit?Independence?
  • 72.
    Of the 24statistical methods you will learn in this course, 6 are descriptive and 18 are inferential. Those 18 under inferential break down further as follows: Mean Median Mode Range Stdev IQR Single t Ind t Paired t ANOVA ANCOVA F-ANOV RM Split Pearson Partial Point-B Phi Spearmn Kendall S-Linear M-Linear Chi-Ind Chi-Fit Difference? Relationship? Goodness of Fit?Independence?
  • 73.
    Of the 24statistical methods you will learn in this course, 6 are descriptive and 18 are inferential. Those 18 under inferential break down further as follows: Mean Median Mode Range Stdev IQR Single t Ind t Paired t ANOVA ANCOVA F-ANOV RM Split Pearson Partial Point-B Phi Spearmn Kendall S-Linear M-Linear Chi-Ind Chi-Fit Difference? Relationship? Goodness of Fit?Independence?
  • 74.
    Is your questiona question of: Difference? Relationship? Goodness of Fit?Independence?

Editor's Notes