Downloaded 601 times


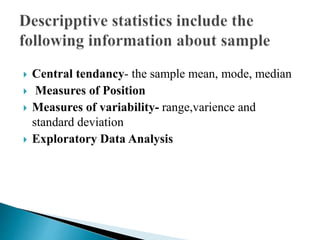

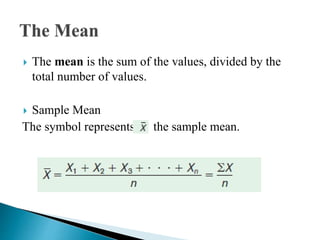


This document discusses descriptive statistics and analysis. It provides definitions of key terms like data, variable, statistic, and parameter. It also describes common measures of central tendency like mean, median and mode. Additionally, it covers measures of variability such as range, variance and standard deviation. Various graphical and numerical methods for summarizing and presenting sample data are presented, including tables, charts and distributions.


