


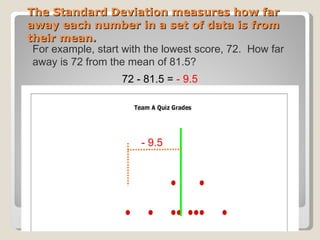


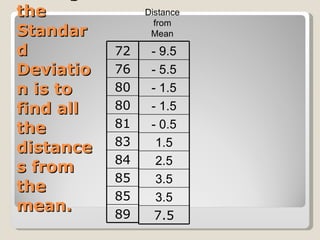


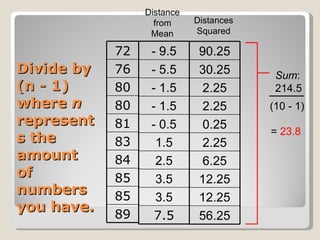


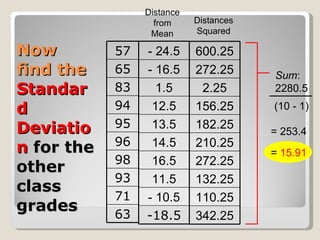
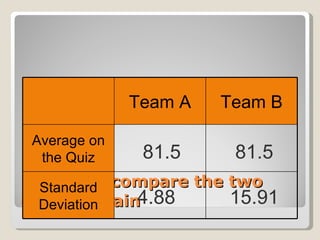

The document discusses using standard deviation to analyze how spread out data is from the mean. It provides an example of two classes that had the same average quiz score but different standard deviations, indicating the scores were more varied in one class than the other. Standard deviation is calculated by taking the square root of the average of the squared distances from the mean, providing a measure of how concentrated or dispersed the data is.


