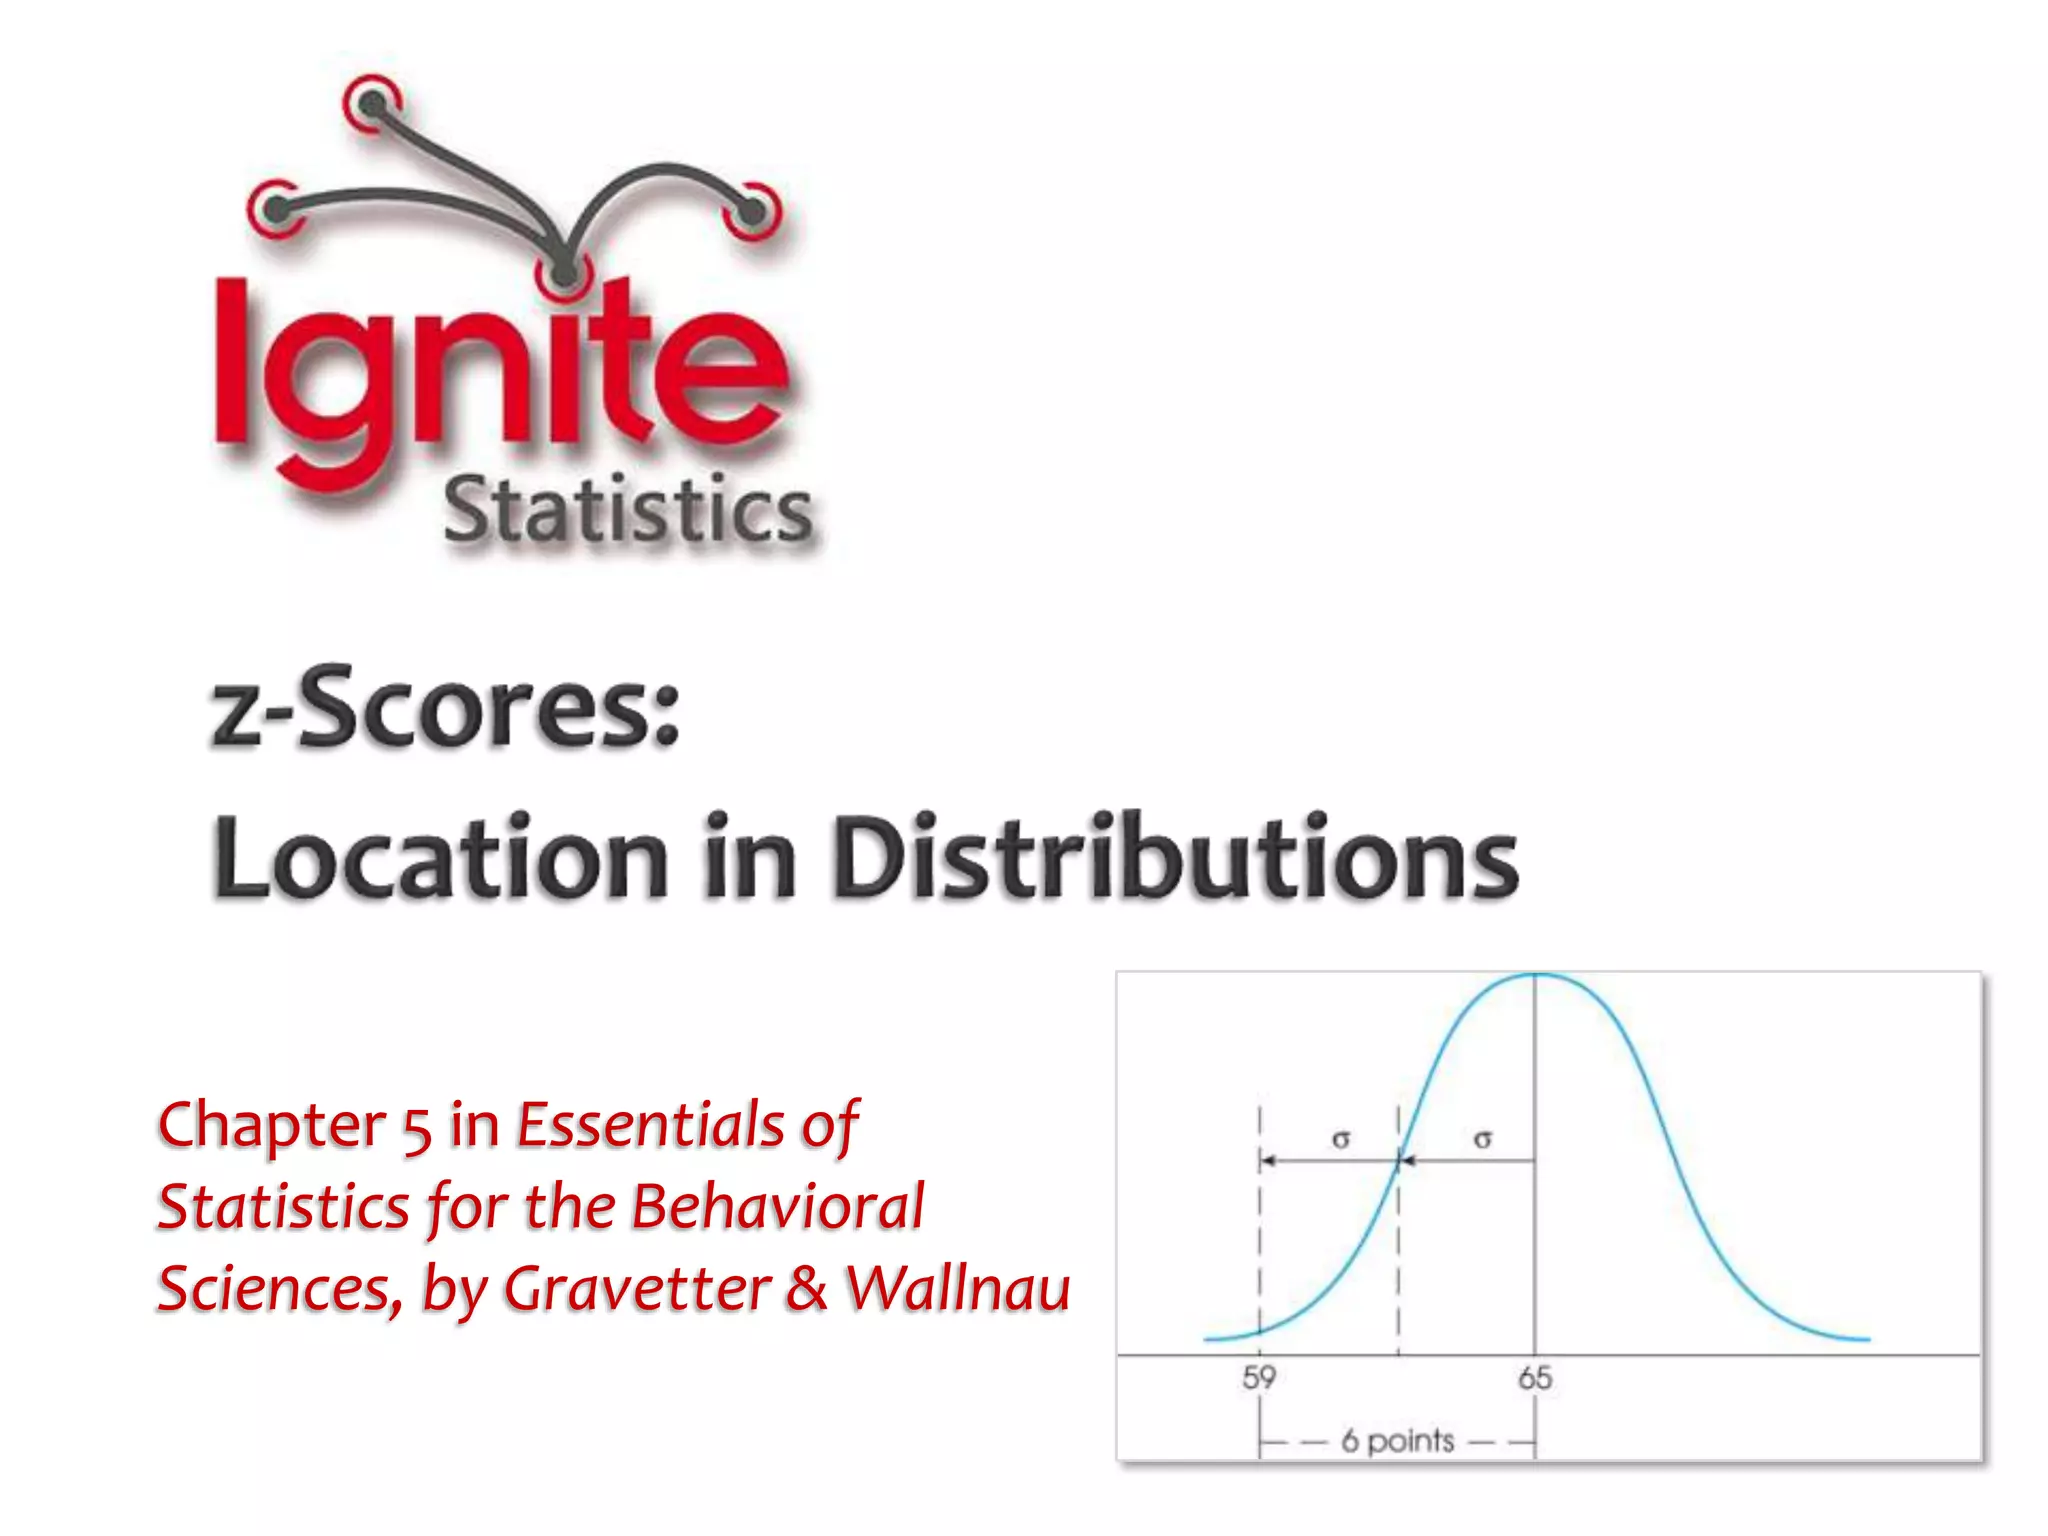
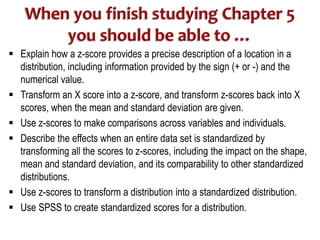
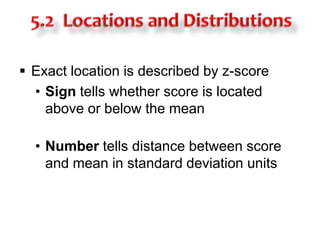
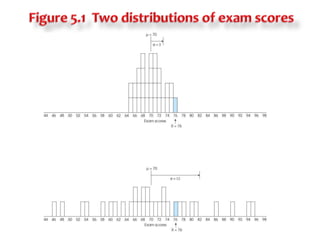
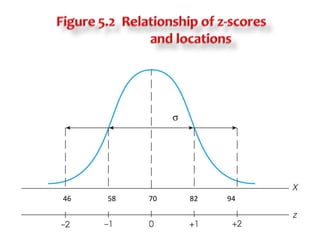
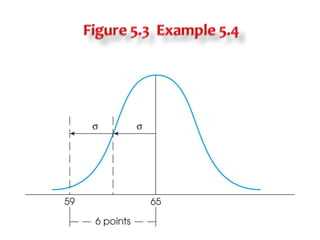
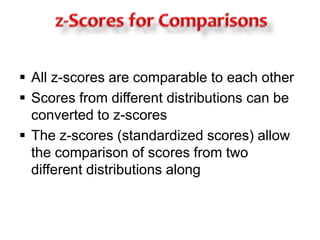
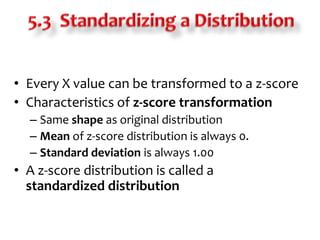
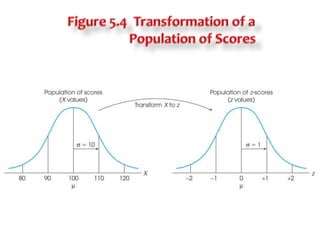
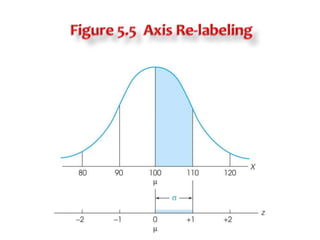
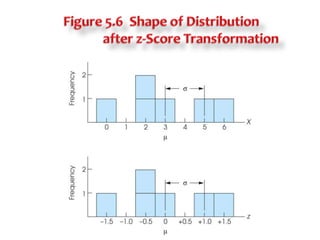
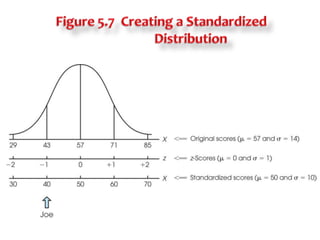
Separation of Lanthanides/ Lanthanides and Actinides
Introduction to z-Scores
1. z-Scores: Location in Distributions Chapter 5 in Essentials ofStatistics for the Behavioral Sciences, by Gravetter & Wallnau
2. Statistics is a class about thinking.Numbers are the material we work with.Statistical techniques are tools that help us think.
3. History of the termStandard Deviation The concept of “root-mean-square-error” (RMSE) was used by physical scientists in the late 18th century. Karl Pearson was the first to use “standard deviation” as a shorthand phrase for RMSE in a lecture in 1893, then in a book in 1894. Through Pearson, it came to be a central concept in most forms of modern statistics. Standard deviation is the accepted term in most social, behavioral, and medical sciences. Karl Pearson (1857-1936) established the discipline of mathematical statistics. In 1911 he founded the world's first statistics department at University College London. He was a controversial proponent of eugenics, and a protégé and biographer of Sir Francis Galton.
4. CNN-Money uses Standard Deviation Make fear and greed work for you Wall Street constantly swings between these two emotions. You can either get caught in the frenzy - or profit from it. By Janice Revell, Money Magazine senior writer Last Updated: July 21, 2009: 10:56 AM ET “Making matters worse, the big stock bet would be far riskier on a year-to-year basis than other strategies. The most common measure of portfolio risk is standard deviation, which tells you how much an investment's short-term returns bounce around its long-term average. Since 1926 stocks have returned average gains of 9.6% a year, with a standard deviation of 21.5 percentage points, according to Ibbotson Associates. That means that about two-thirds of the time, the annual return on stocks landed 21.5 percentage points below or above the average - that is, in any given year, your results would range from a 12% loss to a 31% gain. You'd need either an iron stomach or a steady supply of Zantac to stay the course. And if you happened to be at or near retirement when one of those really bad years hit, you might have to rethink your plans.” http://money.cnn.com/2009/07/20/pf/funds/fear_greed.moneymag/
5. Descriptive Statistics in Research LuAnn, S., J. Walter and D. Antosh. (2007) Dieting behaviors of young women post-college graduation. College Student Journal41:4.
6. When you finish studying Chapter 5 you should be able to … Explain how a z-score provides a precise description of a location in a distribution, including information provided by the sign (+ or -) and the numerical value. Transform an X score into a z-score, and transform z-scores back into X scores, when the mean and standard deviation are given. Use z-scores to make comparisons across variables and individuals. Describe the effects when an entire data set is standardized by transforming all the scores to z-scores, including the impact on the shape, mean and standard deviation, and its comparability to other standardized distributions. Use z-scores to transform a distribution into a standardized distribution. Use SPSS to create standardized scores for a distribution.
7. Concepts to review The mean (Chapter 3) The standard deviation (Chapter 4) Basic algebra (math review, Appendix A)
11. 5.2 Locations and Distributions Exact location is described by z-score Sign tells whether score is located above or below the mean Number tells distance between score and mean in standard deviation units
17. z-Scores for Comparisons All z-scores are comparable to each other Scores from different distributions can be converted to z-scores The z-scores (standardized scores) allow the comparison of scores from two different distributions along
18. Figure 5.7 Creating a Standardized Distribution
28. Figure 5.6 Shape of Distribution after z-Score Transformation
29. z-Scores for Comparisons All z-scores are comparable to each other Scores from different distributions can be converted to z-scores The z-scores (standardized scores) allow the comparison of scores from two different distributions along
30. 5.4 Other Standardized Distributions Process of standardization is widely used AT has μ = 500 and σ = 100 IQ has μ = 100 and σ = 15 Point Standardizing a distribution has two steps Original raw scores transformed to z-scores The z-scores are transformed to new X values so that the specific μ and σ are attained.
31. Figure 5.7 Creating a Standardized Distribution
32. 5.6 Looking to Inferential Statistics Interpretation of research results depends on determining if (treated) sample is noticeably different from the population One technique for defining noticeably different uses z-scores.