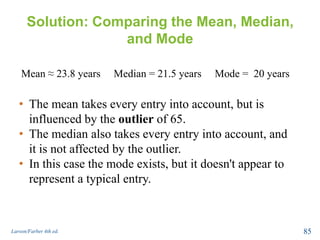
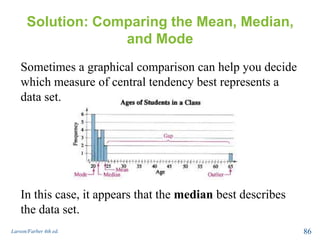
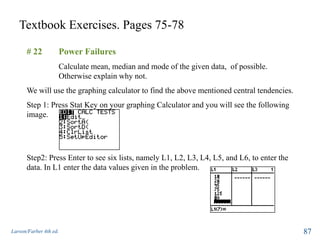
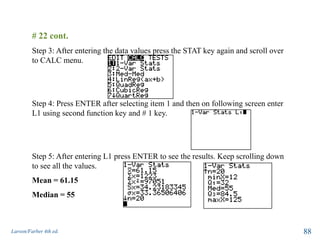
Downloaded 157 times
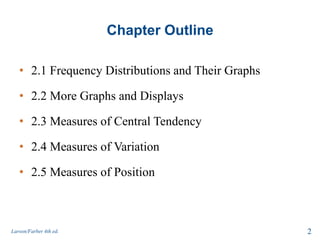
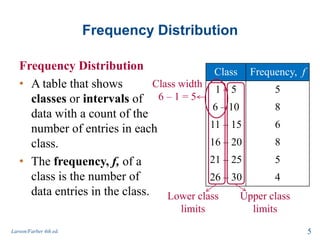
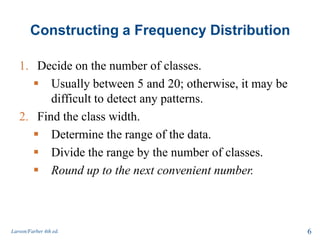
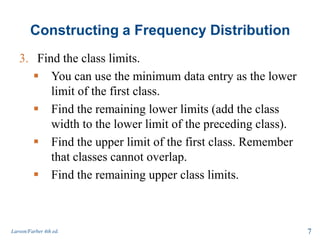
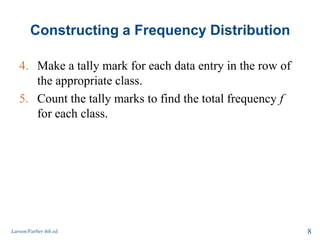
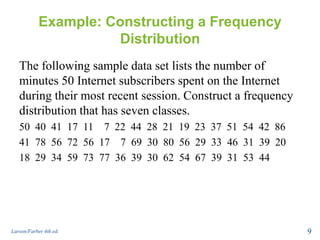
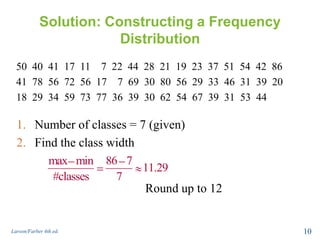
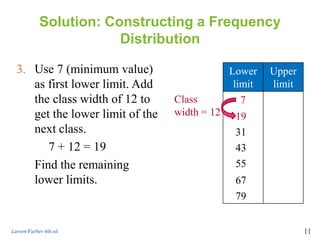
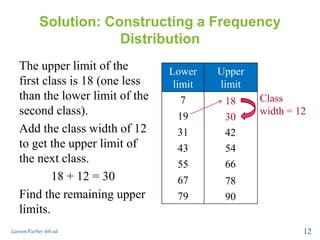
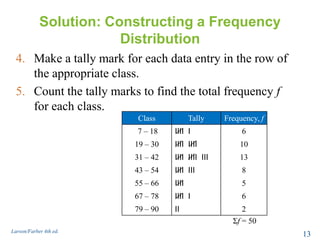
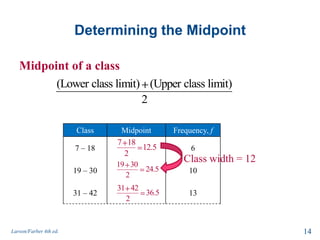
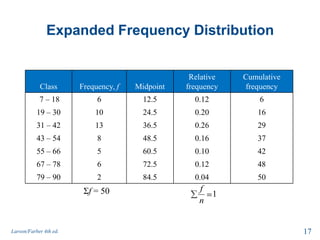
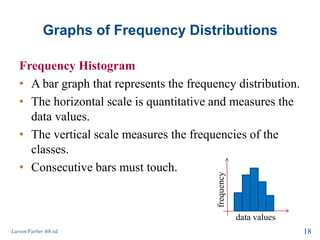
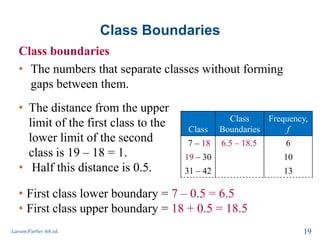
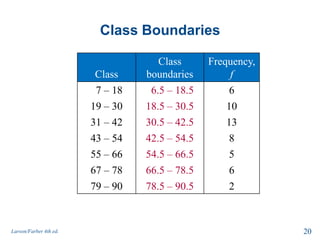
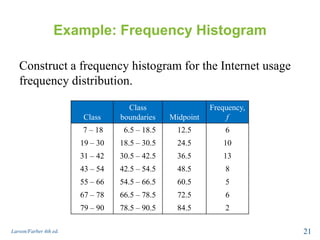
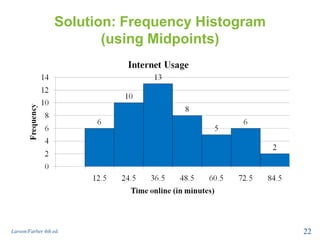
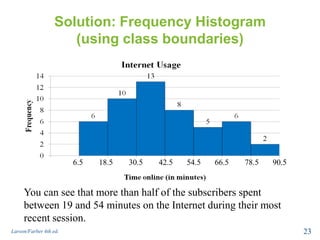
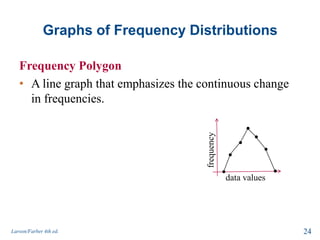
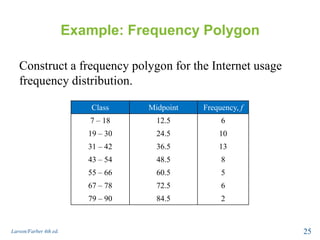
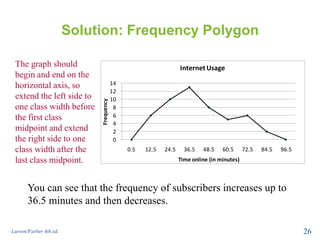
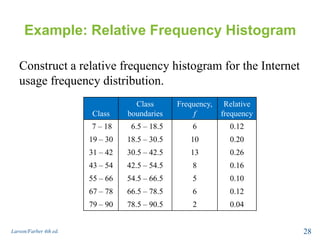
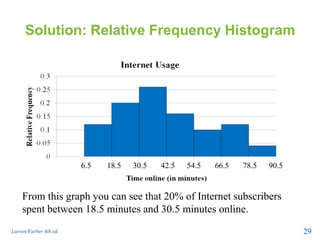
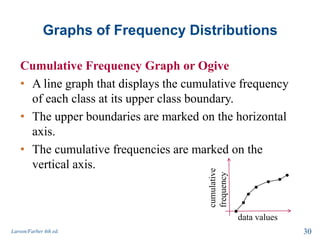
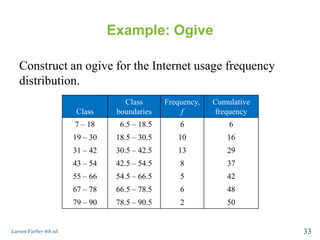
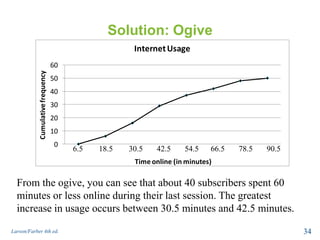

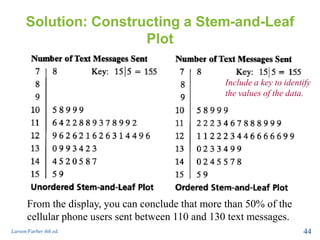
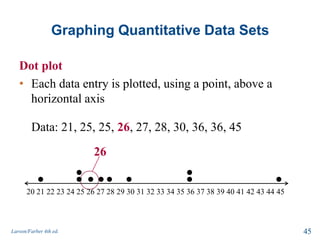
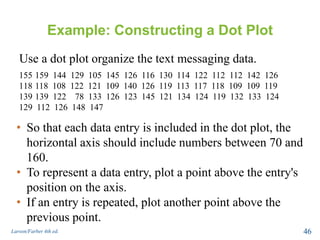
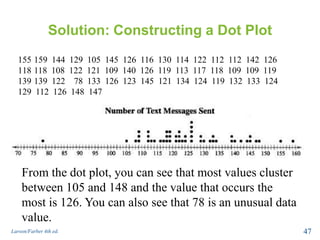
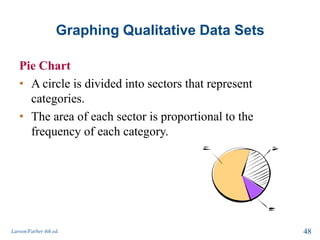
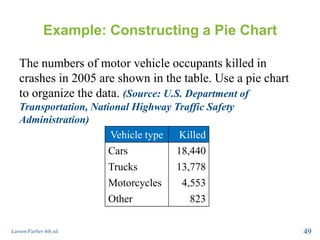
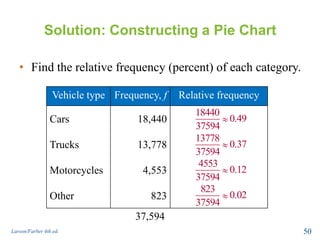
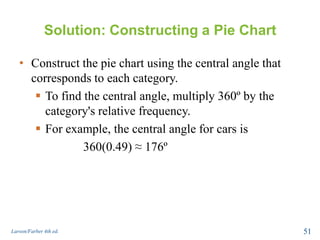


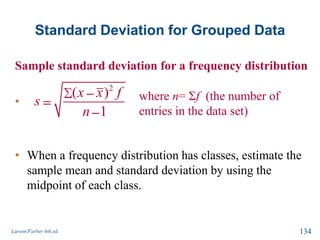
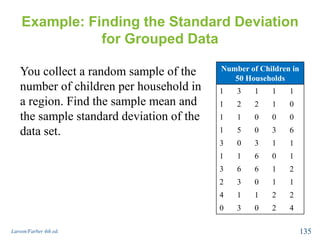
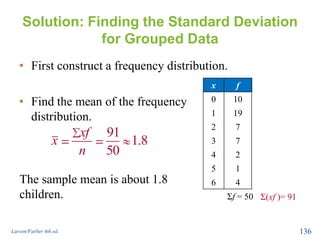
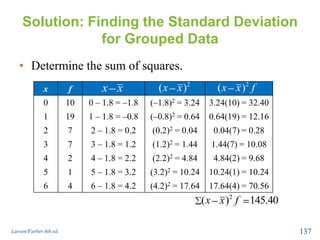

This document summarizes Chapter 2 of a statistics textbook. It covers descriptive statistics including frequency distributions, graphs of distributions, measures of central tendency, variation, and position. Section 2.1 discusses constructing frequency distributions and graphs including histograms, polygons, relative histograms, and ogives. Examples are provided to demonstrate how to construct these graphs from sample data on internet usage times. Key steps include determining class widths, limits, frequencies, midpoints, boundaries, and plotting the graphs.
![AP Stats Chapter 1 Exploring Data [Autosaved] (1).ppt](https://cdn.slidesharecdn.com/ss_thumbnails/apstatschapter1exploringdataautosaved1-240908213027-9f0b3ffa-thumbnail.jpg?width=640&height=640&fit=bounds)