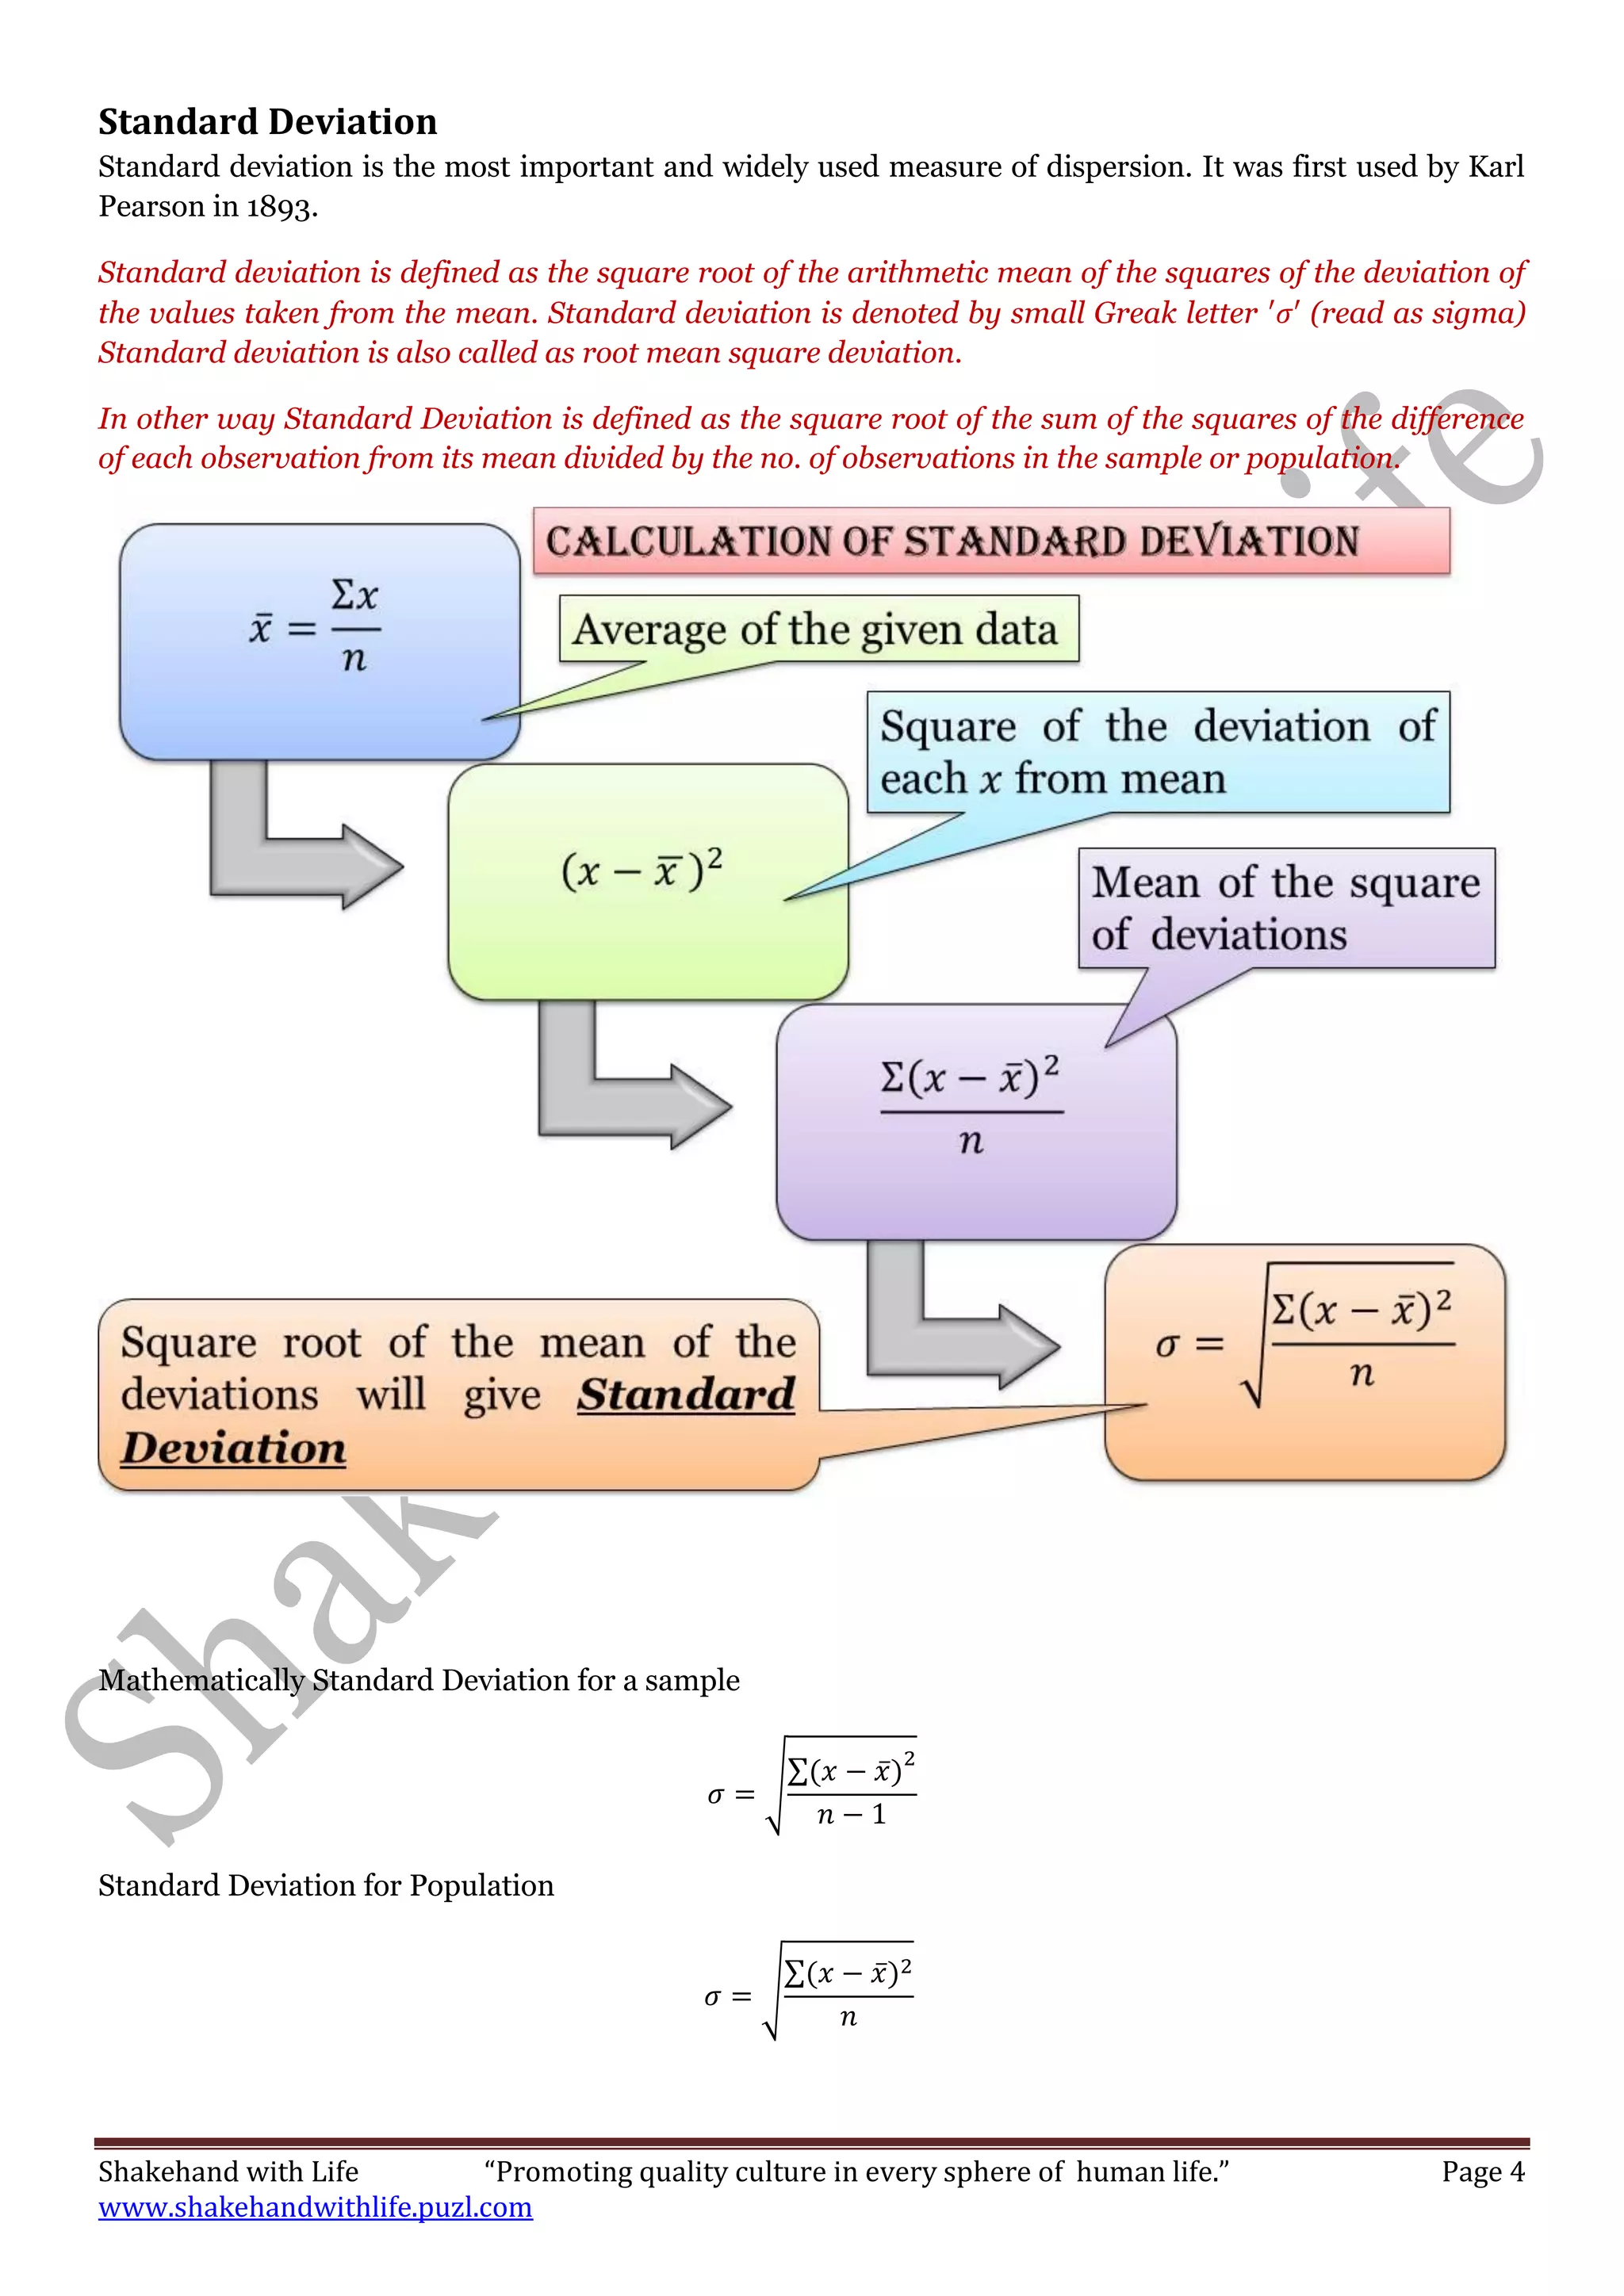
Tutorial
Measure of Dispersion
Part -II
 Standard Deviation
 Variance
 Coefficient of Variation
Designed and Prepared
By
Narender Sharma
Shakehand with Life “Promoting quality culture in every sphere of human life.” Page 2
www.shakehandwithlife.puzl.com
Shakehand with Life “Promoting quality culture in every sphere of human life.” Page 3
www.shakehandwithlife.puzl.com
Content of this Tutorial
S. No. Topic Page No.
1
Standard Deviation
 Definition
 Method of Calculation for
I. Individual Series
II. Discrete Series
III. Continuous Series
 Difference between Mean
Deviation and Standard
Deviation
4-10
2
Mathematical Properties
of Standard Deviation 11-13
3
Variance
14
4
Coefficient of Variation
15-16
5
Excel Commands
 Standard Deviation
 Variance
 Coefficient of Variation
17
Shakehand with Life “Promoting quality culture in every sphere of human life.” Page 4
www.shakehandwithlife.puzl.com
Standard Deviation
Standard deviation is the most important and widely used measure of dispersion. It was first used by Karl
Pearson in 1893.
Standard deviation is defined as the square root of the arithmetic mean of the squares of the deviation of
the values taken from the mean. Standard deviation is denoted by small Greak letter (read as sigma)
Standard deviation is also called as root mean square deviation.
In other way Standard Deviation is defined as the square root of the sum of the squares of the difference
of each observation from its mean divided by the no. of observations in the sample or population.
Mathematically Standard Deviation for a sample
√
∑ ̅
Standard Deviation for Population
√
∑ ̅
Shakehand with Life “Promoting quality culture in every sphere of human life.” Page 5
www.shakehandwithlife.puzl.com
Example 1
̅ ̅
̅
̅ ∑ ̅
Sample Standard deviation for the given data
√
∑ ̅
√ √
Population Standard deviation
√
∑ ̅
√ √
Big Question - ?
Why we use for sample standard deviation and for population standard deviation?
This is because of degrees of freedom. Suppose you are asked to choose 10 numbers. You then have the
freedom to choose 10 numbers as you please, and we say you have 10 degrees of freedom. But suppose a
condition is imposed on the numbers. The condition is that the sum of all the numbers you choose must be
100. In this case, you cannot choose all 10 numbers as you please. After you have chosen the ninth number
let’s say the sum of the nine numbers is 94. Your tenth number then has to be 6, and you have no choice.
Thus you have only 9 degrees of freedom.
Shakehand with Life “Promoting quality culture in every sphere of human life.” Page 6
www.shakehandwithlife.puzl.com
In general, if you have to choose numbers, and a condition on their total is imposed, you will have only
degrees of freedom.
In a simple language, we can understand this way. The largest sample size of a population of number is
. e.g. if we want to choose largest sample out of 10 numbers then it will 9 i.e. 10-1 because if we take
10 instead of 9 then it is the size of population.
Difference between Mean Deviation and Standard Deviation
Both these measures of dispersion are based on each and every item of the series. But they differ in the
following respects;
1. Algebraic signs of deviation(+ or -) are ignored while calculation mean deviation whereas in the
calculation standard deviations signs of deviations are not ignored i.e. they are taken into account. Ref.
Tutorial (Measure of Dispersion-Part-I)
2. Mean deviation can be computed either from mean, median or Mode. The standard deviation, on the
other hand, is always computed from the mean because the sum of the squares of the deviations taken
from mean is minimum
Calculation of Standard Deviation
Individual Series
Actual Mean Method
When deviations are taken from the actual mea the following formula is used;
√
∑
√
∑
̅
Example 1 Calculate the standard deviation form the following data;
X: 16, 20, 18, 19, 20, 20, 28, 17, 22, 20
Solution : Calculation of Standard Deviation
̅
̅
N=10, ∑ ,
Shakehand with Life “Promoting quality culture in every sphere of human life.” Page 7
www.shakehandwithlife.puzl.com
̅
Standard Deviation
√
∑
√ √
Assumed Mean Method
When the actual mean is not a whole number but in fraction, then it becomes difficult to take deviations
from mean and then obtain the squares of these deviations. To save time and labour, we use assumed mean
method or called shortcut method. When deviations are taken from assumed mean, the following formula is
used:
√
∑
(
∑
)
Steps of Calculation
1) Any one of items in the series is taken as assumed mean, A.
2) Take the deviations of the items from the assumed mean i.e. and denote these deviations by .
Sum up these deviations to obtain .
3) Then square these deviations taken from assumed mean and obtain the total i.e.
4) Substitute the value of , in the above formula. The result will give the value of standard
deviation.
Example 2 Calculate the standard deviation of the following series:
7, 10, 12, 13, 15, 20, 21, 28, 29, 35
Use assumed mean method.
Solution : Calculation of Standard Deviation
Shakehand with Life “Promoting quality culture in every sphere of human life.” Page 8
www.shakehandwithlife.puzl.com
√
∑
(
∑
)
√ ( ) √ √
Method based on Actual data:
When number of observations are few, standard deviation can be calculated by using the actual data. When
this method is use, the following formula is used;
√
∑
(
∑
) √
∑
̅
Example 3 Calculate the standard deviation from the following series;
X: 16, 20, 18, 19, 20, 20, 28, 17, 22, 20
Solution : Calculation of Standard Deviation
16 256
20 400
18 324
19 361
20 400
20 400
28 784
17 289
22 484
20 400
√
∑
(
∑
) √ ( )
√ √
Discrete Series
For calculating standard deviation in discrete series, the following three methods may be used:
Actual Mean Method
Under this method, deviation of the items are taken from actual mean i.e. we find ̅ and denote these
deviations by . Then these deviations are squared and multiplies by their respective frequencies. The
following formula is used to calculate the standard deviation.
√ ̅
However , this method is rarely used in practice because if the actual mean is in fraction, the calculations
becomes tedious and time consuming.
Shakehand with Life “Promoting quality culture in every sphere of human life.” Page 9
www.shakehandwithlife.puzl.com
Assumed Mean Method
When this method is applied, the following formula is used :
√ ( )
Example 4 Calculate the standard deviation from the data given below
Solution : Calculation of Standard Deviation
√ ( ) √ ( )
√ √
Continuous Series or grouped data
In this series the procedure of calculating standard deviation by actual mean method and the assumed
mean method is same as in discrete series. The only difference is, first find the mid – values (m) of the
continuous data and move as in the discrete series.
Step Deviation Method
This method is used to simplify calculations. Under it, we divide the deviations taken from assumed mean
(d) by the class interval (i) and get step deviation of i.e. The remaining process remains as such
mentioned in assumed mean method. The formula for calculating standard deviation is ;
√ ( )
Shakehand with Life “Promoting quality culture in every sphere of human life.” Page 10
www.shakehandwithlife.puzl.com
Example 5 Calculate the mean and the standard deviation for the following data ;
Solution : Calculation of Mean and Standard Deviation
A
̅
√ ( ) √ ( )
√ √
Shakehand with Life “Promoting quality culture in every sphere of human life.” Page 11
www.shakehandwithlife.puzl.com
To buy this complete tutorial
Visit
www.shakehandwithlife.puzl.com

Measure of dispersion part II ( Standard Deviation, variance, coefficient of variation)

  • 1.
    Tutorial Measure of Dispersion Part-II  Standard Deviation  Variance  Coefficient of Variation Designed and Prepared By Narender Sharma
  • 2.
    Shakehand with Life“Promoting quality culture in every sphere of human life.” Page 2 www.shakehandwithlife.puzl.com
  • 3.
    Shakehand with Life“Promoting quality culture in every sphere of human life.” Page 3 www.shakehandwithlife.puzl.com Content of this Tutorial S. No. Topic Page No. 1 Standard Deviation  Definition  Method of Calculation for I. Individual Series II. Discrete Series III. Continuous Series  Difference between Mean Deviation and Standard Deviation 4-10 2 Mathematical Properties of Standard Deviation 11-13 3 Variance 14 4 Coefficient of Variation 15-16 5 Excel Commands  Standard Deviation  Variance  Coefficient of Variation 17
  • 4.
    Shakehand with Life“Promoting quality culture in every sphere of human life.” Page 4 www.shakehandwithlife.puzl.com Standard Deviation Standard deviation is the most important and widely used measure of dispersion. It was first used by Karl Pearson in 1893. Standard deviation is defined as the square root of the arithmetic mean of the squares of the deviation of the values taken from the mean. Standard deviation is denoted by small Greak letter (read as sigma) Standard deviation is also called as root mean square deviation. In other way Standard Deviation is defined as the square root of the sum of the squares of the difference of each observation from its mean divided by the no. of observations in the sample or population. Mathematically Standard Deviation for a sample √ ∑ ̅ Standard Deviation for Population √ ∑ ̅
  • 5.
    Shakehand with Life“Promoting quality culture in every sphere of human life.” Page 5 www.shakehandwithlife.puzl.com Example 1 ̅ ̅ ̅ ̅ ∑ ̅ Sample Standard deviation for the given data √ ∑ ̅ √ √ Population Standard deviation √ ∑ ̅ √ √ Big Question - ? Why we use for sample standard deviation and for population standard deviation? This is because of degrees of freedom. Suppose you are asked to choose 10 numbers. You then have the freedom to choose 10 numbers as you please, and we say you have 10 degrees of freedom. But suppose a condition is imposed on the numbers. The condition is that the sum of all the numbers you choose must be 100. In this case, you cannot choose all 10 numbers as you please. After you have chosen the ninth number let’s say the sum of the nine numbers is 94. Your tenth number then has to be 6, and you have no choice. Thus you have only 9 degrees of freedom.
  • 6.
    Shakehand with Life“Promoting quality culture in every sphere of human life.” Page 6 www.shakehandwithlife.puzl.com In general, if you have to choose numbers, and a condition on their total is imposed, you will have only degrees of freedom. In a simple language, we can understand this way. The largest sample size of a population of number is . e.g. if we want to choose largest sample out of 10 numbers then it will 9 i.e. 10-1 because if we take 10 instead of 9 then it is the size of population. Difference between Mean Deviation and Standard Deviation Both these measures of dispersion are based on each and every item of the series. But they differ in the following respects; 1. Algebraic signs of deviation(+ or -) are ignored while calculation mean deviation whereas in the calculation standard deviations signs of deviations are not ignored i.e. they are taken into account. Ref. Tutorial (Measure of Dispersion-Part-I) 2. Mean deviation can be computed either from mean, median or Mode. The standard deviation, on the other hand, is always computed from the mean because the sum of the squares of the deviations taken from mean is minimum Calculation of Standard Deviation Individual Series Actual Mean Method When deviations are taken from the actual mea the following formula is used; √ ∑ √ ∑ ̅ Example 1 Calculate the standard deviation form the following data; X: 16, 20, 18, 19, 20, 20, 28, 17, 22, 20 Solution : Calculation of Standard Deviation ̅ ̅ N=10, ∑ ,
  • 7.
    Shakehand with Life“Promoting quality culture in every sphere of human life.” Page 7 www.shakehandwithlife.puzl.com ̅ Standard Deviation √ ∑ √ √ Assumed Mean Method When the actual mean is not a whole number but in fraction, then it becomes difficult to take deviations from mean and then obtain the squares of these deviations. To save time and labour, we use assumed mean method or called shortcut method. When deviations are taken from assumed mean, the following formula is used: √ ∑ ( ∑ ) Steps of Calculation 1) Any one of items in the series is taken as assumed mean, A. 2) Take the deviations of the items from the assumed mean i.e. and denote these deviations by . Sum up these deviations to obtain . 3) Then square these deviations taken from assumed mean and obtain the total i.e. 4) Substitute the value of , in the above formula. The result will give the value of standard deviation. Example 2 Calculate the standard deviation of the following series: 7, 10, 12, 13, 15, 20, 21, 28, 29, 35 Use assumed mean method. Solution : Calculation of Standard Deviation
  • 8.
    Shakehand with Life“Promoting quality culture in every sphere of human life.” Page 8 www.shakehandwithlife.puzl.com √ ∑ ( ∑ ) √ ( ) √ √ Method based on Actual data: When number of observations are few, standard deviation can be calculated by using the actual data. When this method is use, the following formula is used; √ ∑ ( ∑ ) √ ∑ ̅ Example 3 Calculate the standard deviation from the following series; X: 16, 20, 18, 19, 20, 20, 28, 17, 22, 20 Solution : Calculation of Standard Deviation 16 256 20 400 18 324 19 361 20 400 20 400 28 784 17 289 22 484 20 400 √ ∑ ( ∑ ) √ ( ) √ √ Discrete Series For calculating standard deviation in discrete series, the following three methods may be used: Actual Mean Method Under this method, deviation of the items are taken from actual mean i.e. we find ̅ and denote these deviations by . Then these deviations are squared and multiplies by their respective frequencies. The following formula is used to calculate the standard deviation. √ ̅ However , this method is rarely used in practice because if the actual mean is in fraction, the calculations becomes tedious and time consuming.
  • 9.
    Shakehand with Life“Promoting quality culture in every sphere of human life.” Page 9 www.shakehandwithlife.puzl.com Assumed Mean Method When this method is applied, the following formula is used : √ ( ) Example 4 Calculate the standard deviation from the data given below Solution : Calculation of Standard Deviation √ ( ) √ ( ) √ √ Continuous Series or grouped data In this series the procedure of calculating standard deviation by actual mean method and the assumed mean method is same as in discrete series. The only difference is, first find the mid – values (m) of the continuous data and move as in the discrete series. Step Deviation Method This method is used to simplify calculations. Under it, we divide the deviations taken from assumed mean (d) by the class interval (i) and get step deviation of i.e. The remaining process remains as such mentioned in assumed mean method. The formula for calculating standard deviation is ; √ ( )
  • 10.
    Shakehand with Life“Promoting quality culture in every sphere of human life.” Page 10 www.shakehandwithlife.puzl.com Example 5 Calculate the mean and the standard deviation for the following data ; Solution : Calculation of Mean and Standard Deviation A ̅ √ ( ) √ ( ) √ √
  • 11.
    Shakehand with Life“Promoting quality culture in every sphere of human life.” Page 11 www.shakehandwithlife.puzl.com To buy this complete tutorial Visit www.shakehandwithlife.puzl.com