VIP Call Girls Service Kukatpally Hyderabad Call +91-8250192130
Poster template
1. Definition
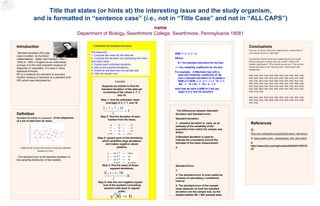
Standard deviation is a measure of the dispersion
of a set of data from its mean.
A data set with a mean of 50 (shown in blue) and a standard
deviation (σ) of 20.
The standard error is the standard deviation of
the sampling distribution of that statistic.
Introduction
Standard deviation (SD) was
Used in written by the Britch
mathematician called Karl Pearson (1857 –
1936) in 1893 in England as an arithmetical
concept. It is the most important measure of
dispersion or separation. It is used in many
statistical formulas.
SD is a measure of a precision or accuracy .
Another measure of precision is a standard error
(SE) which was discovered by .
Calculation the Standard deviation: Conclusions
You can, of course, start your conclusions in column three if
your results section is “data light.”
Conclusions should not be mere rephrasing of your results.
What would one conclude from the results? What is the
broader significance? Why should anyone care? This section
should refer back to the “burning issue” mentioned in the
introduction.
Blah, blah, blah. Blah, blah, blah. Blah, blah, blah. Blah, blah,
blah. Blah, blah, blah. Blah, blah, blah. Blah, blah, blah. Blah,
blah, blah. Blah, blah, blah. Blah, blah, blah. Blah, blah, blah.
Blah, blah, blah. Blah, blah, blah. Blah, blah, blah. Blah, blah,
blah. Blah, blah, blah. Blah, blah, blah. Blah, blah, blah. Blah,
blah, blah. Blah, blah, blah. Blah, blah, blah. Blah, blah, blah.
Blah, blah, blah.
Blah, blah, blah. Blah, blah, blah. Blah, blah, blah. Blah, blah,
blah. Blah, blah, blah. Blah, blah, blah. Blah, blah, blah. Blah,
blah, blah.
Title that states (or hints at) the interesting issue and the study organism,
and is formatted in “sentence case” (i.e., not in “Title Case” and not in “ALL CAPS”)
name
Department of Biology, Swarthmore College, Swarthmore, Pennsylvania 19081
Example:
Suppose we wished to find the
standard deviation of the data set
consisting of the values 3, 7, 7,
and 19.
Step 1: find the arithmetic mean
(average) of 3, 7, 7, and 19,
Step 2: find the deviation of each
number from the mean,
Step 3: square each of the deviations,
which amplifies large deviations
and makes negative values
positive,
Step 4: find the mean of those
squared deviations,
Step 5: take the non-negative square
root of the quotient (converting
squared units back to regular
units),
The steps are:
1- Compute the mean for the data set.
2- Compute the deviation by subtracting the mean
from each value.
3- Square each individual deviation.
4- Add up the squared deviations.
5- Divide by one less than the sample size.
6- Take the square root.
SEM = s 1 – r)
Where:
S = the standard deviation for the test
r = the reliability coefficient for the test
For example, A Wechsler test with a
split-half reliability coefficient of .96
and a standard deviation of 15 yields a
SEM of 3 SEM = s ( 1 – r ) = 15 ( 1-
.96) = 15 .04 = 15 x .2 = 3
Now that we have a SEM of 3 we can
apply it to a real life situation.
References
1-
http://en.wikipedia.org/wiki/Standard_deviation
2- www.statit.com/.../estimating_std_dev.shtml
3-
http://www.bmj.com/cgi/content/full/331/7521/9
03
The differences between Standard
deviation and Standard error:
Standard deviation:
1- standard deviation is used as an
estimate of the variability of the
population from which the sample was
drawn.
2-Standard deviation is used to
indicate the uncertainty around the
estimate of the mean measurement
3-
Standard Error:
1-
2- The standard error is most useful as
a means of calculating a confidence
interval .
3- The standard error of the sample
mean depends on both the standard
deviation and the sample size, by the
simple relation SE = SD/ (sample size).