Downloaded 992 times
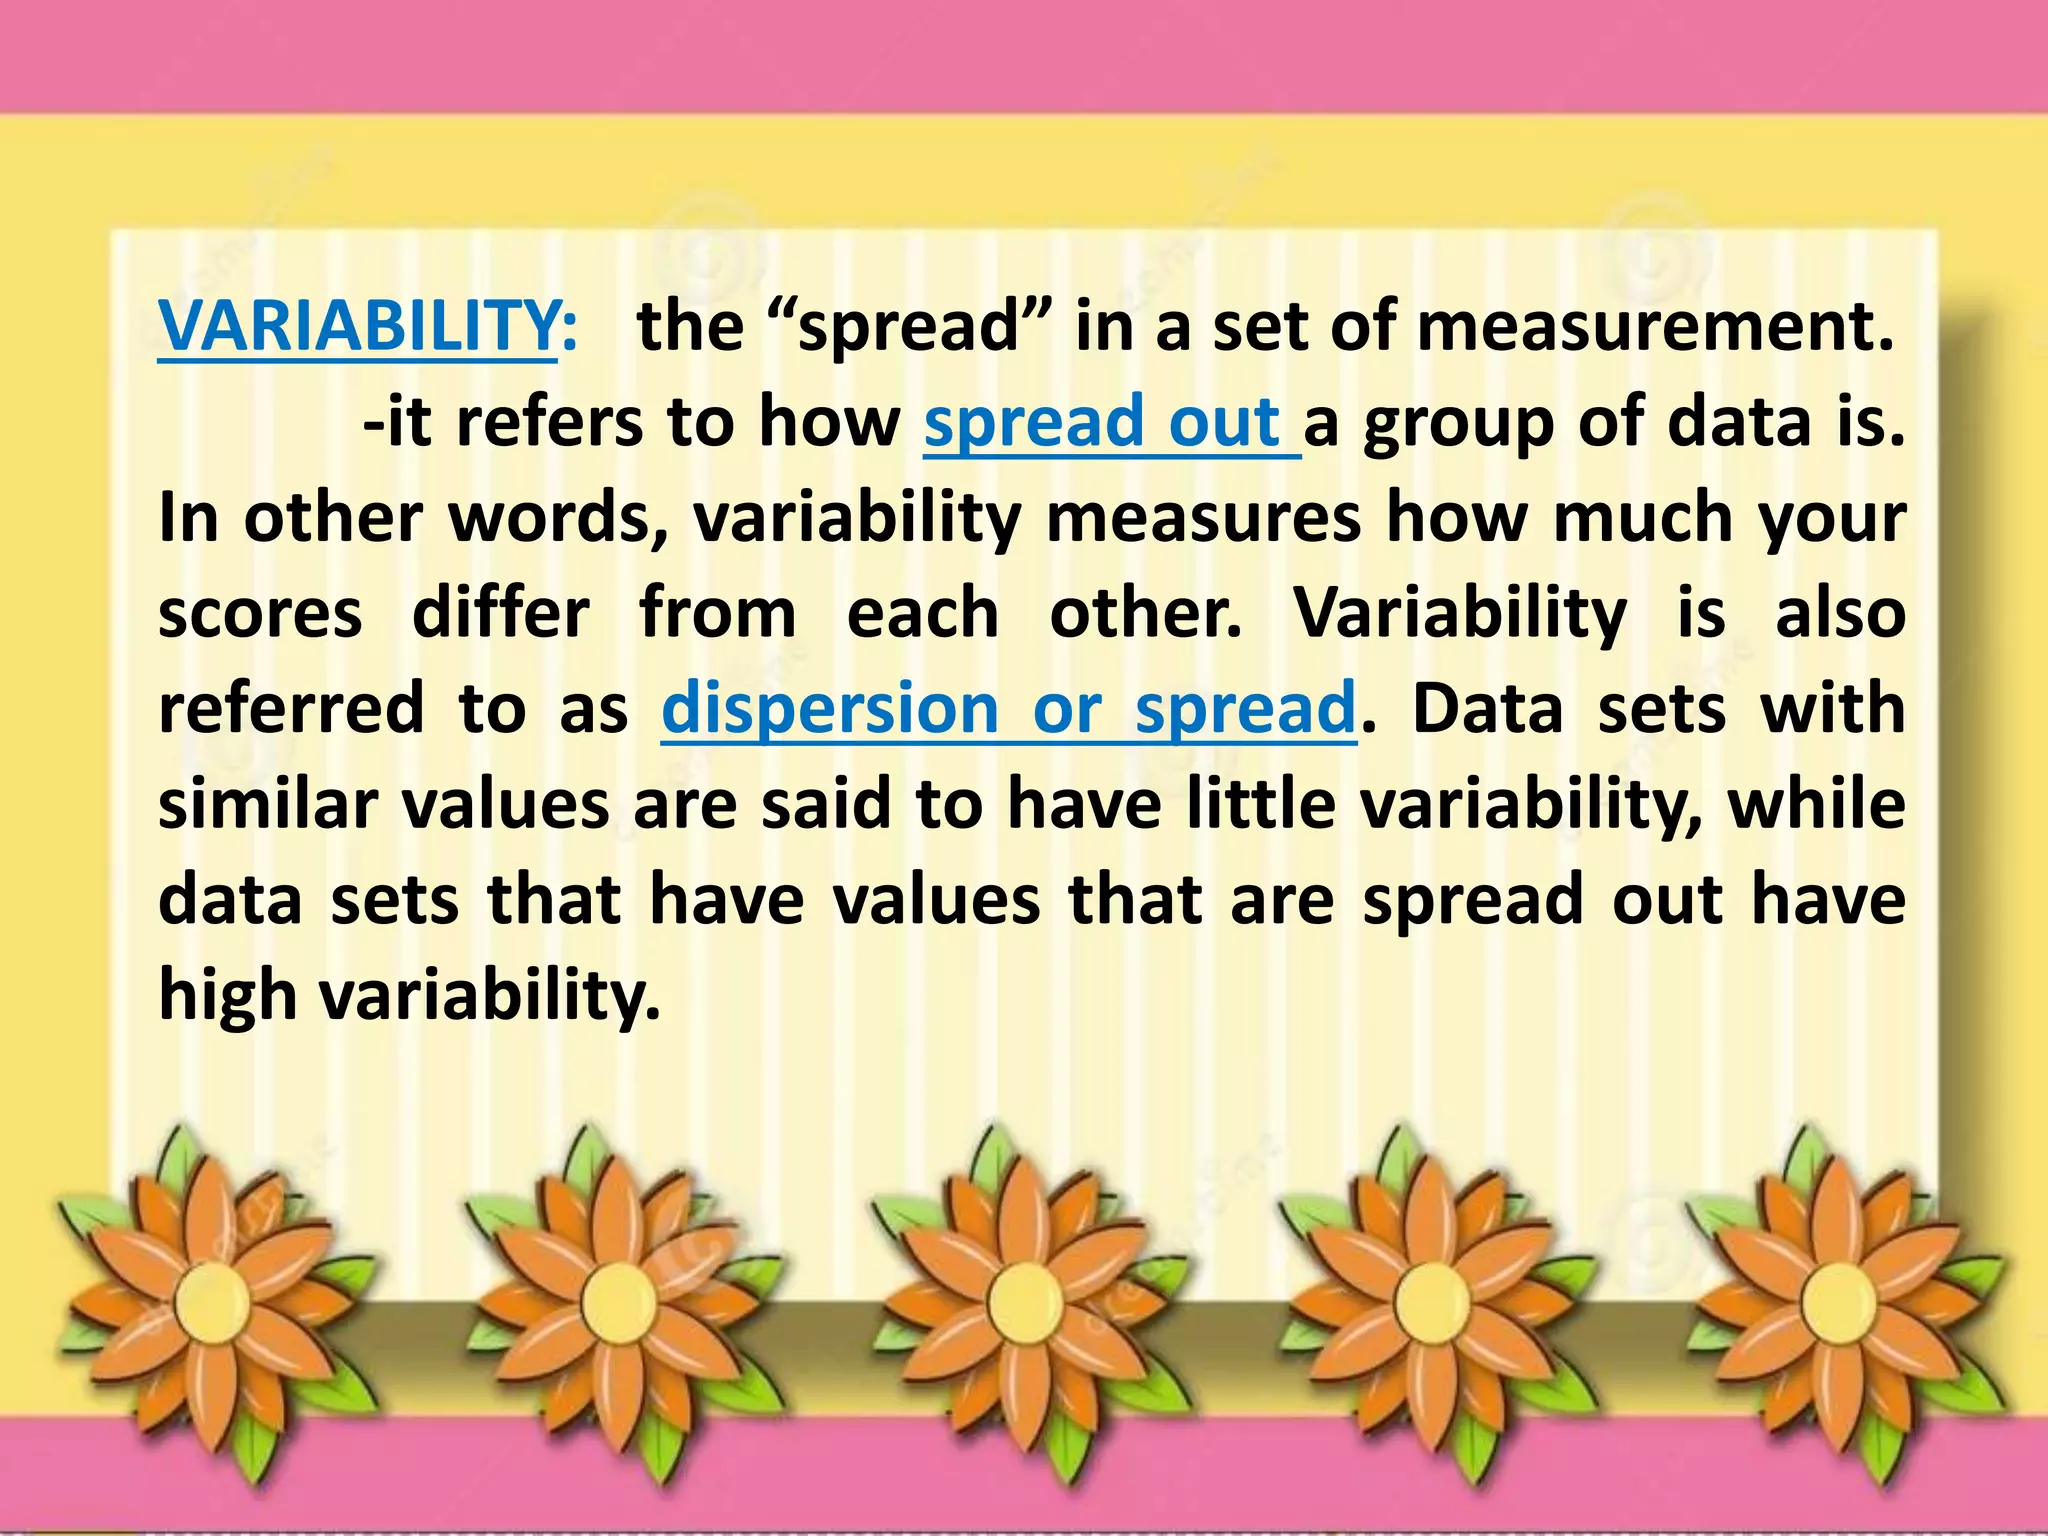
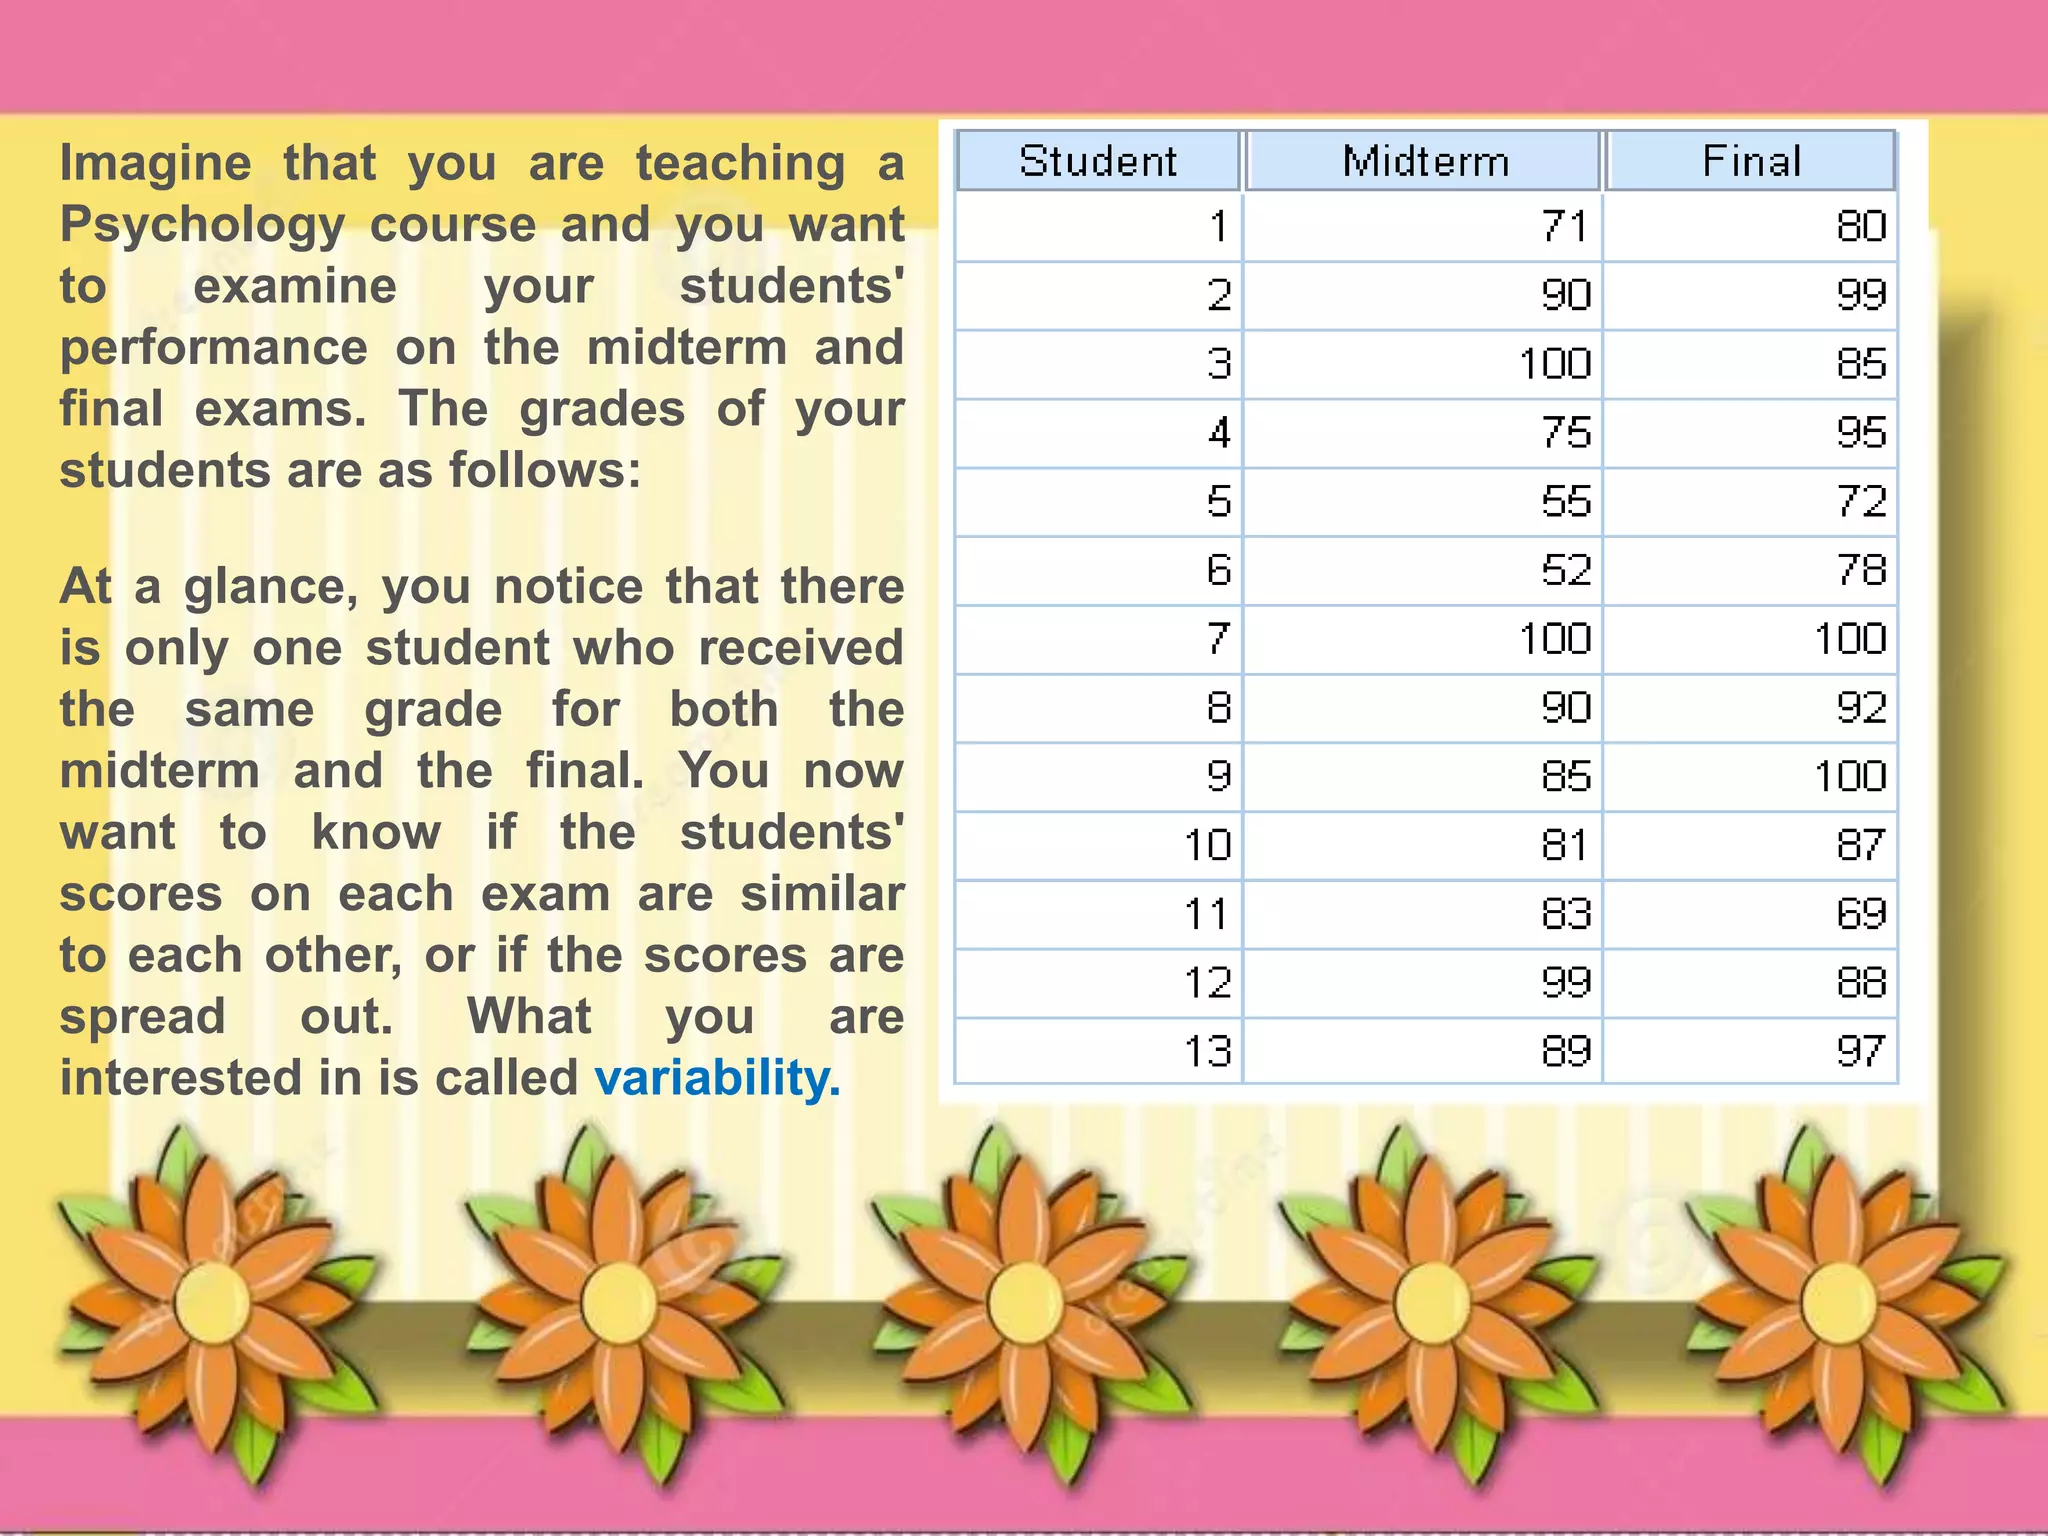
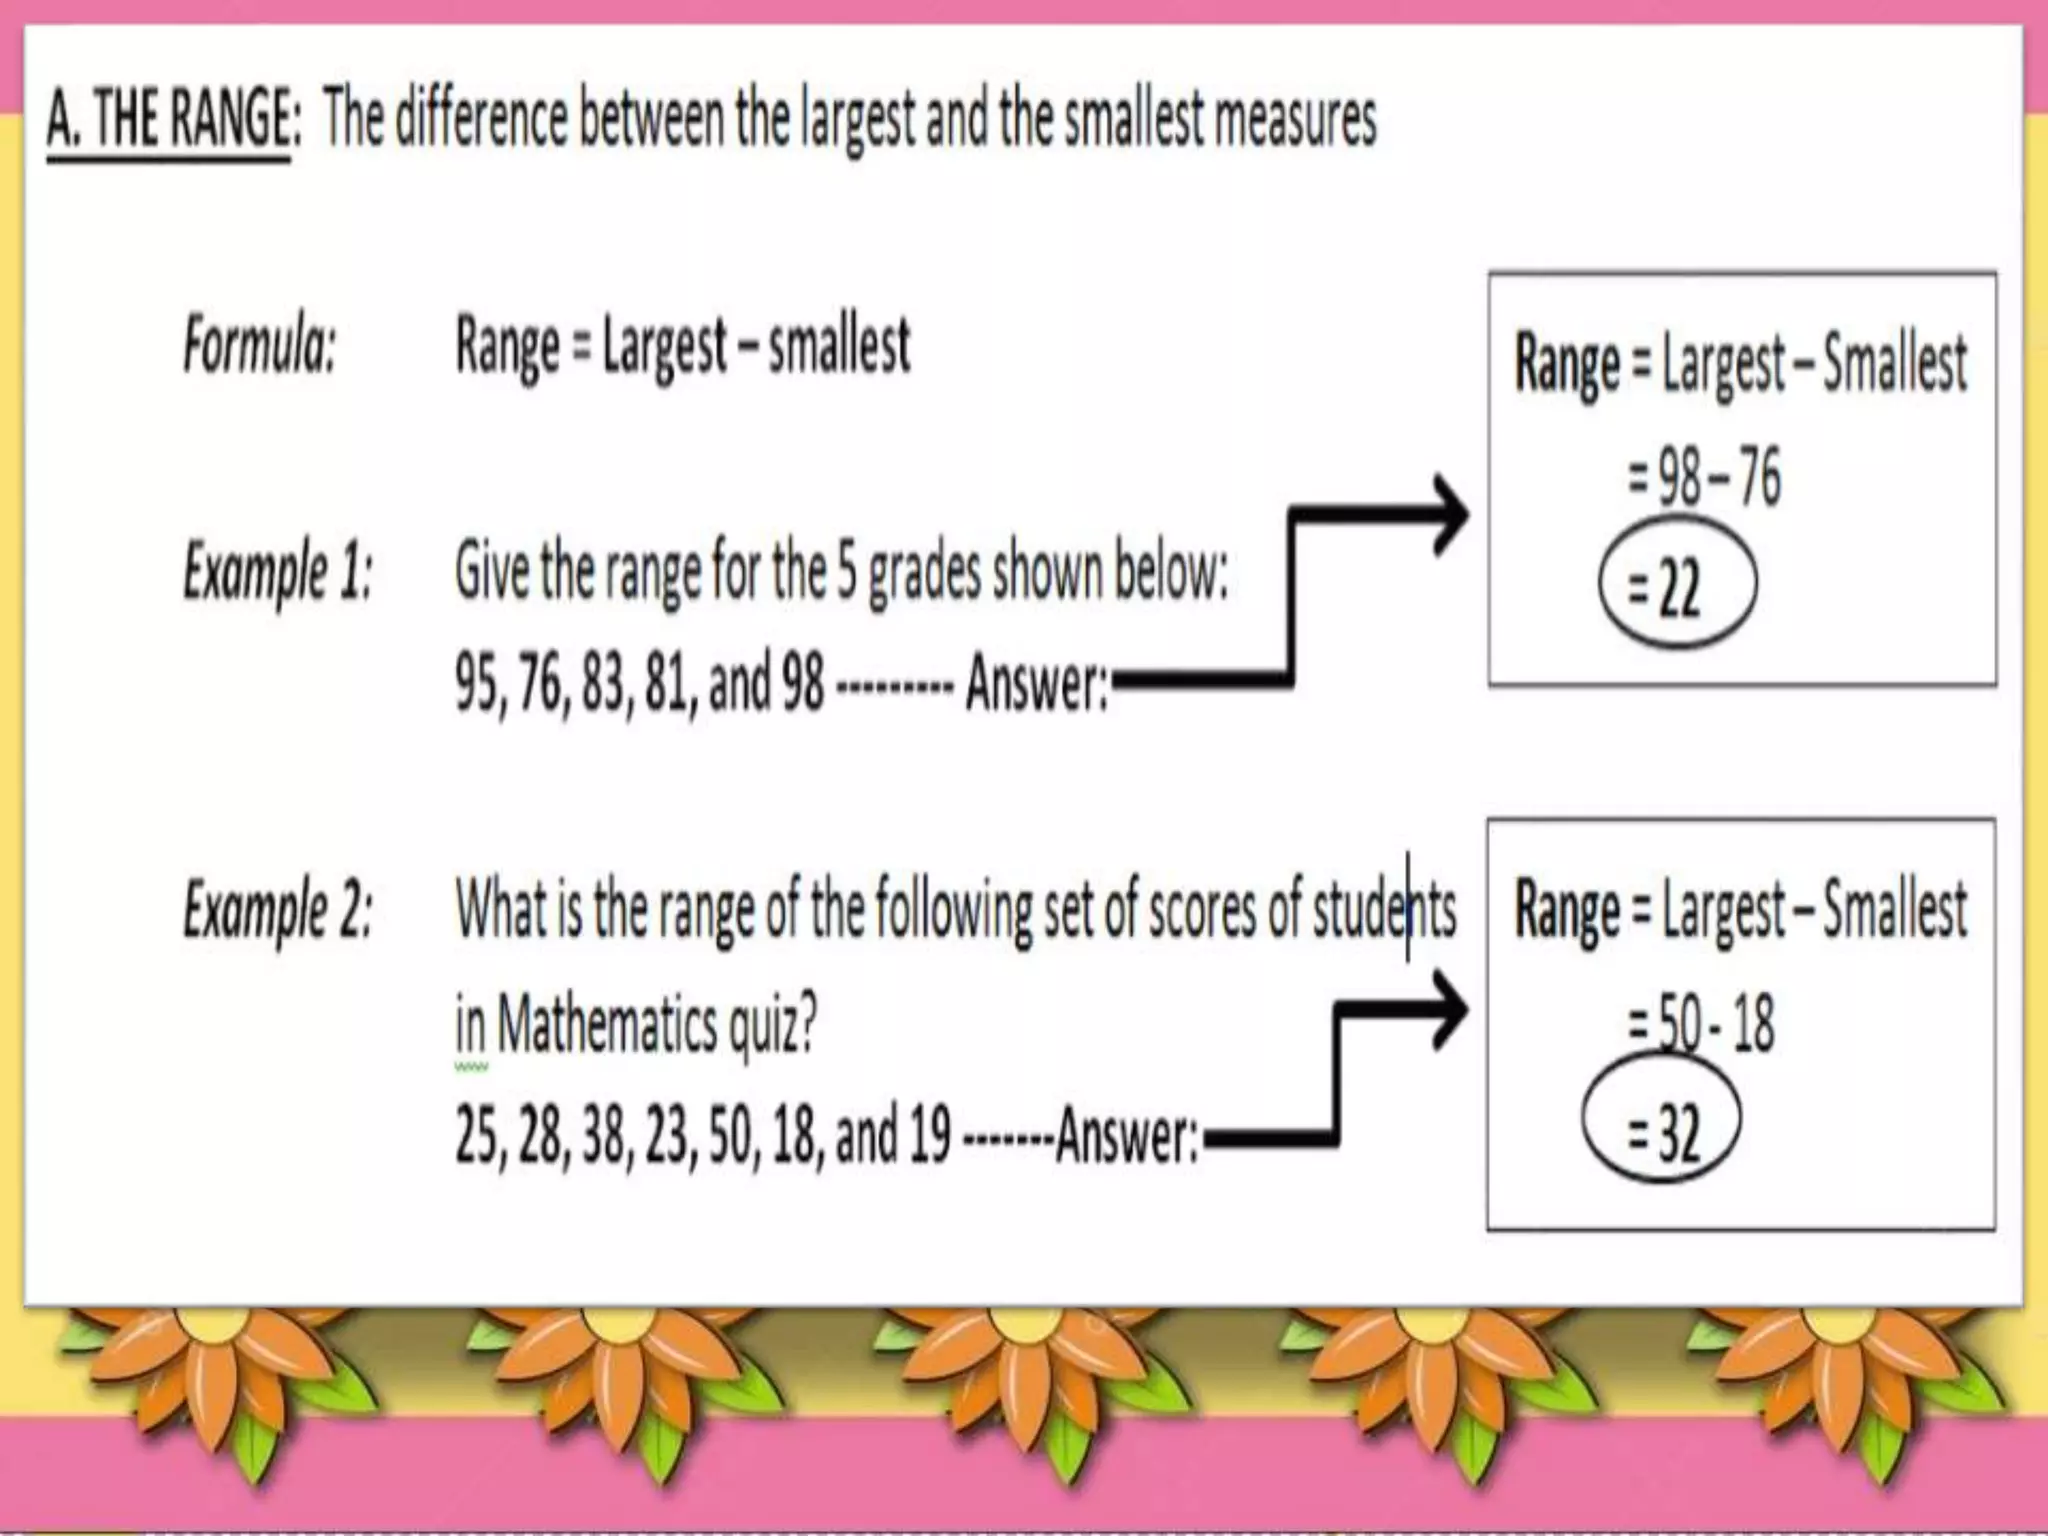
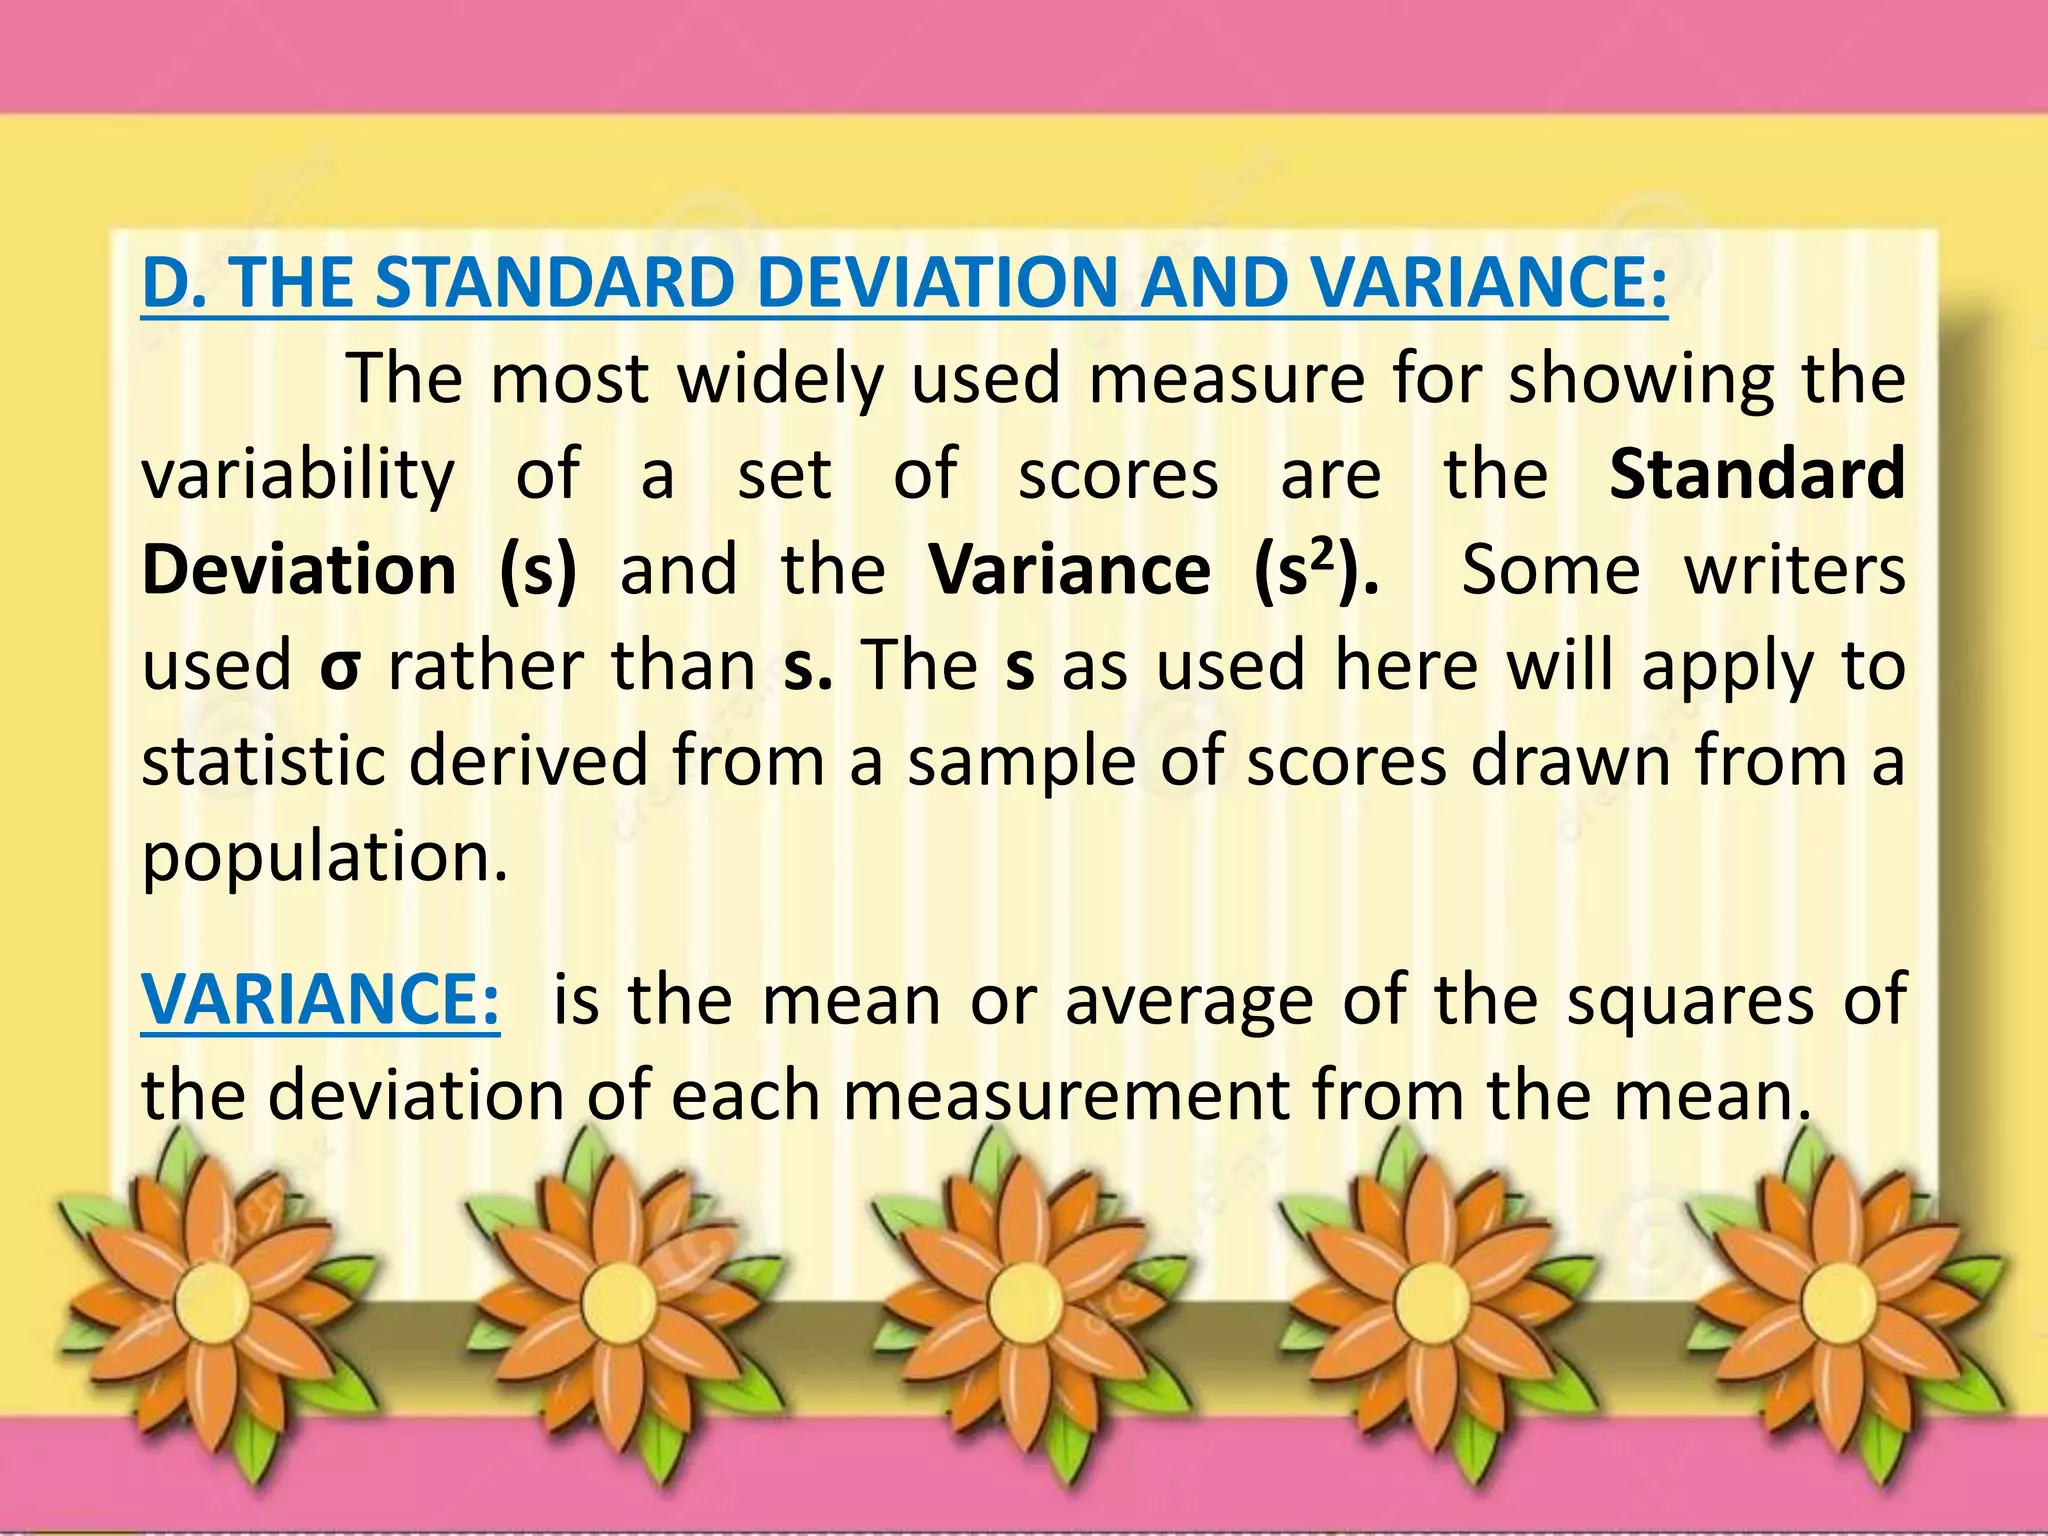
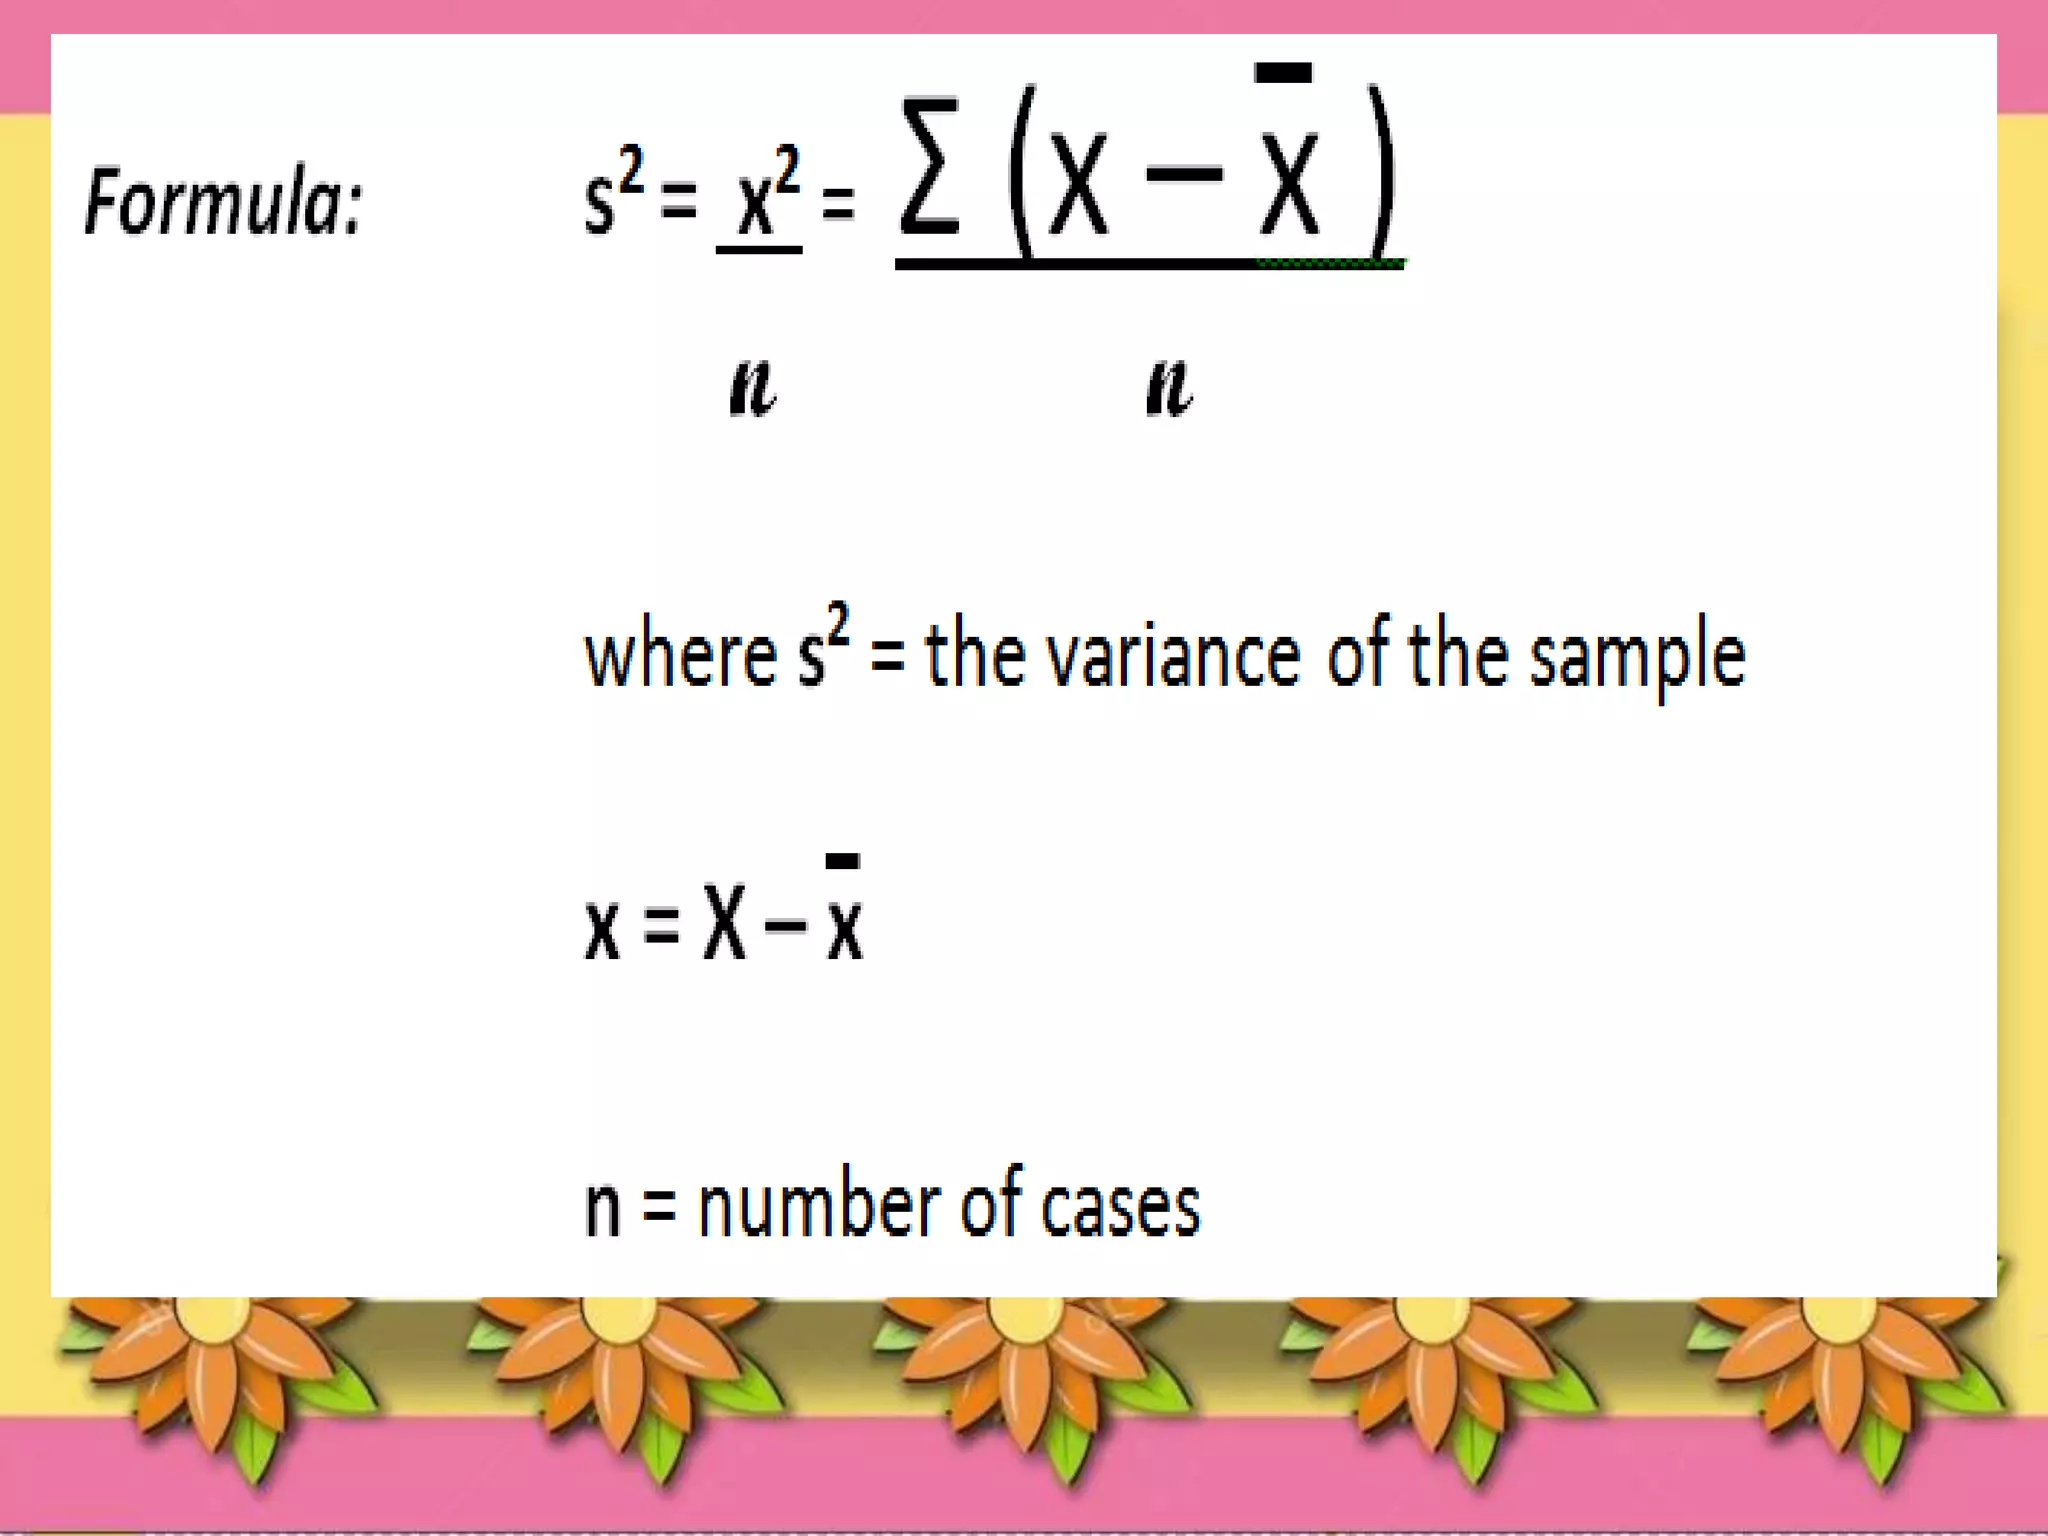
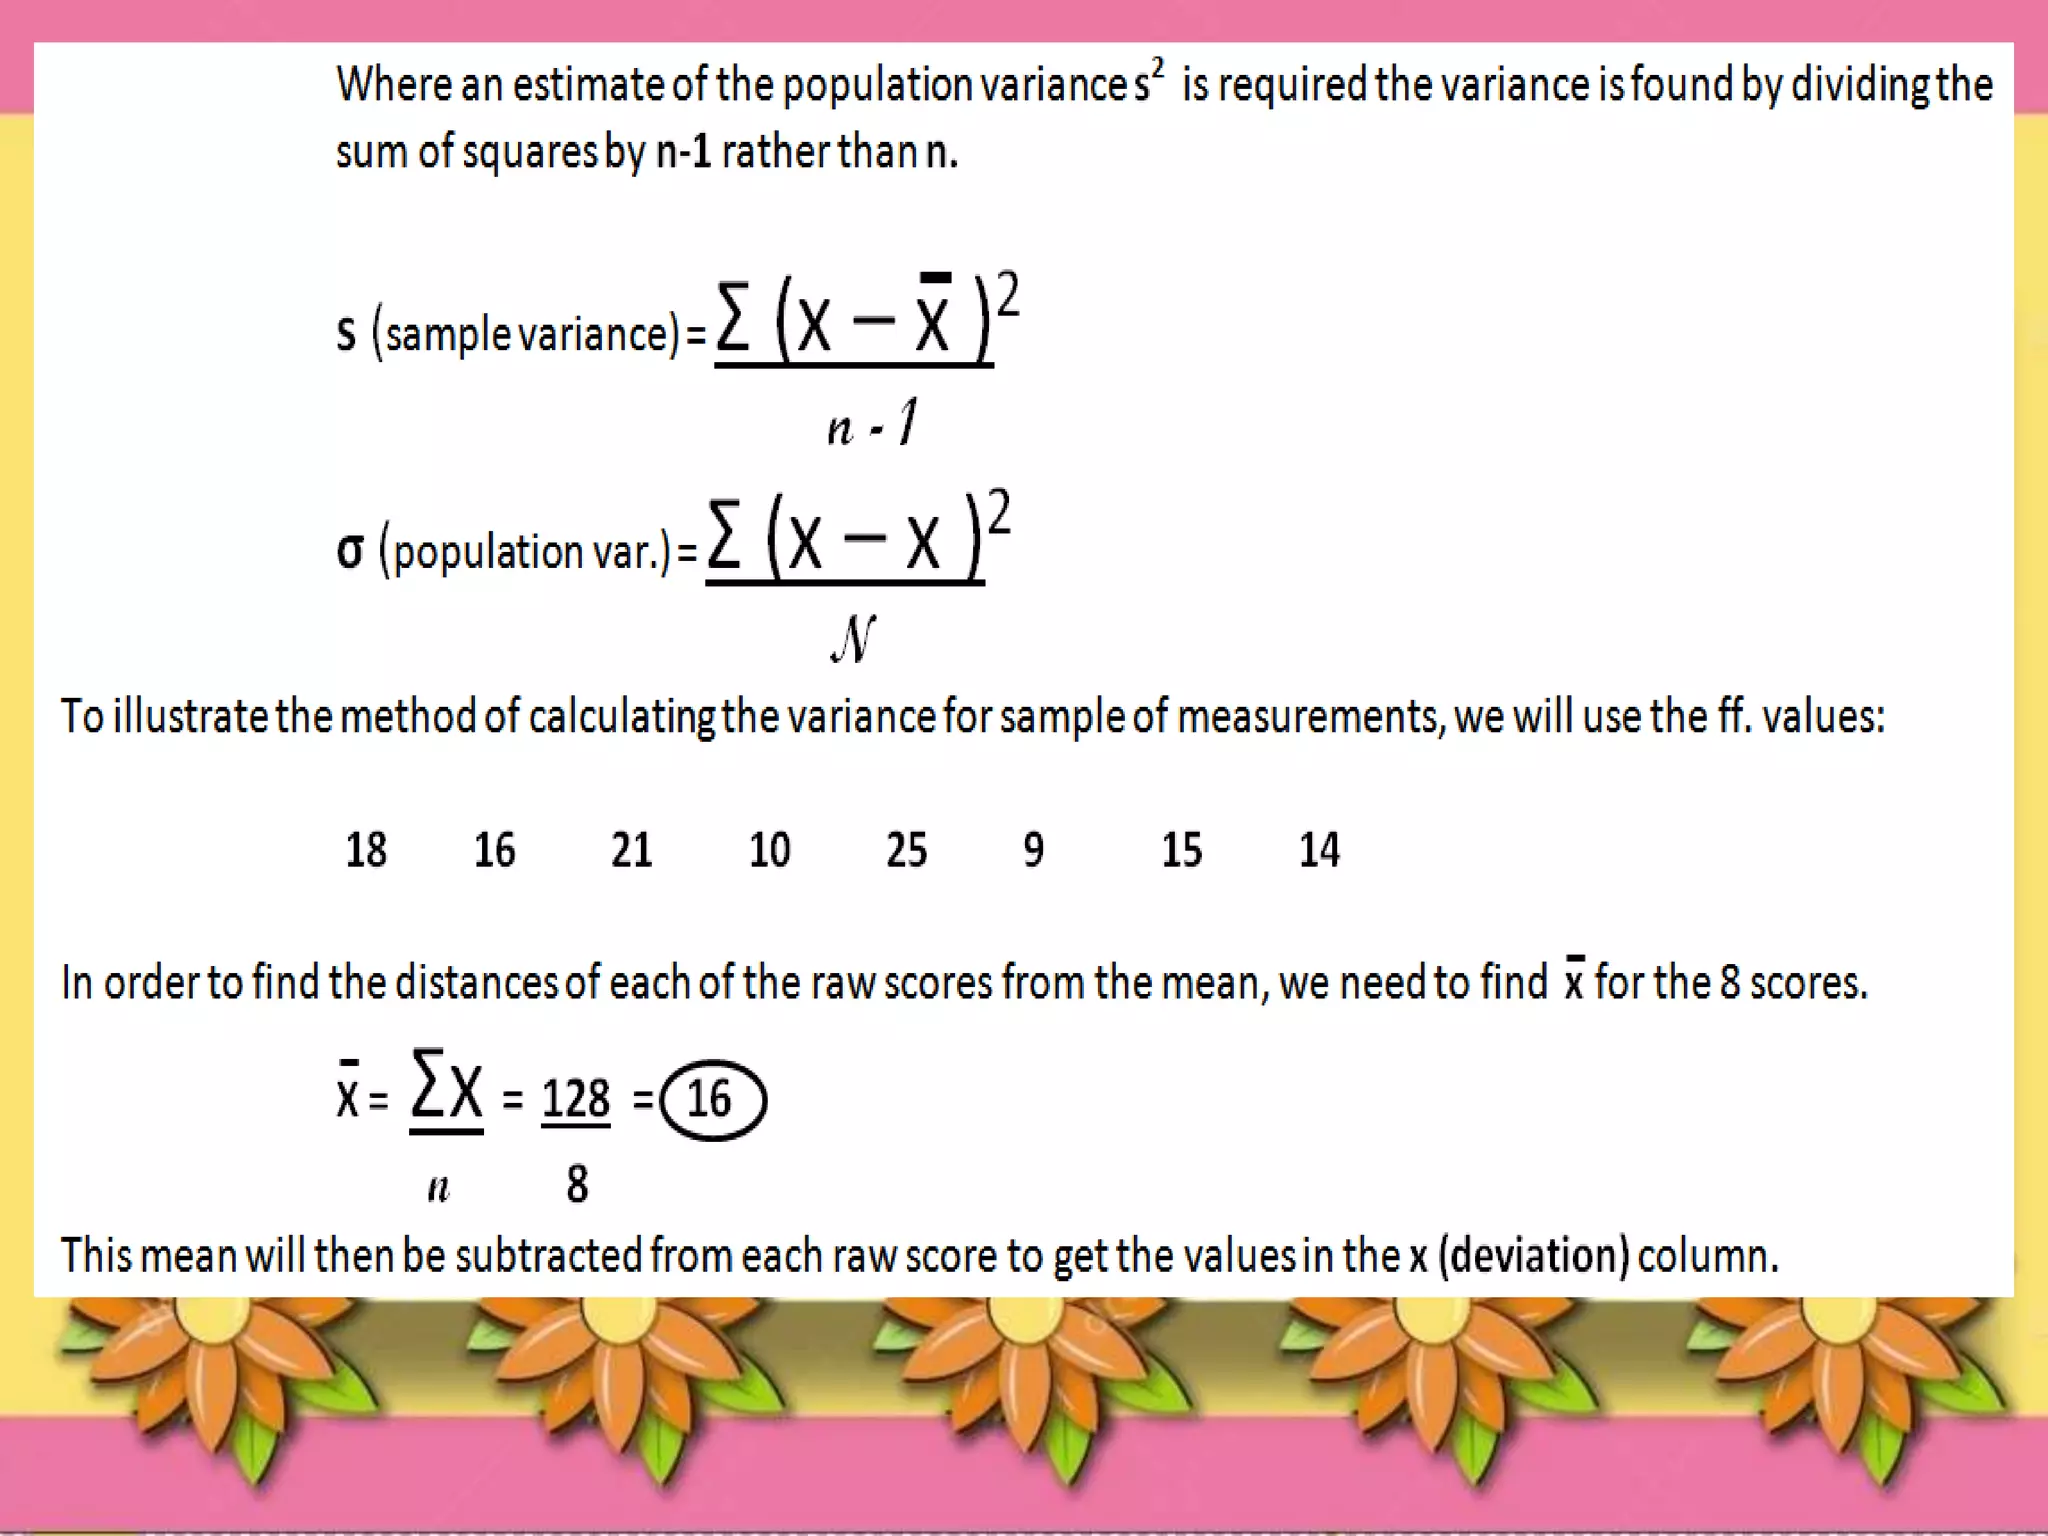
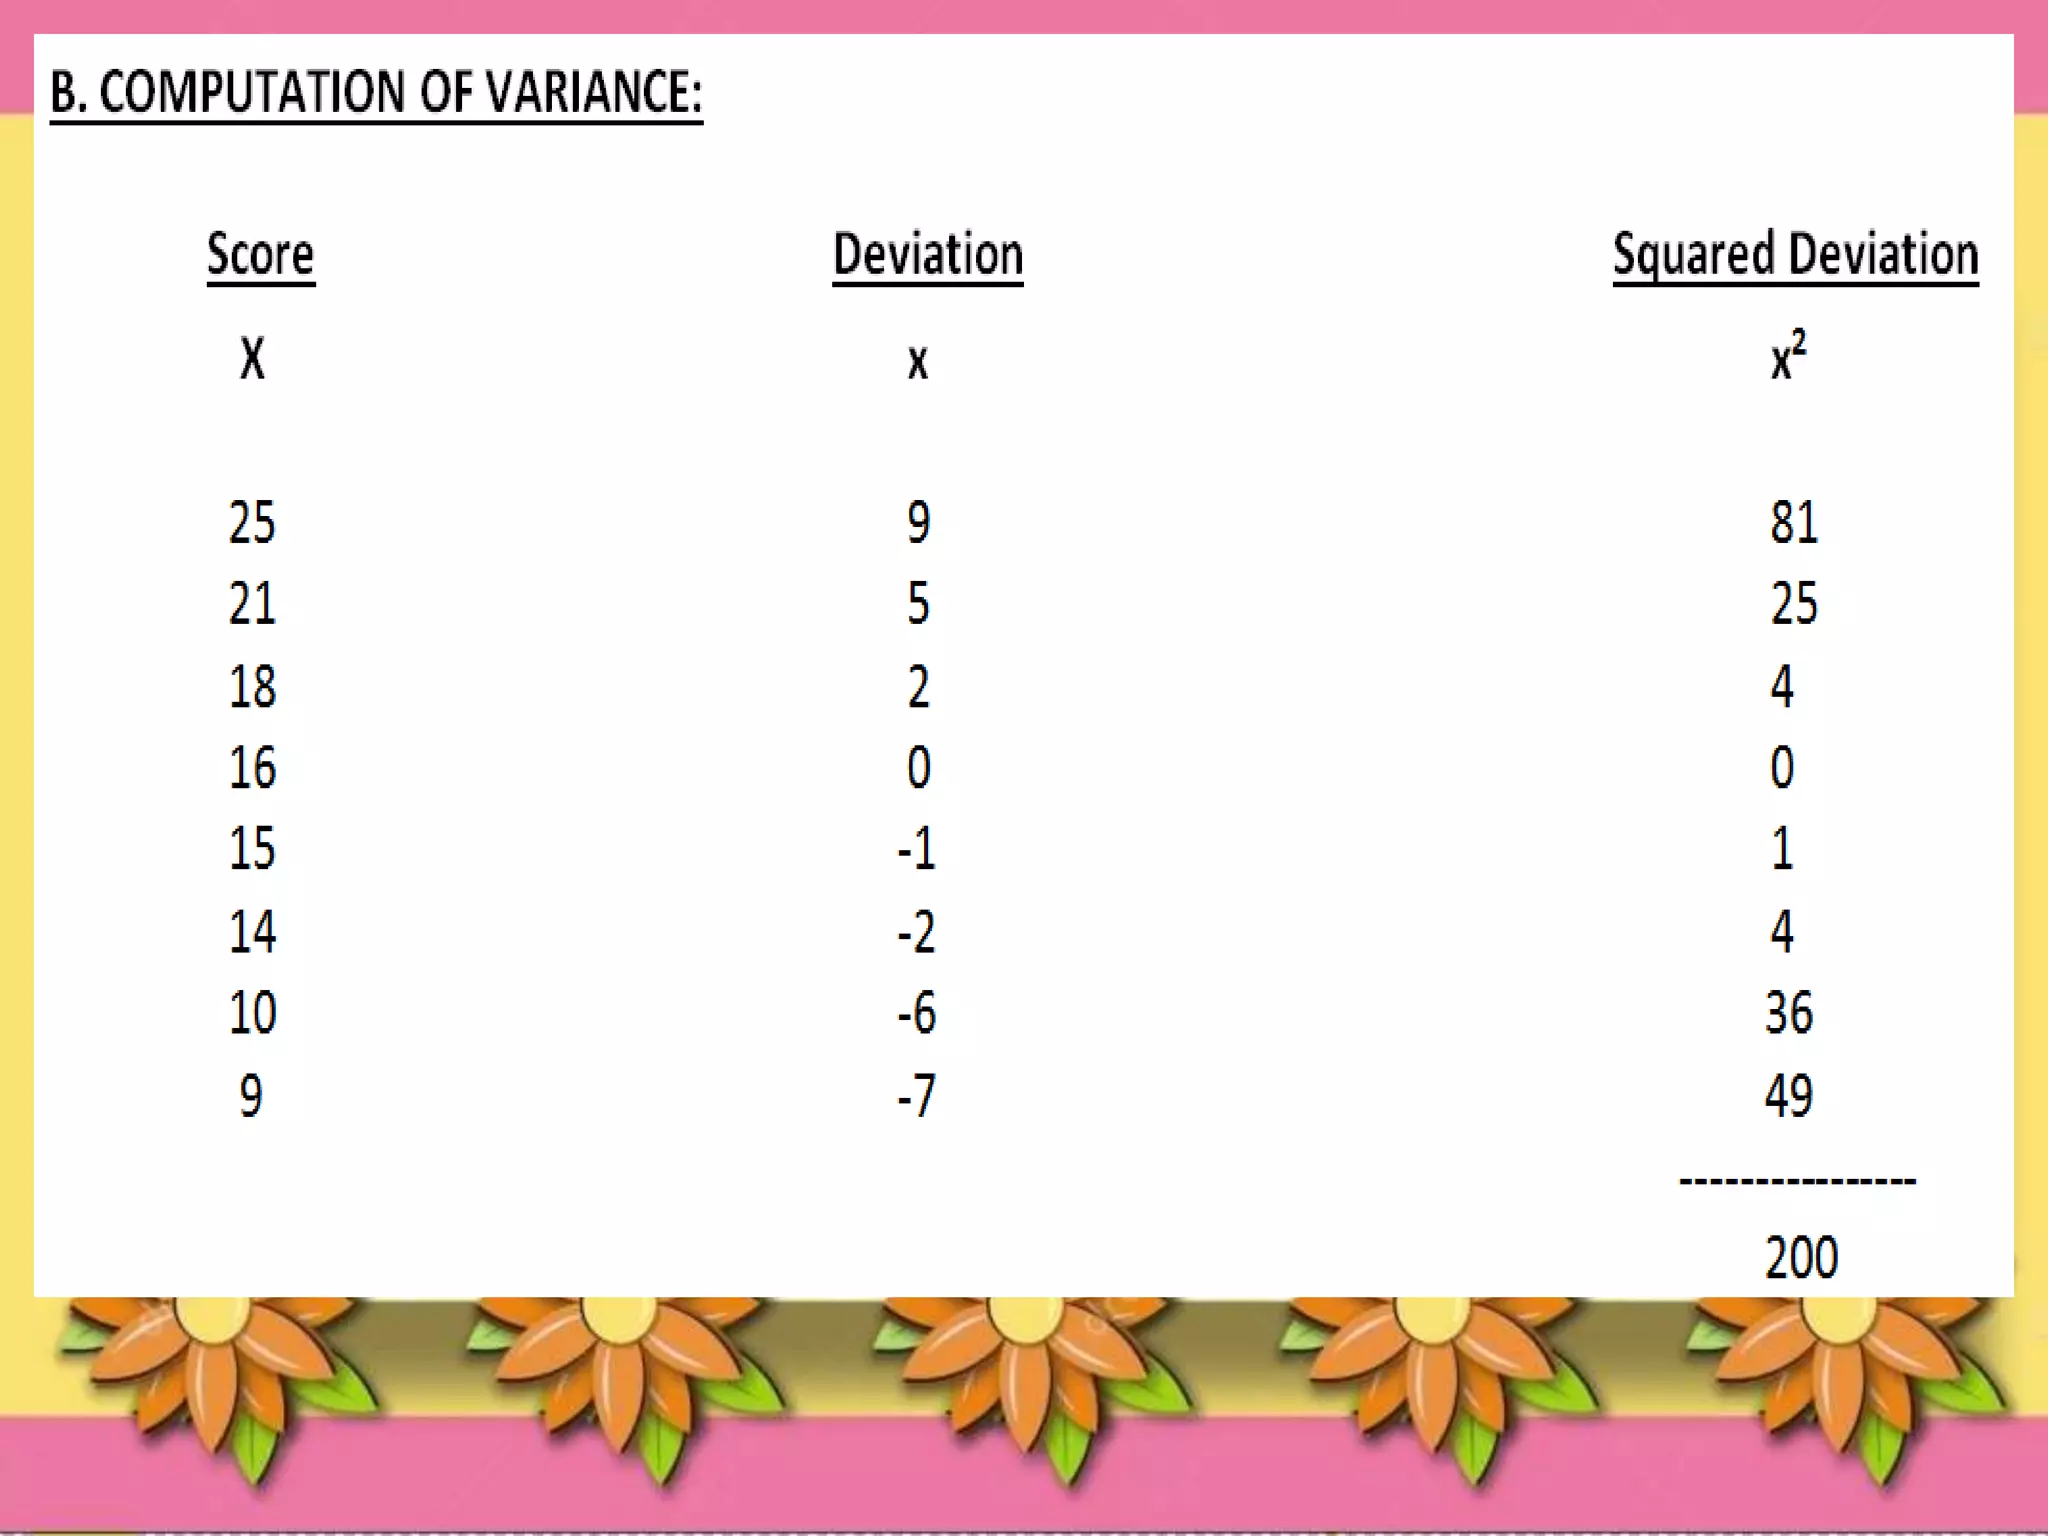
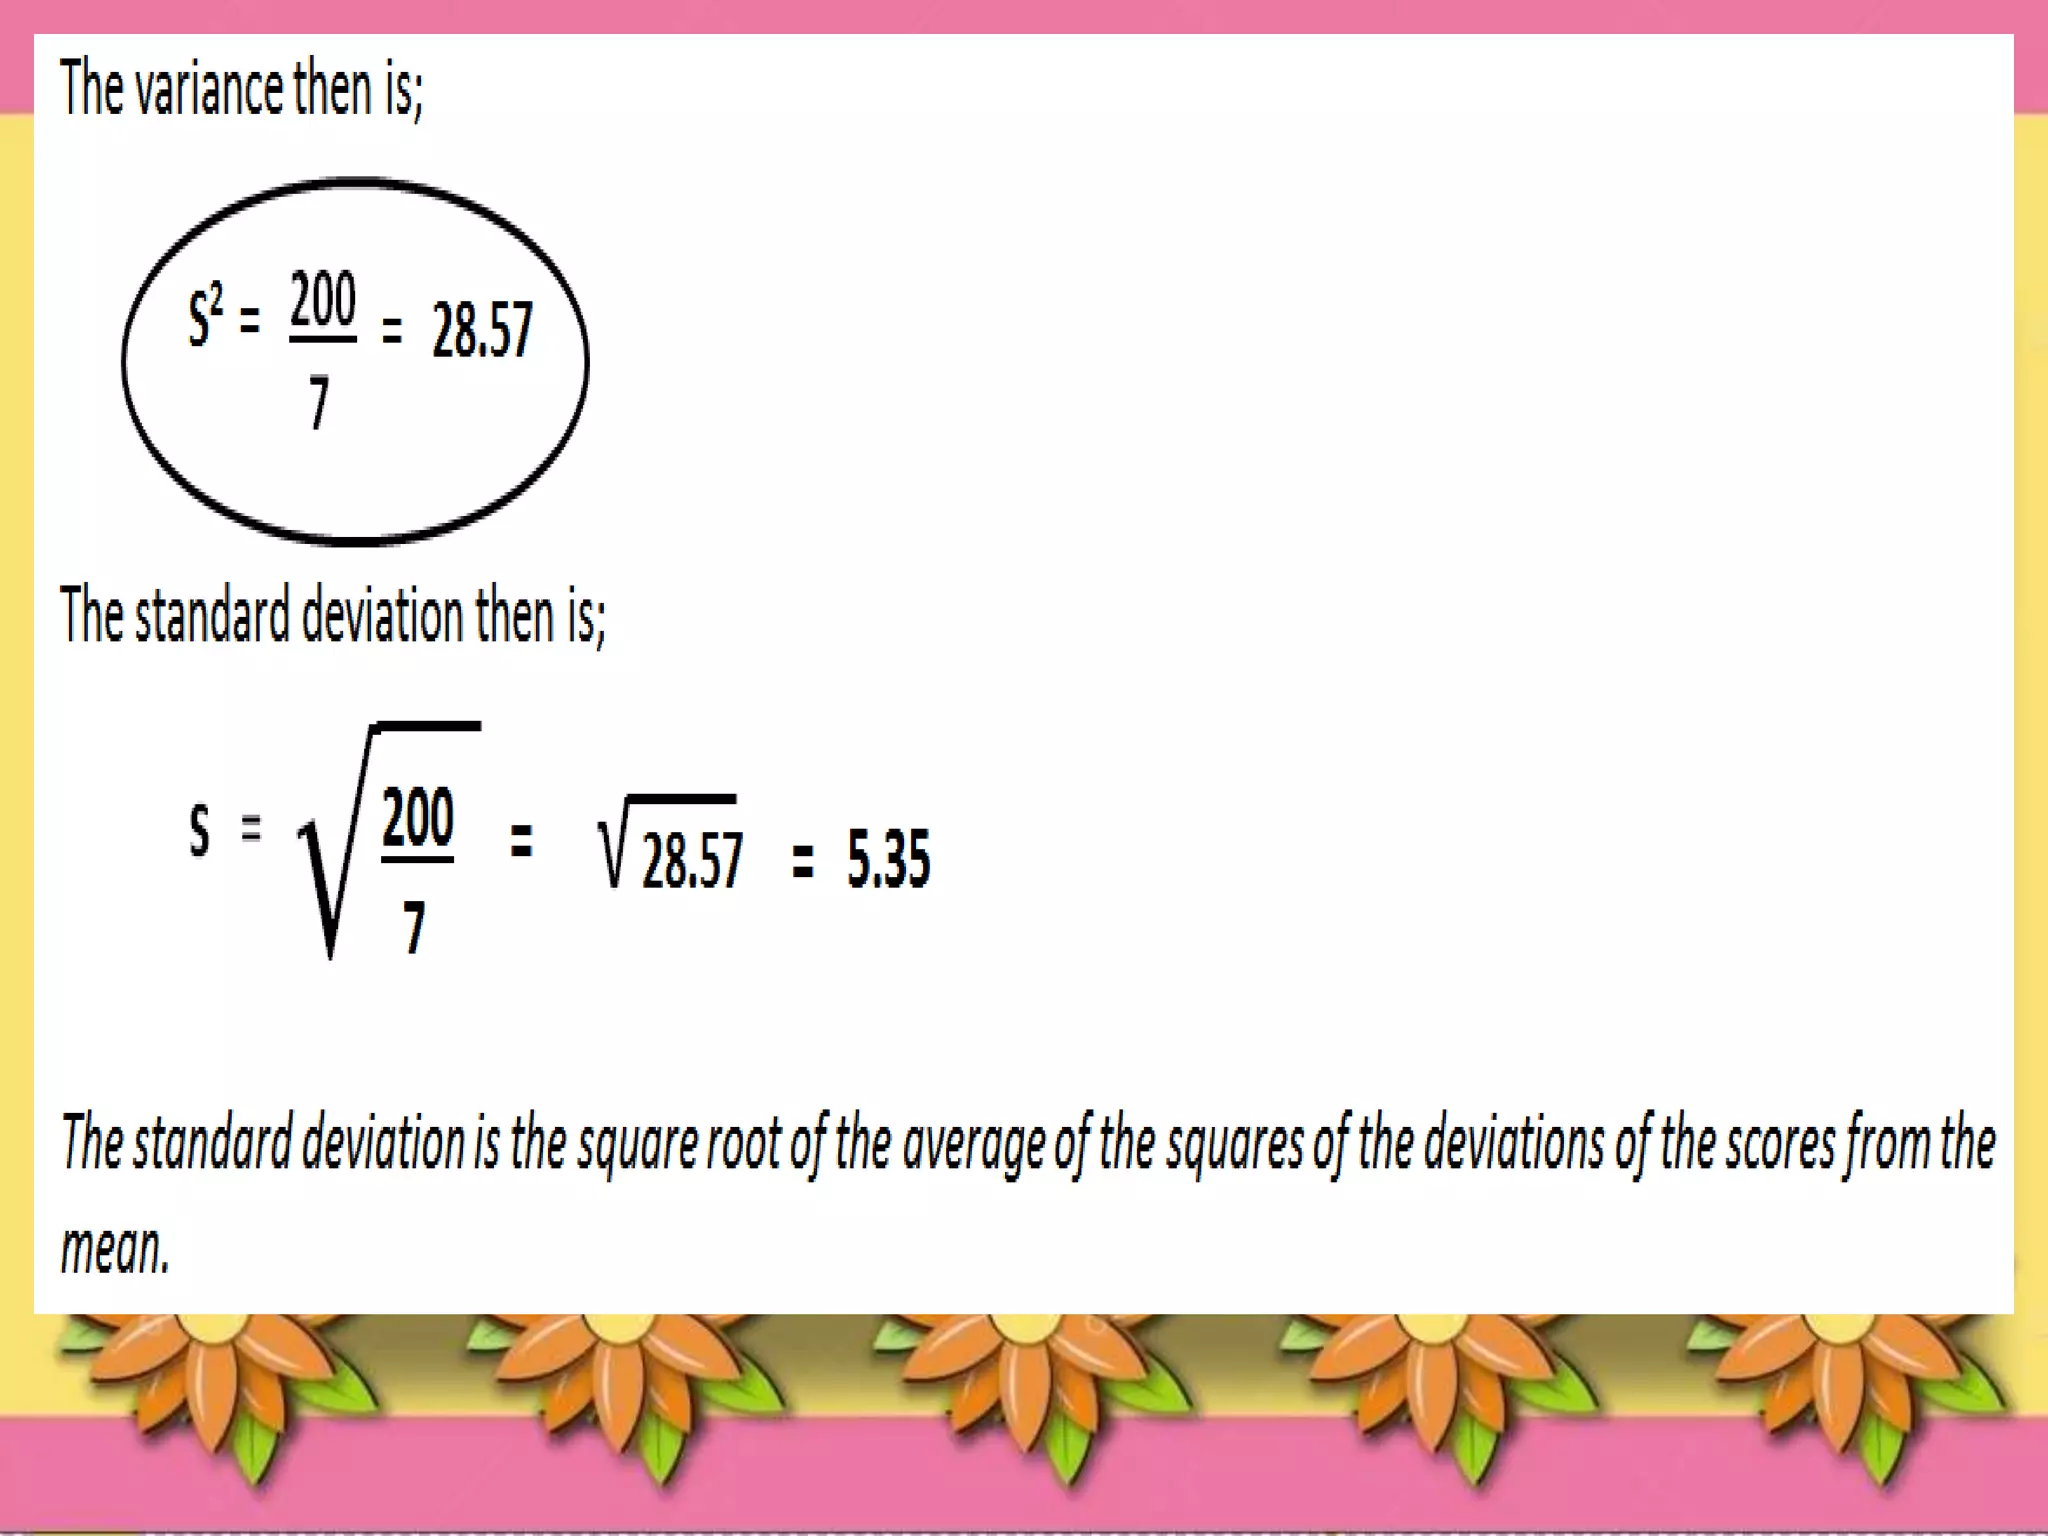


This document discusses measures of variability, which refer to how spread out a set of data is. Variability is measured using the standard deviation and variance. The standard deviation measures how far data points are from the mean, while the variance is the average of the squared deviations from the mean. To calculate the standard deviation, you take the square root of the variance. This provides a measure of variability that is on the same scale as the original data. The standard deviation and variance are widely used statistical measures for quantifying the spread of a data set.