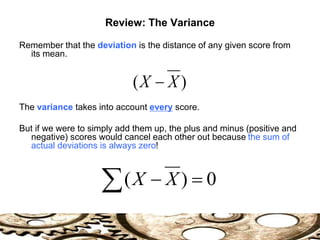
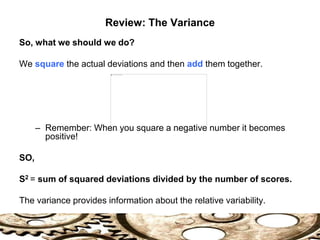
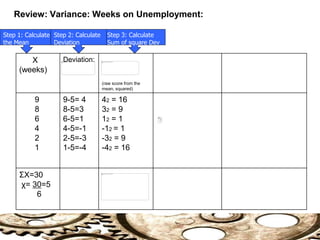
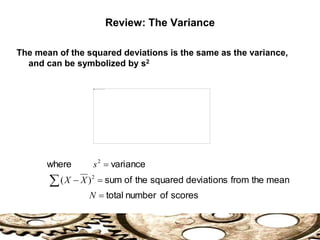
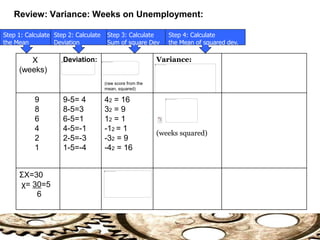
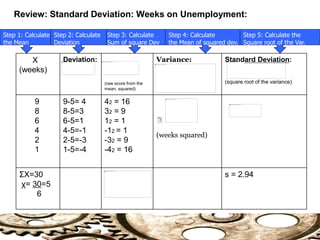
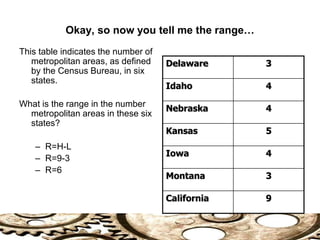
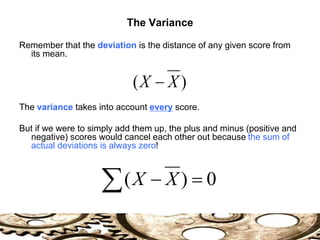
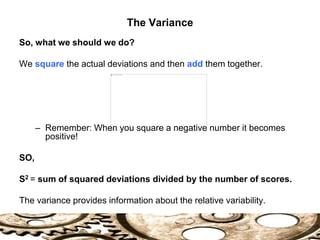
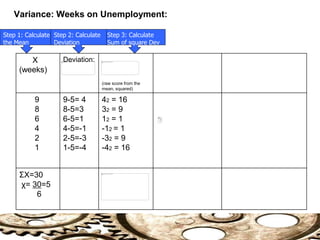
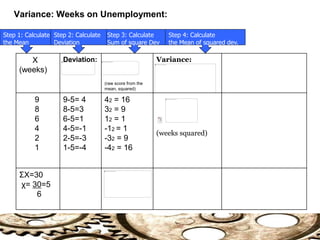
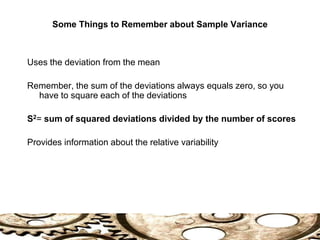
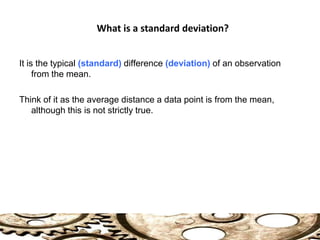
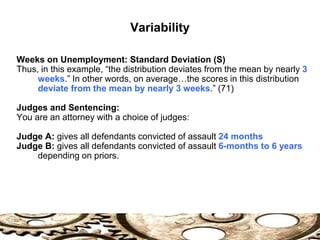
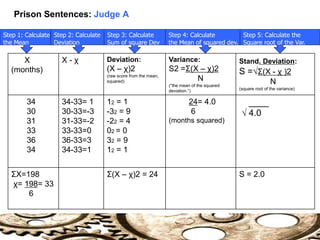
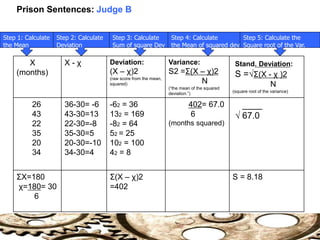
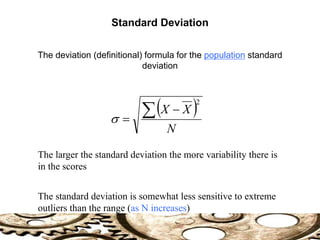
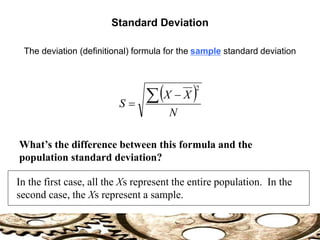
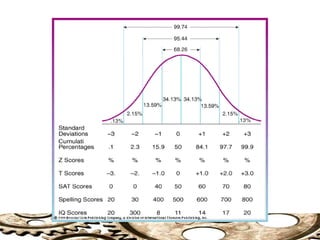
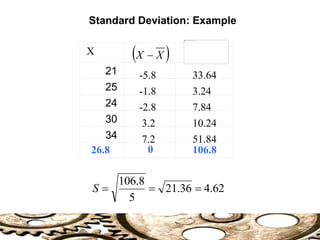
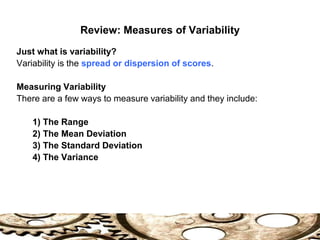
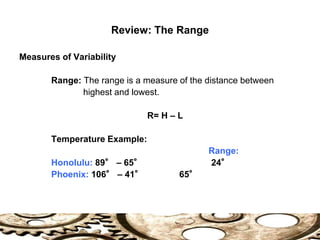
This document discusses measures of variability used in statistics. It defines variability as the spread or dispersion of scores. The key measures of variability discussed are the range, variance, and standard deviation. The range is the difference between the highest and lowest scores. The variance is the average of the squared deviations from the mean and represents how far the scores deviate from the mean. The standard deviation is the square root of the variance and represents how much scores typically deviate from the mean. Larger standard deviations indicate greater variability in the scores.


![Variance and Standard Deviation
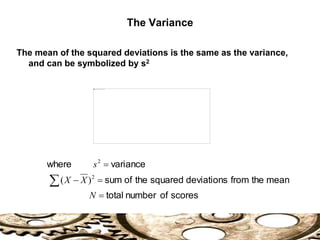
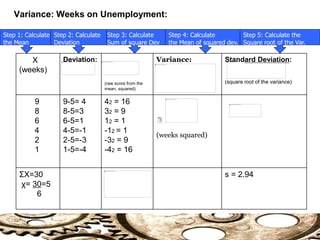
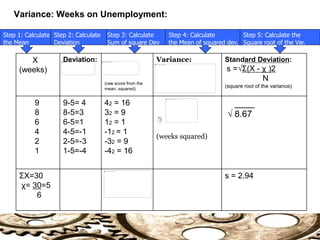
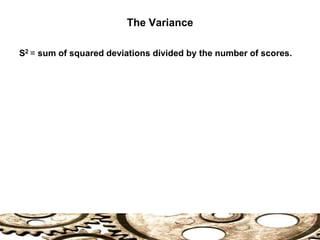
Variance: is a measure of the dispersion of a sample (or how
closely the observations cluster around the mean [average]). Also
known as the mean of the squared deviations.
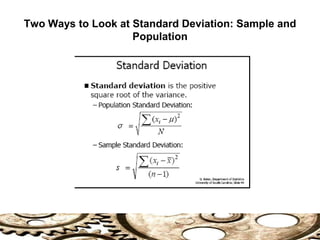
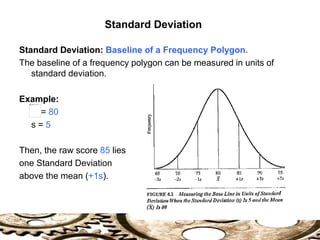
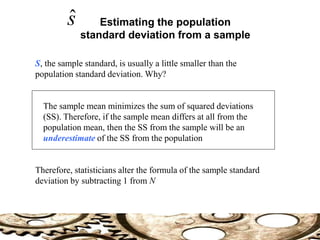
Standard Deviation: the square root of the variance, is the measure
of variation in the observed values (or variation in the clustering
around the mean).](https://image.slidesharecdn.com/ch-4-measures-of-variability-11-230505104710-6deaa615/85/measures-of-variability-11-ppt-11-320.jpg)


![Review: Variance and Standard Deviation
Variance: is a measure of the dispersion of a sample (or how
closely the observations cluster around the mean [average])
Standard Deviation: the square root of the variance, is the measure
of variation in the observed values (or variation in the clustering
around the mean).](https://image.slidesharecdn.com/ch-4-measures-of-variability-11-230505104710-6deaa615/85/measures-of-variability-11-ppt-53-320.jpg)