Downloaded 106 times
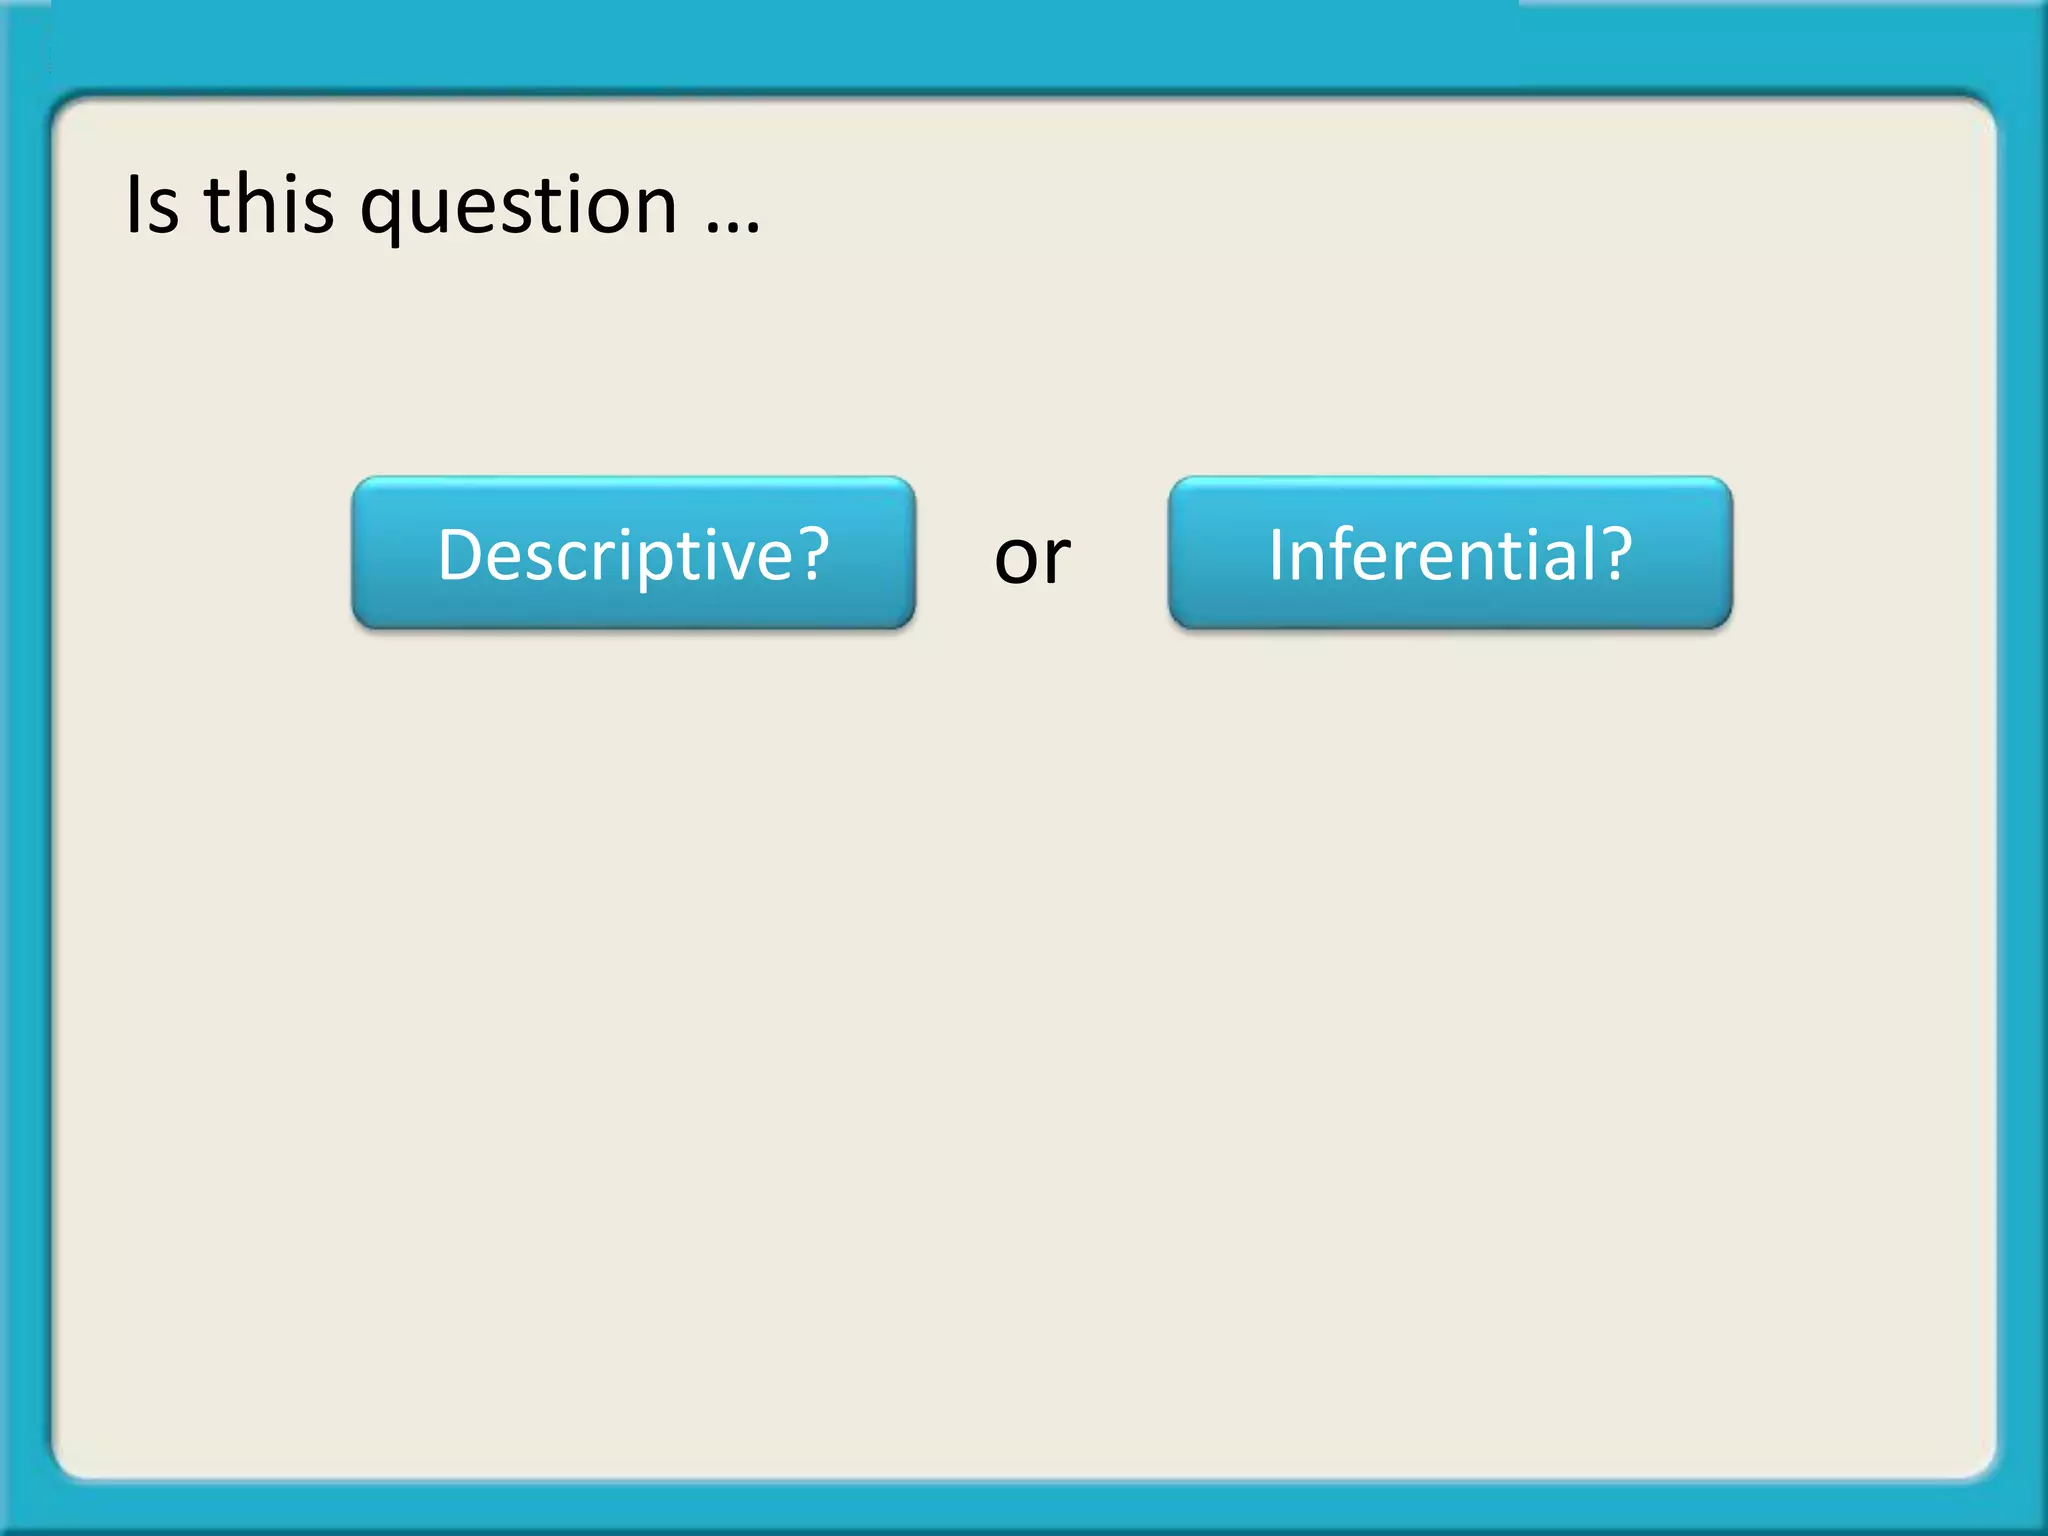
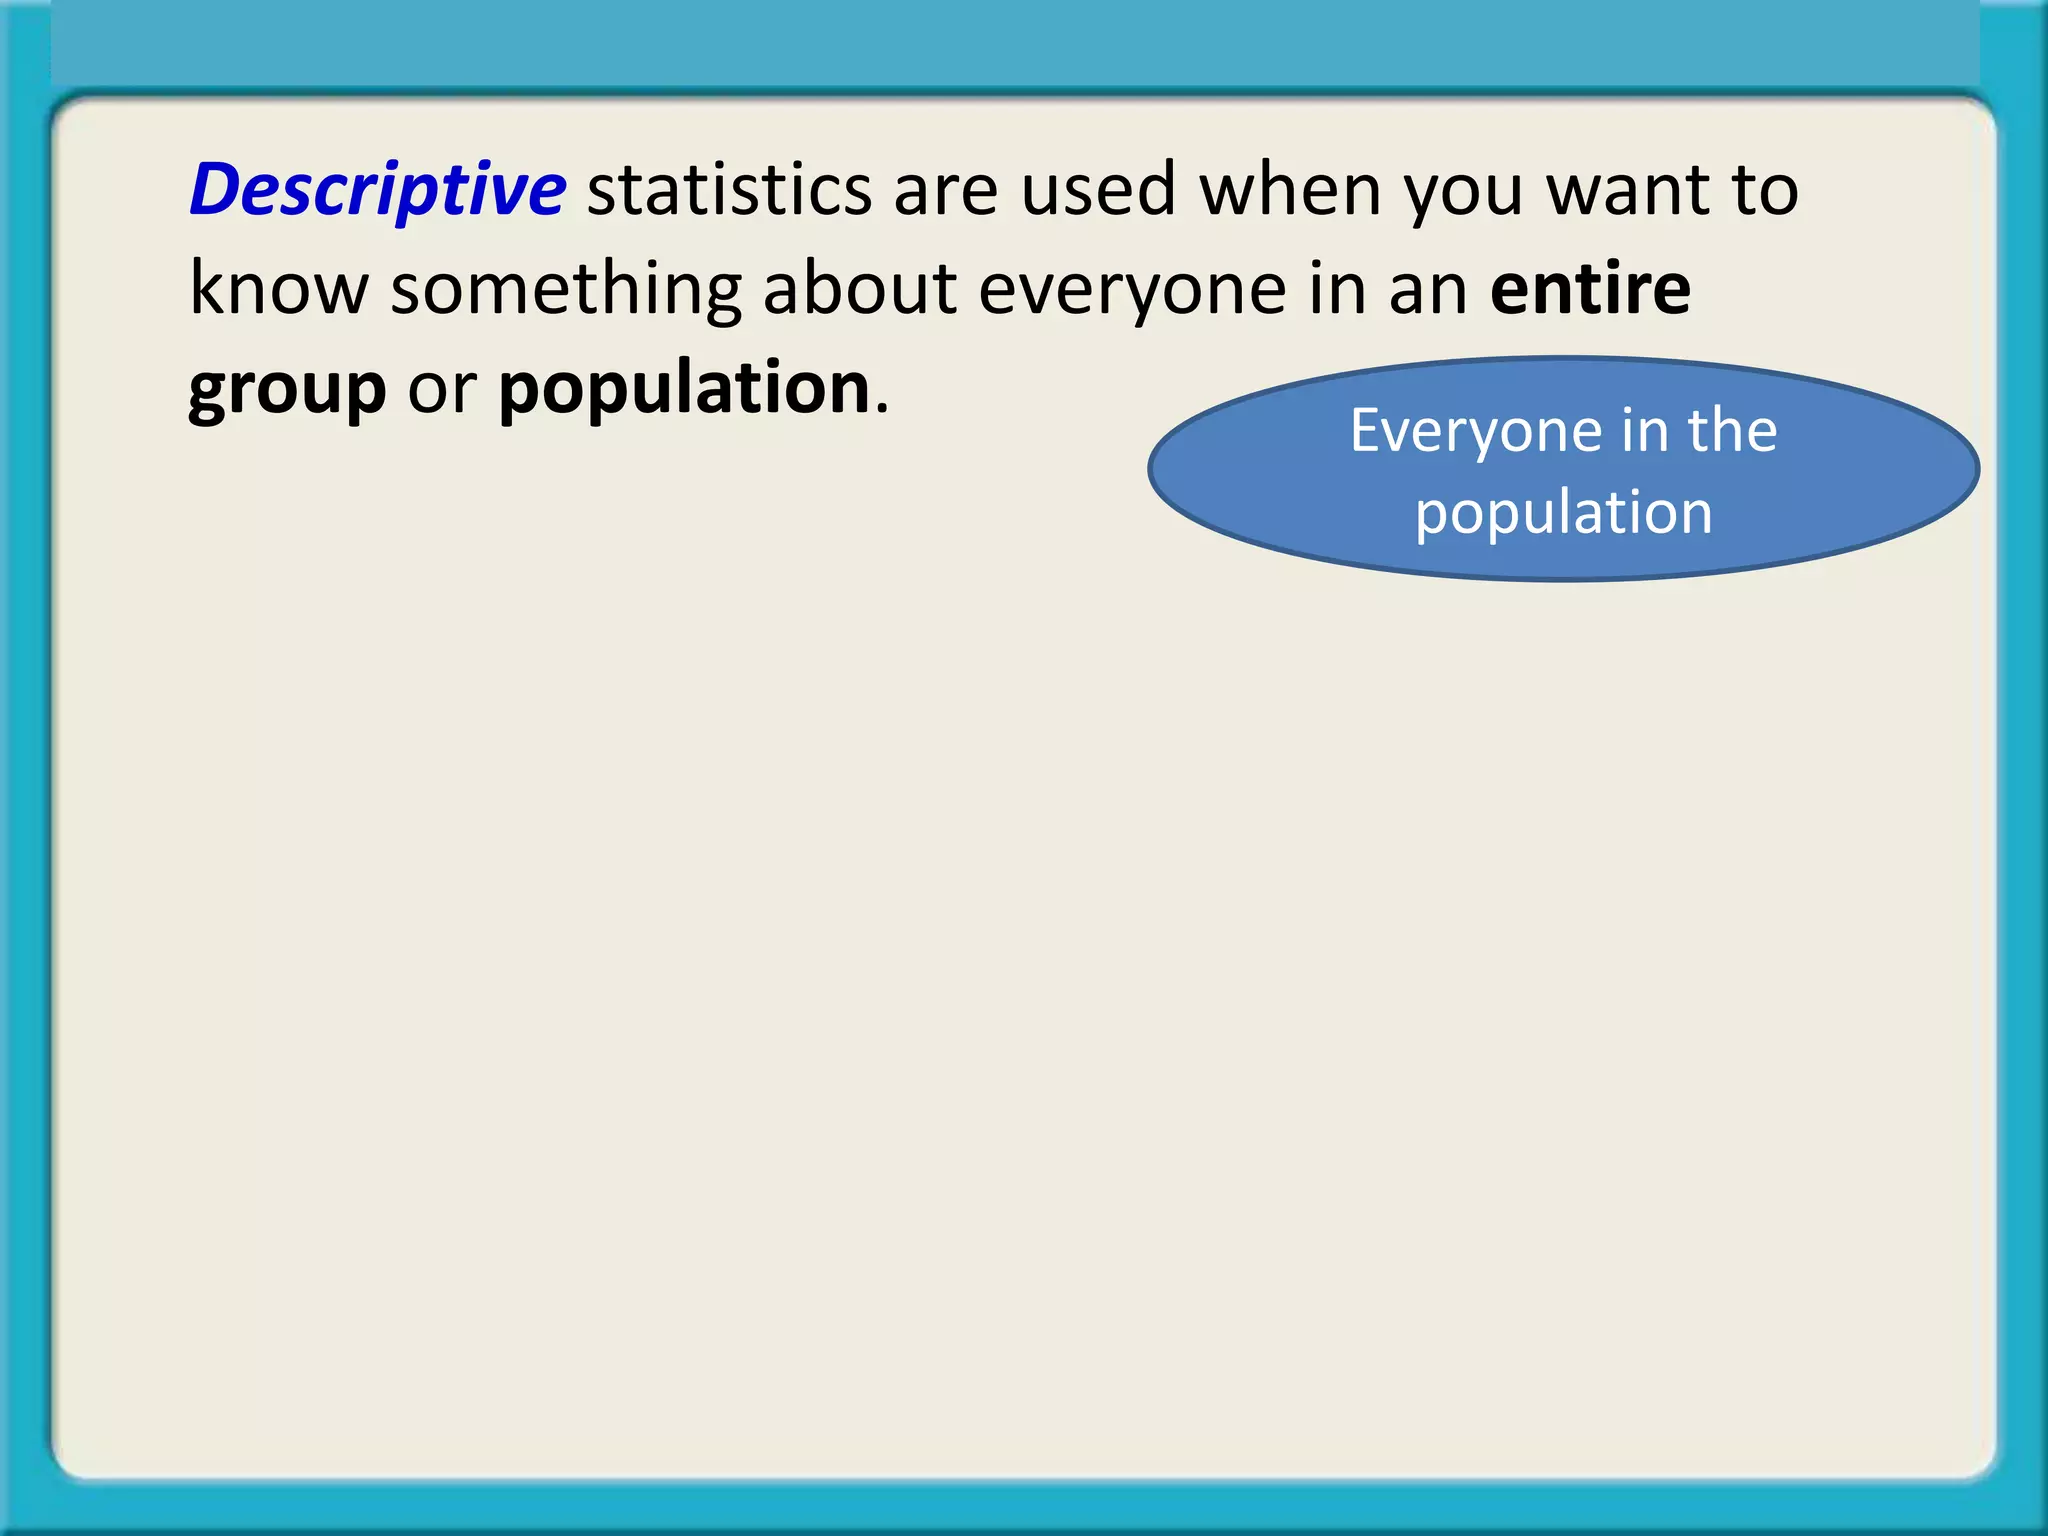


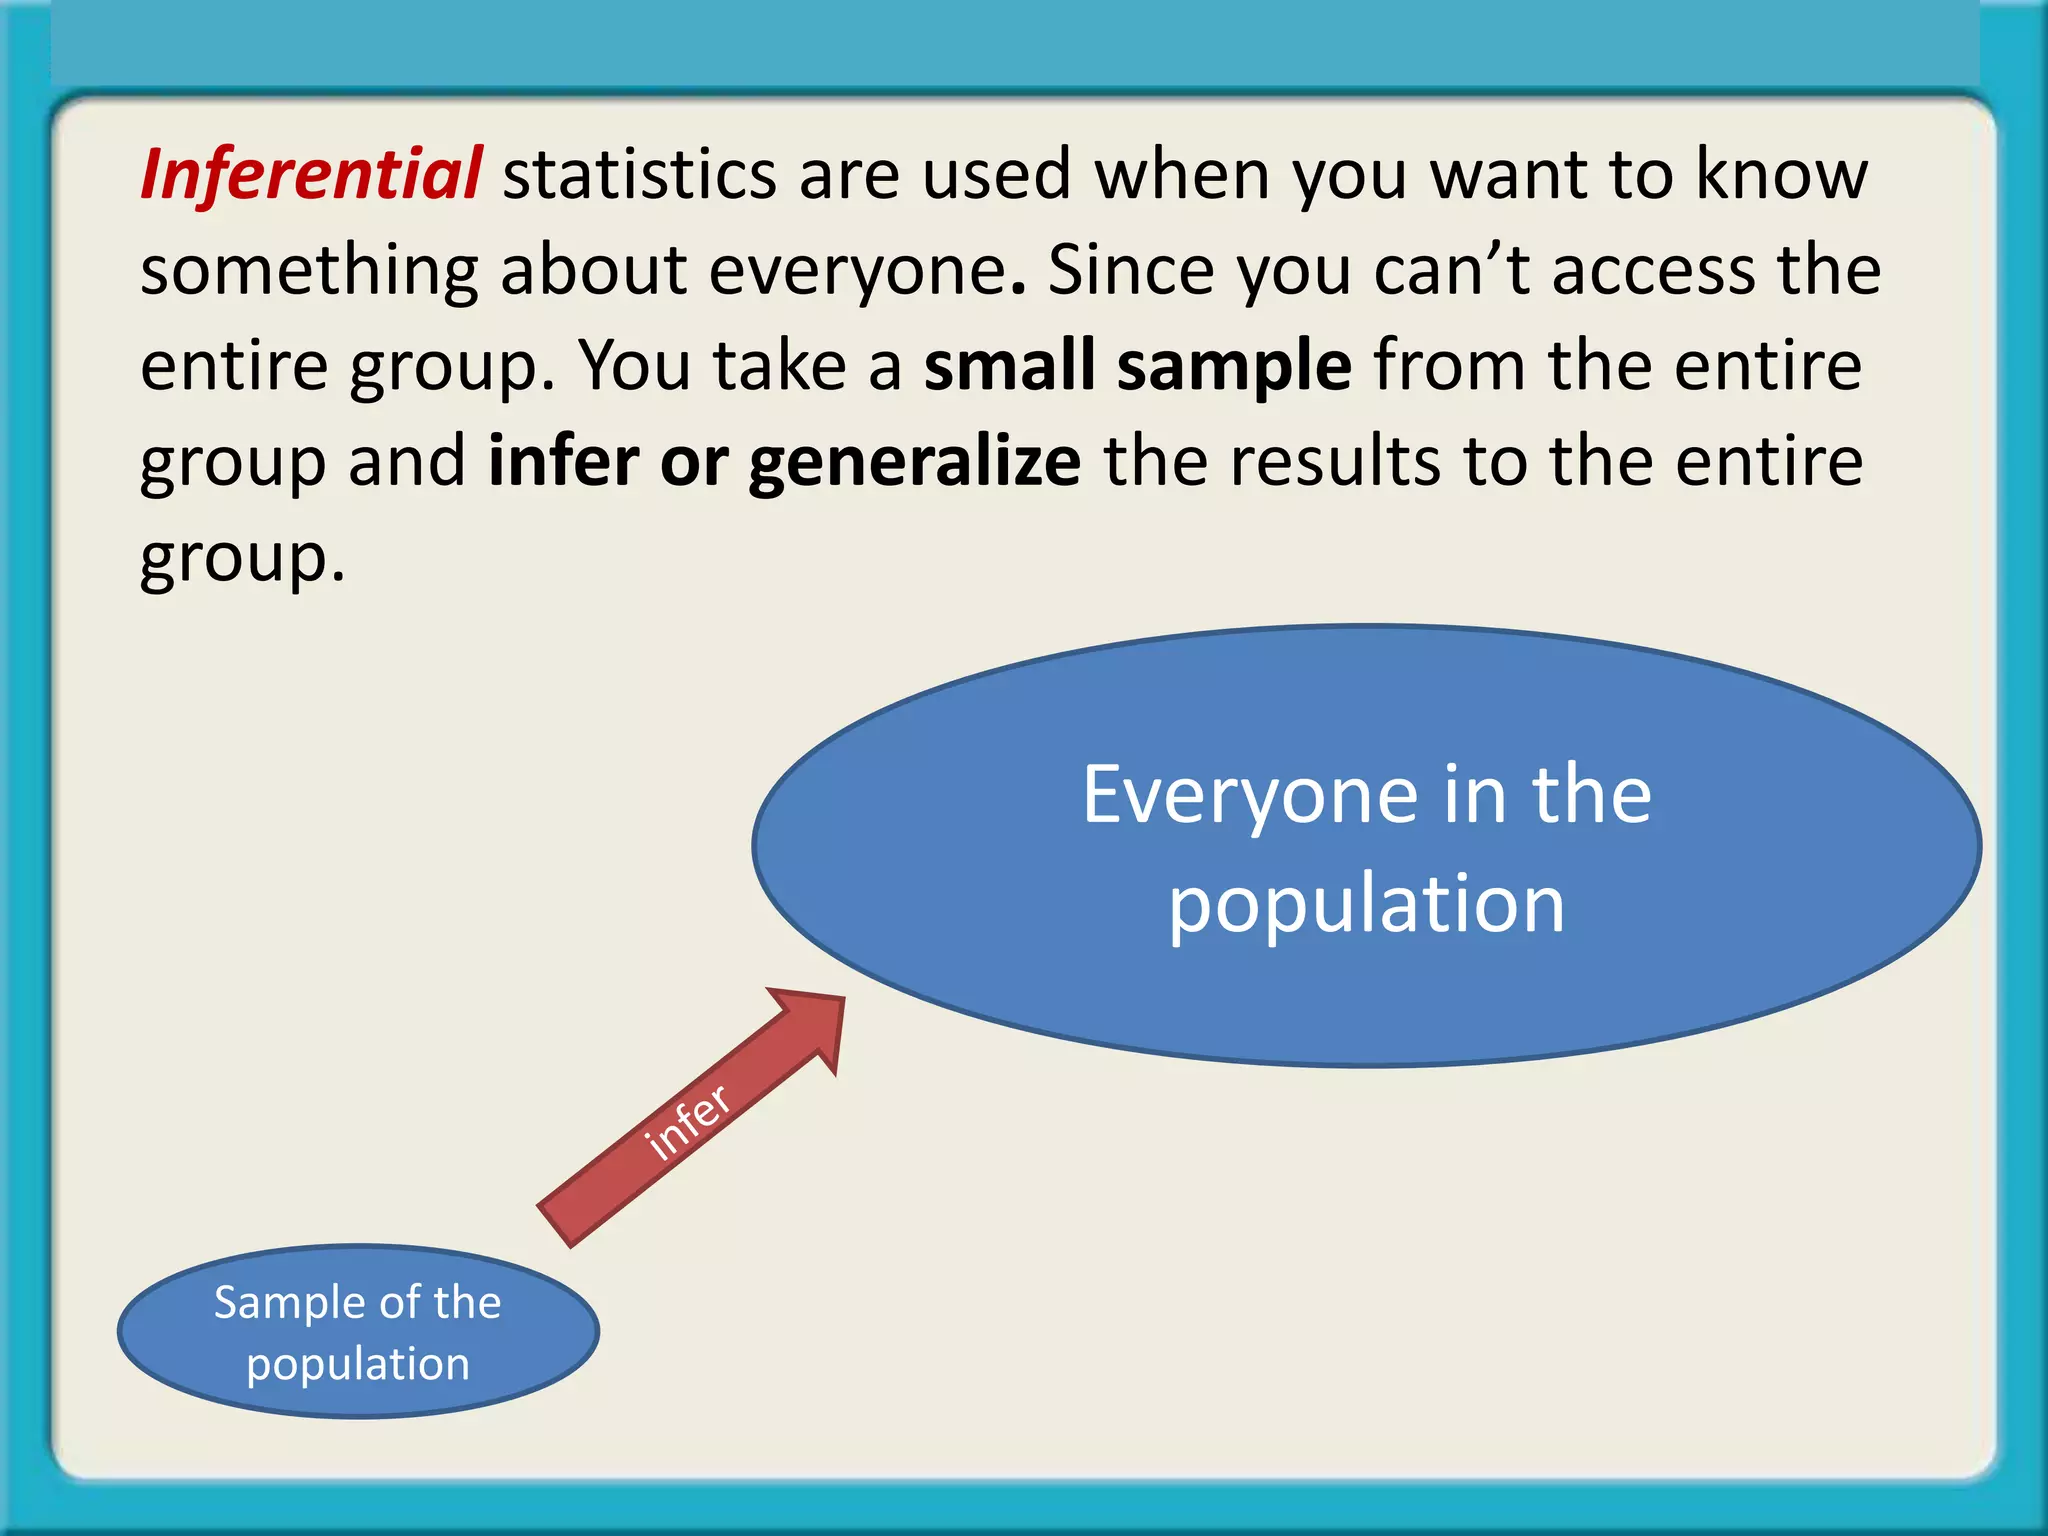
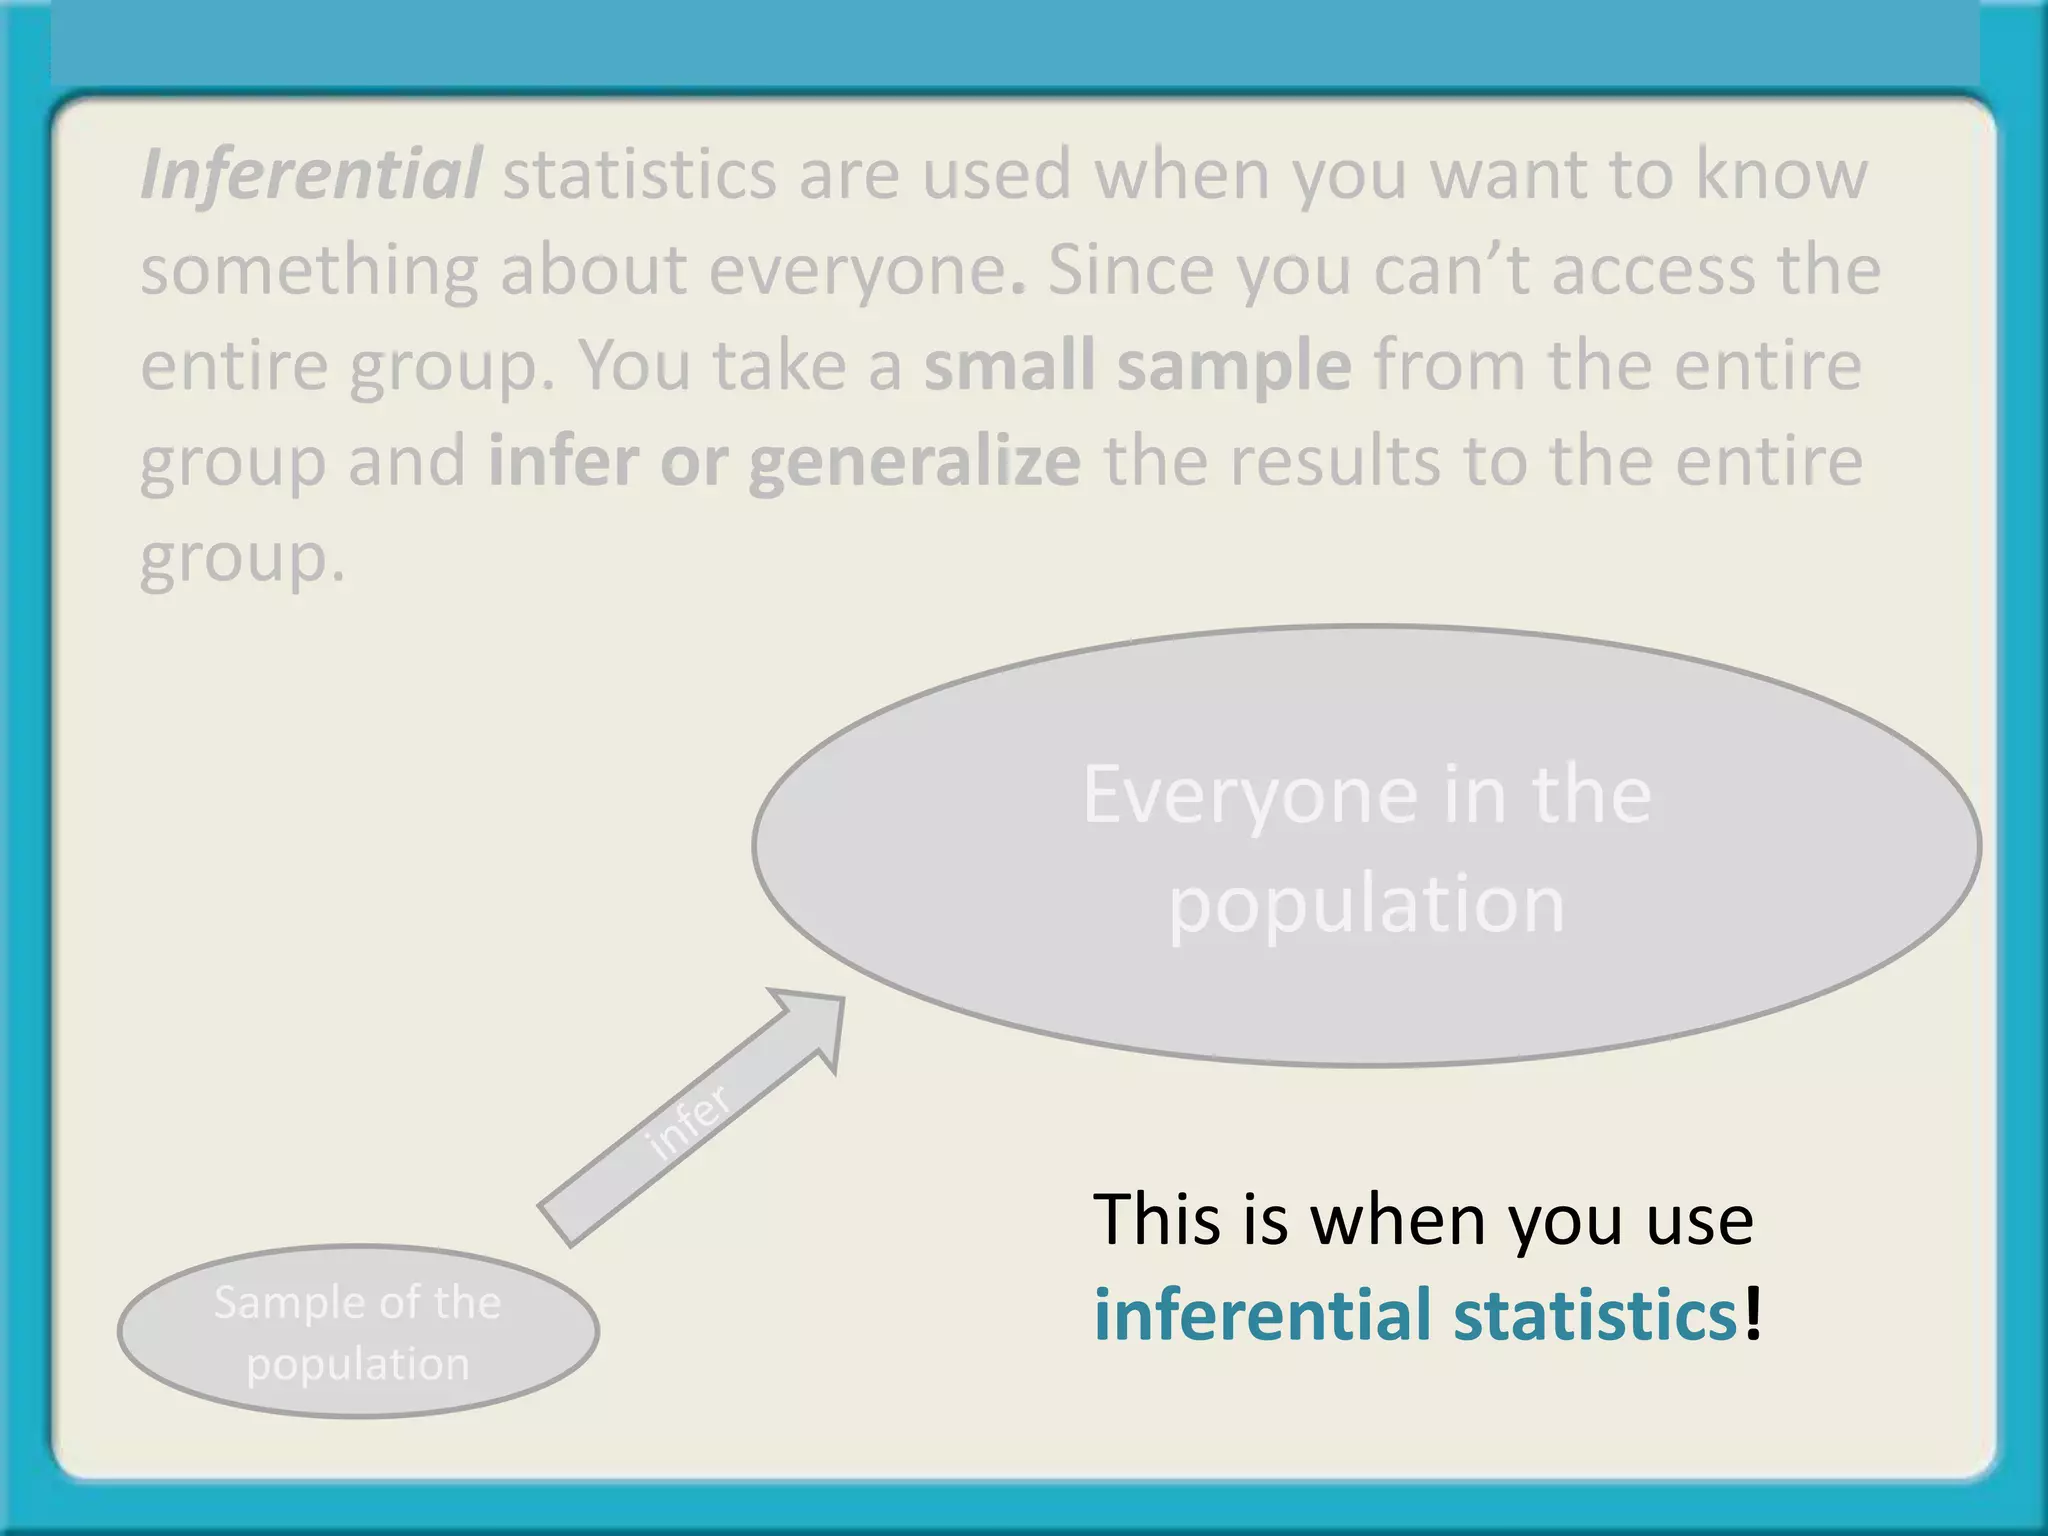
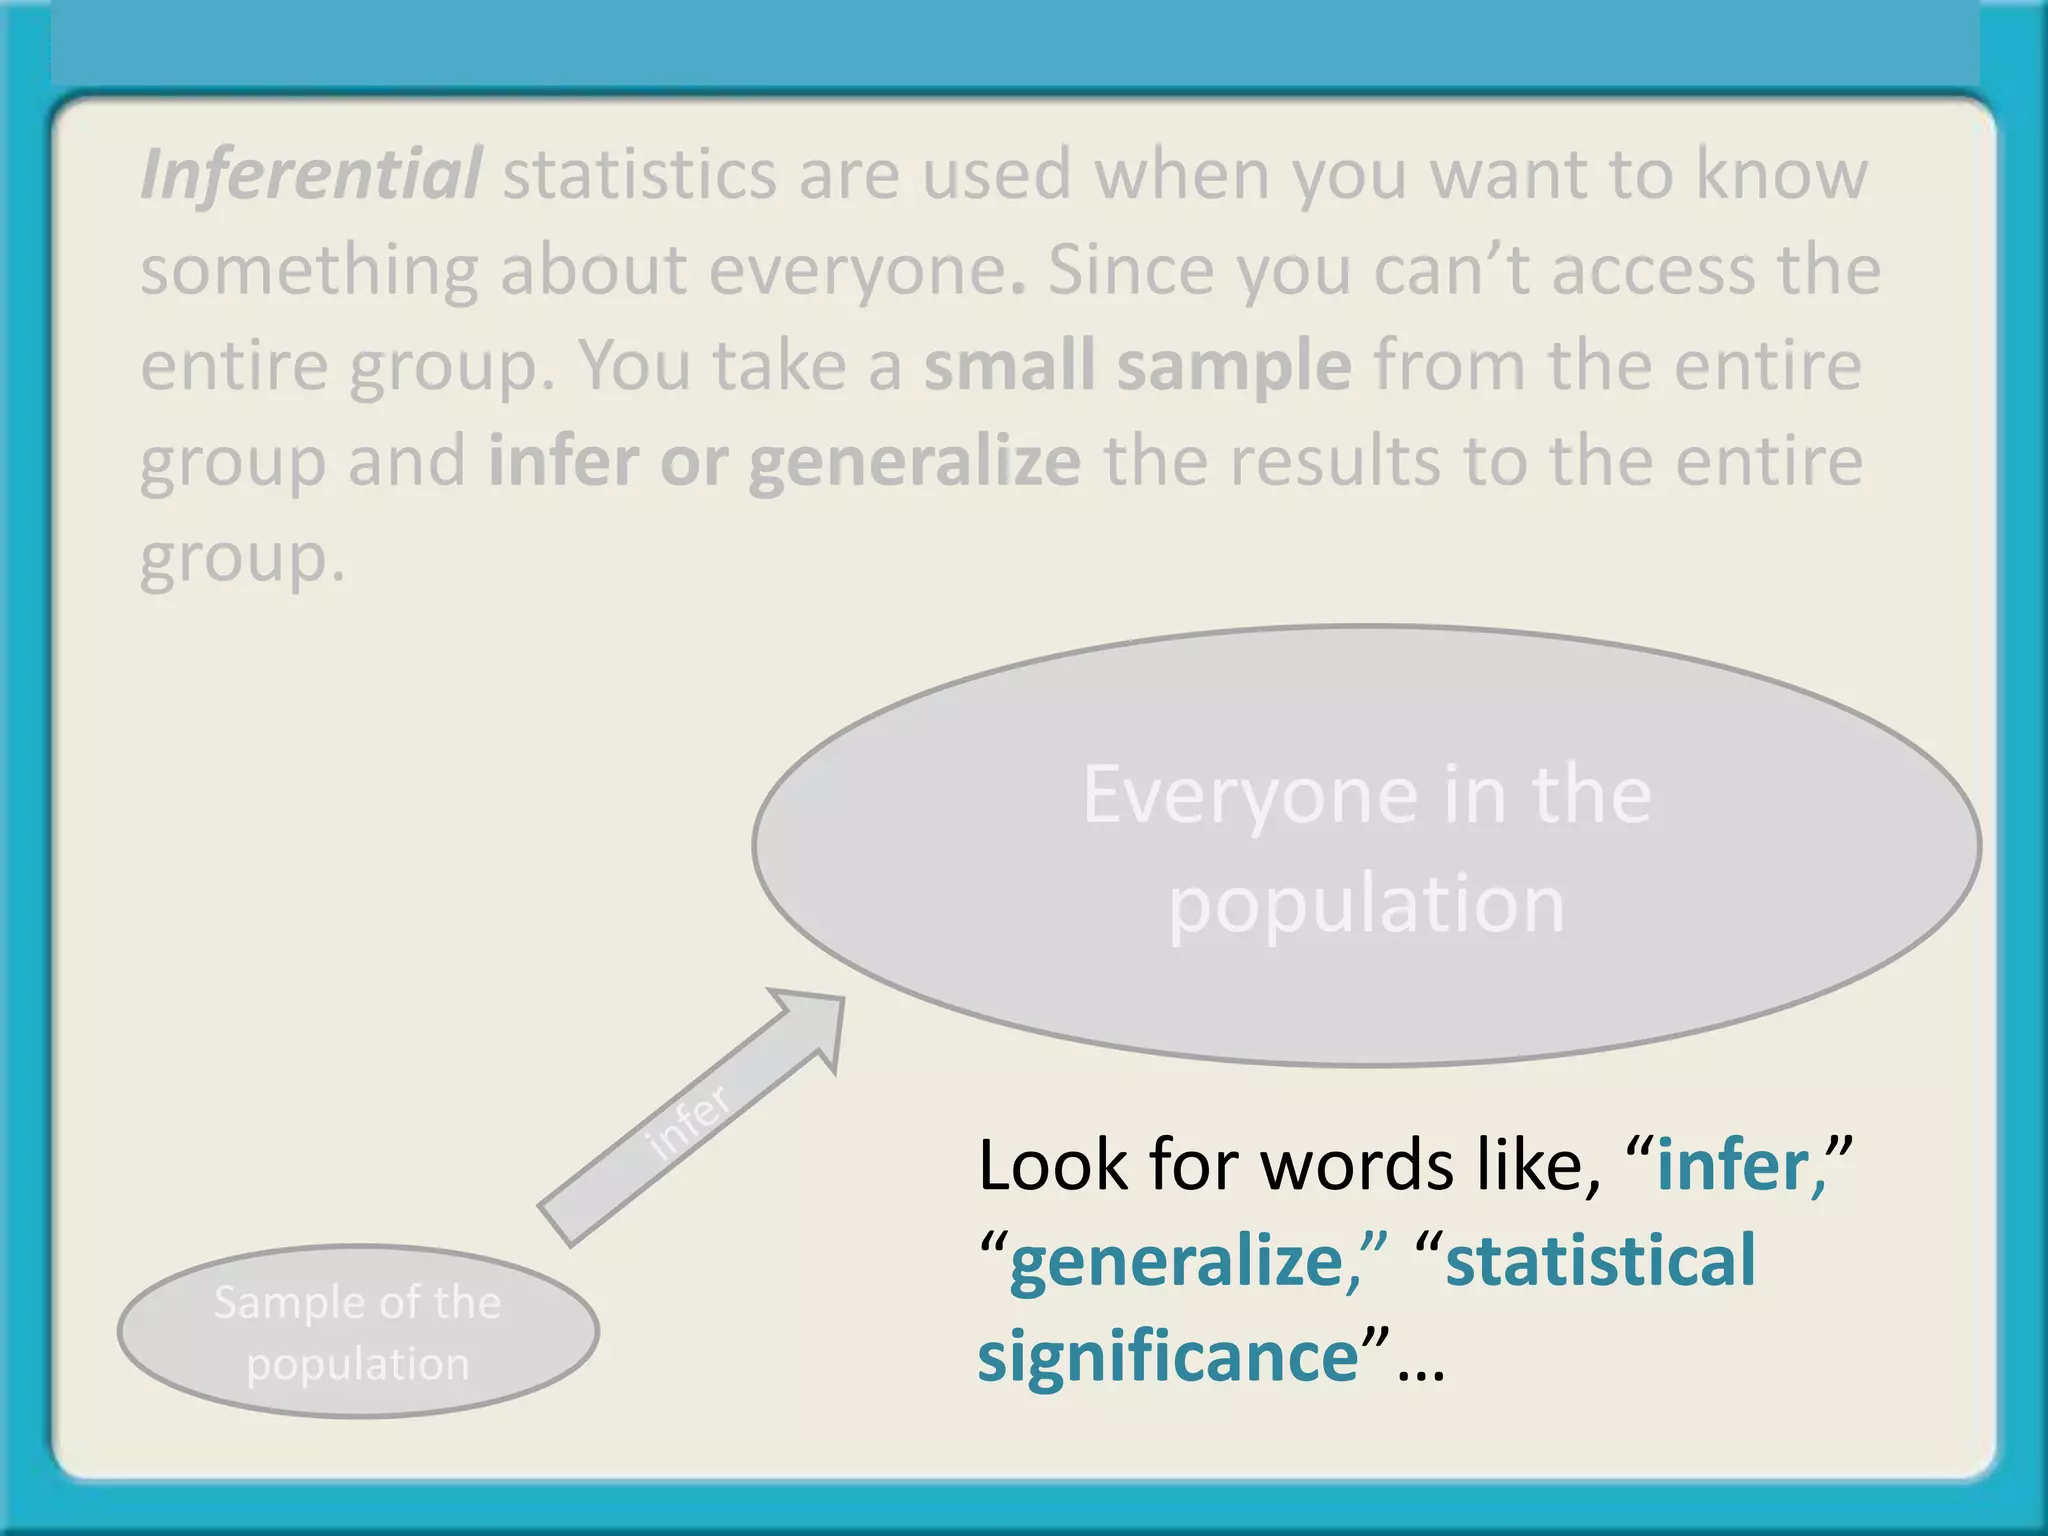


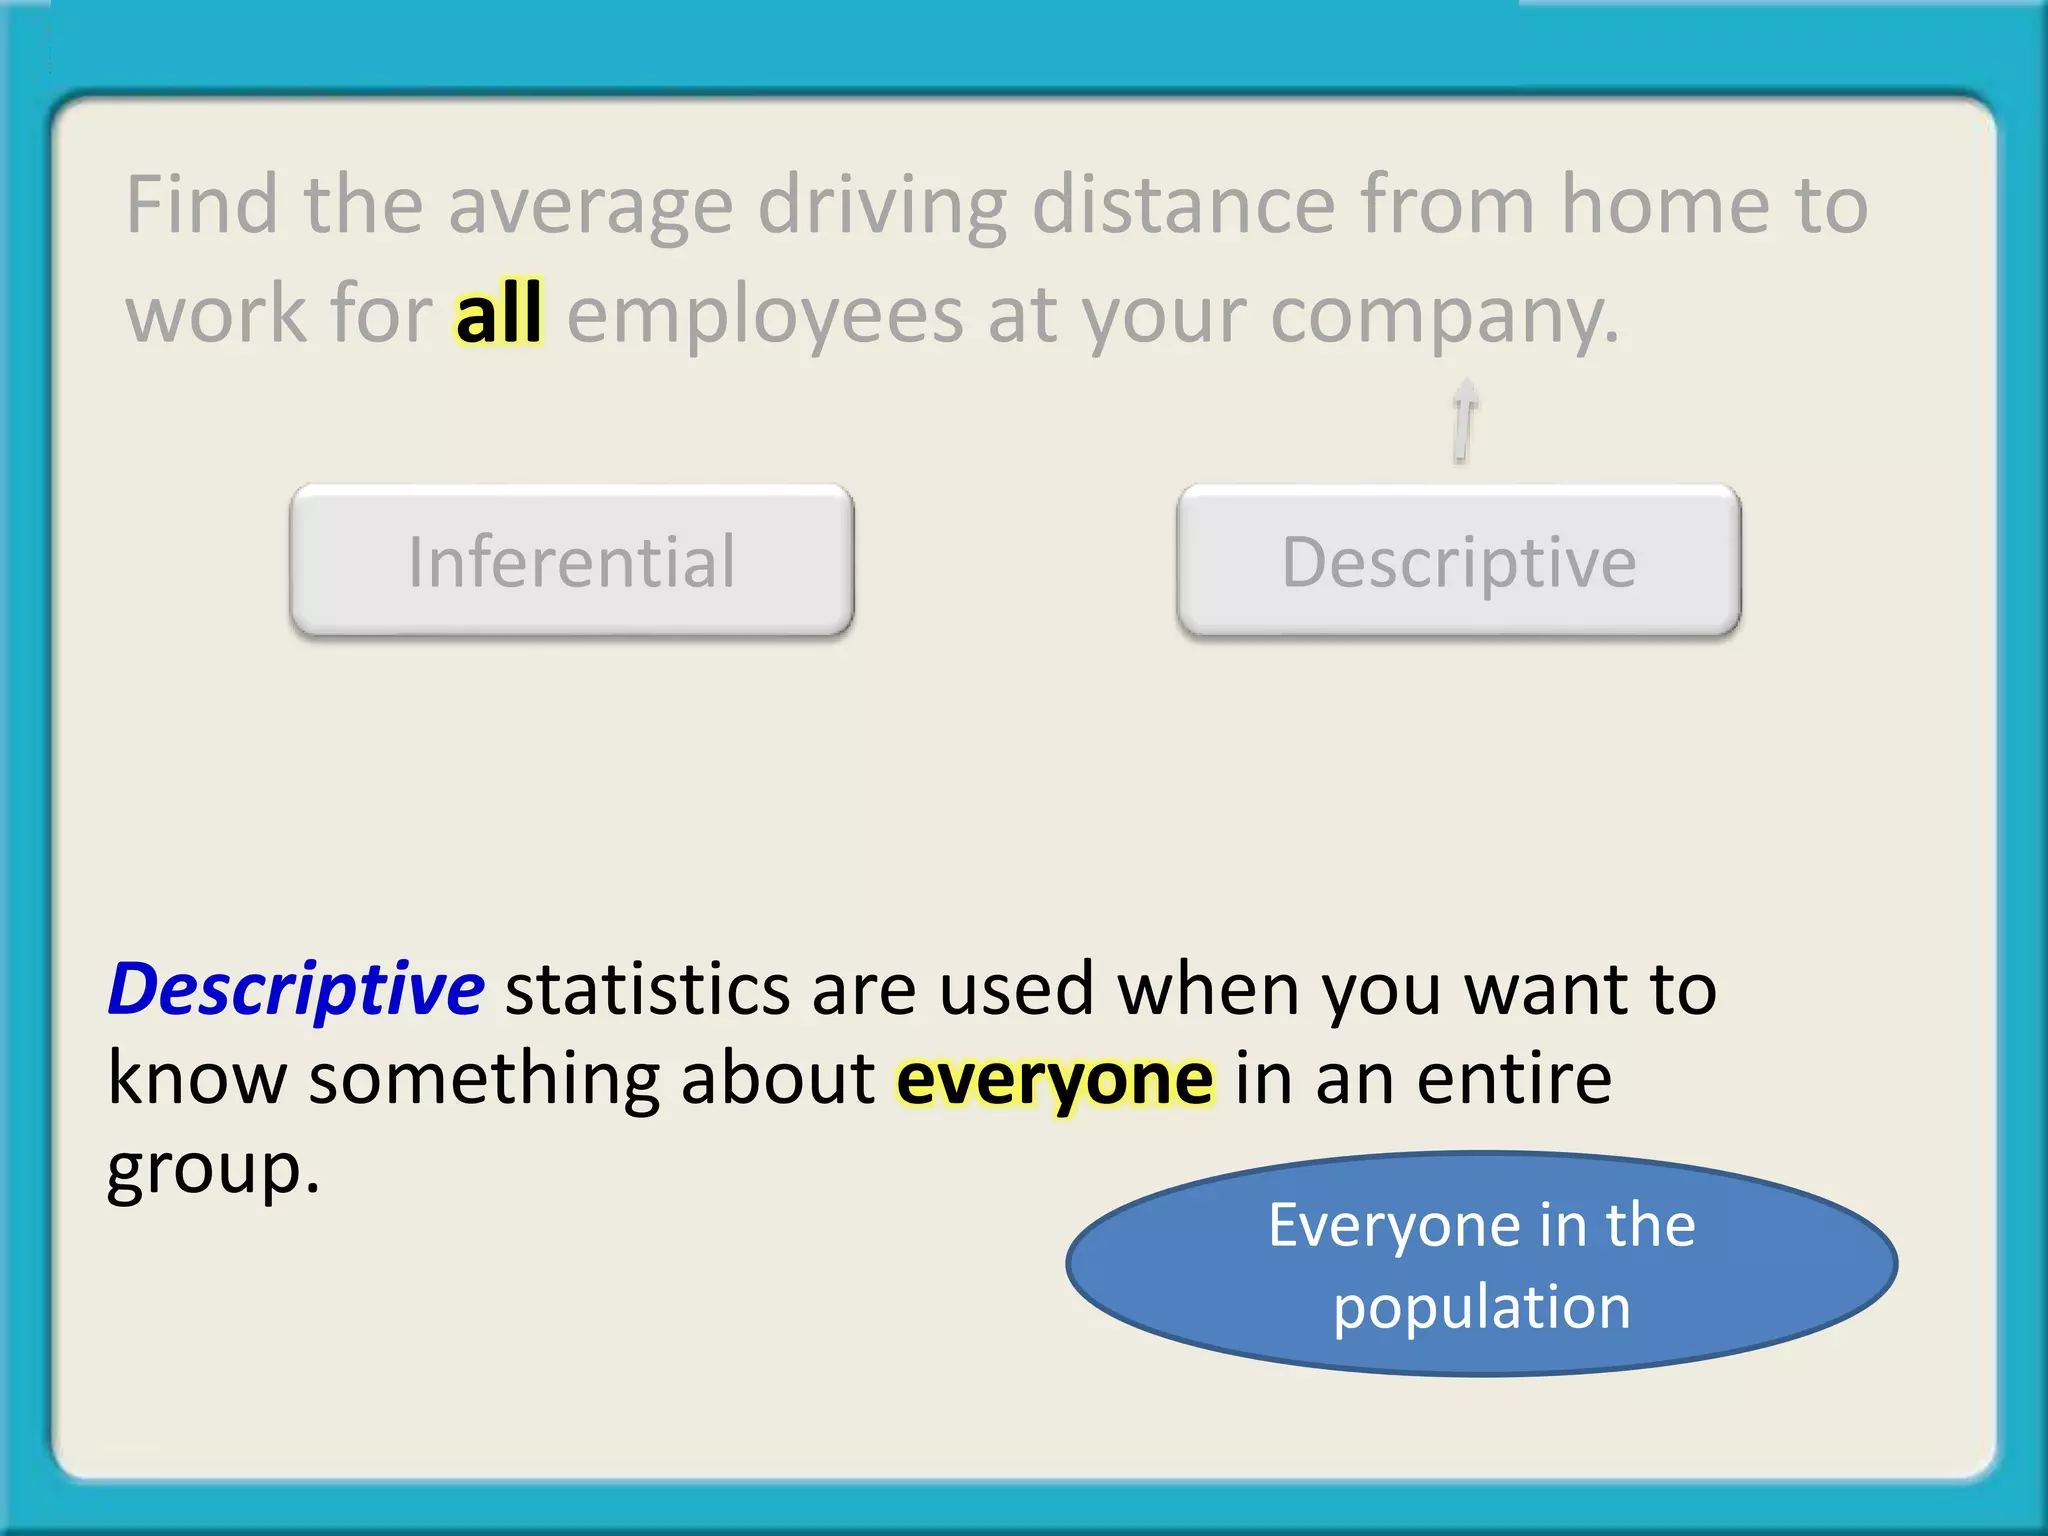


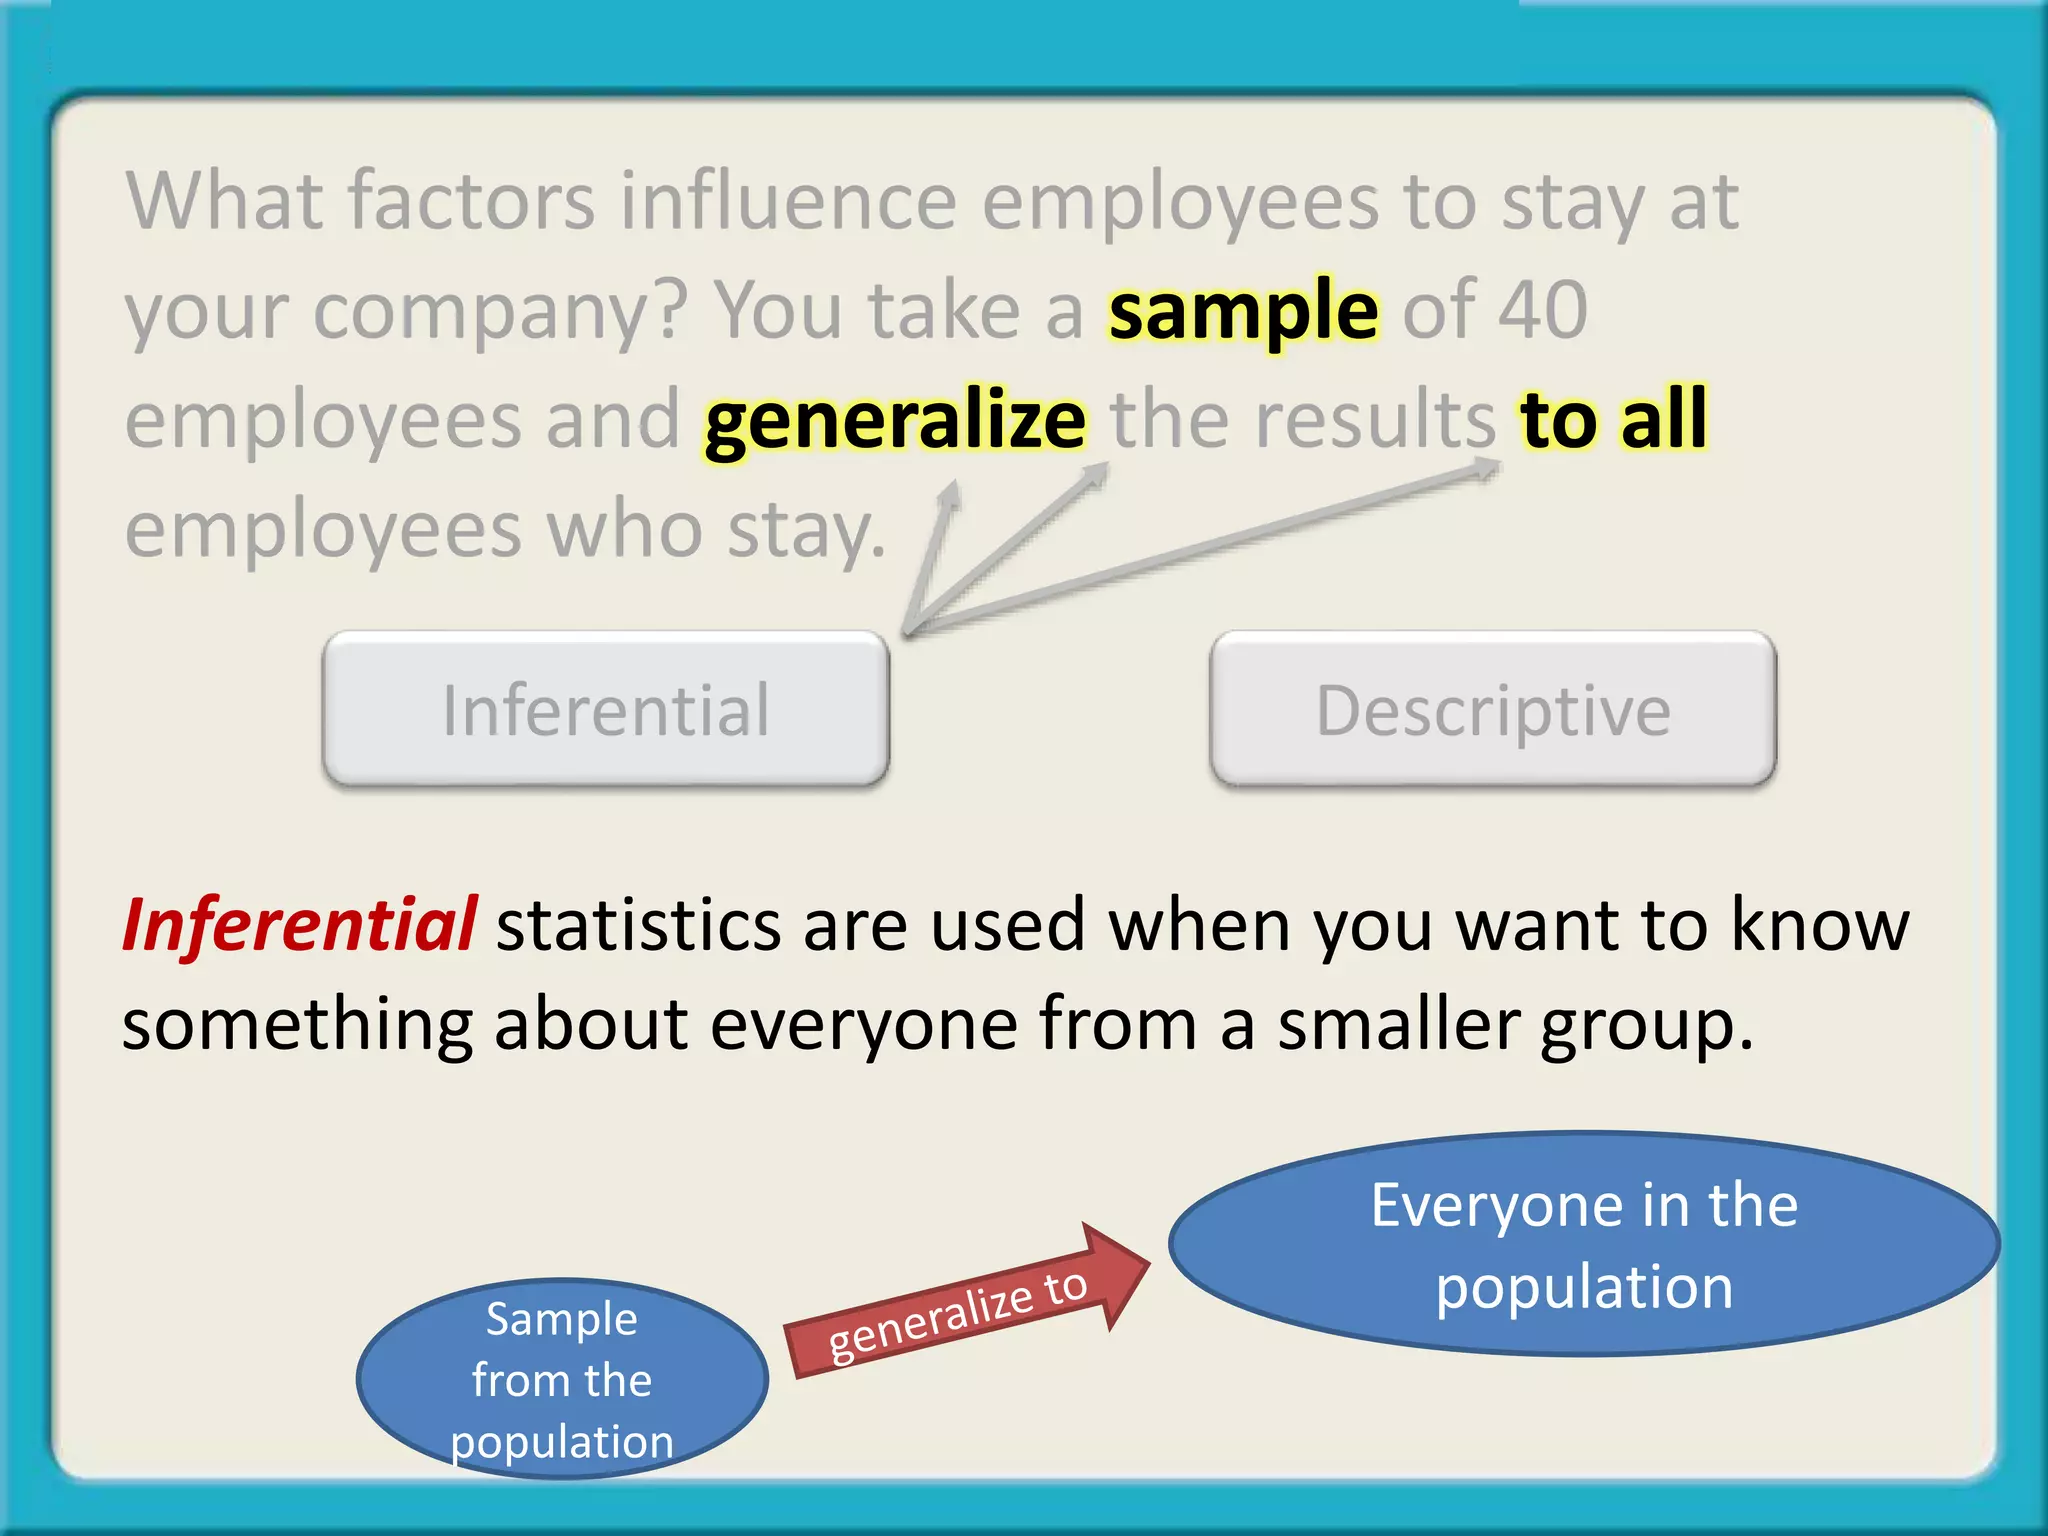

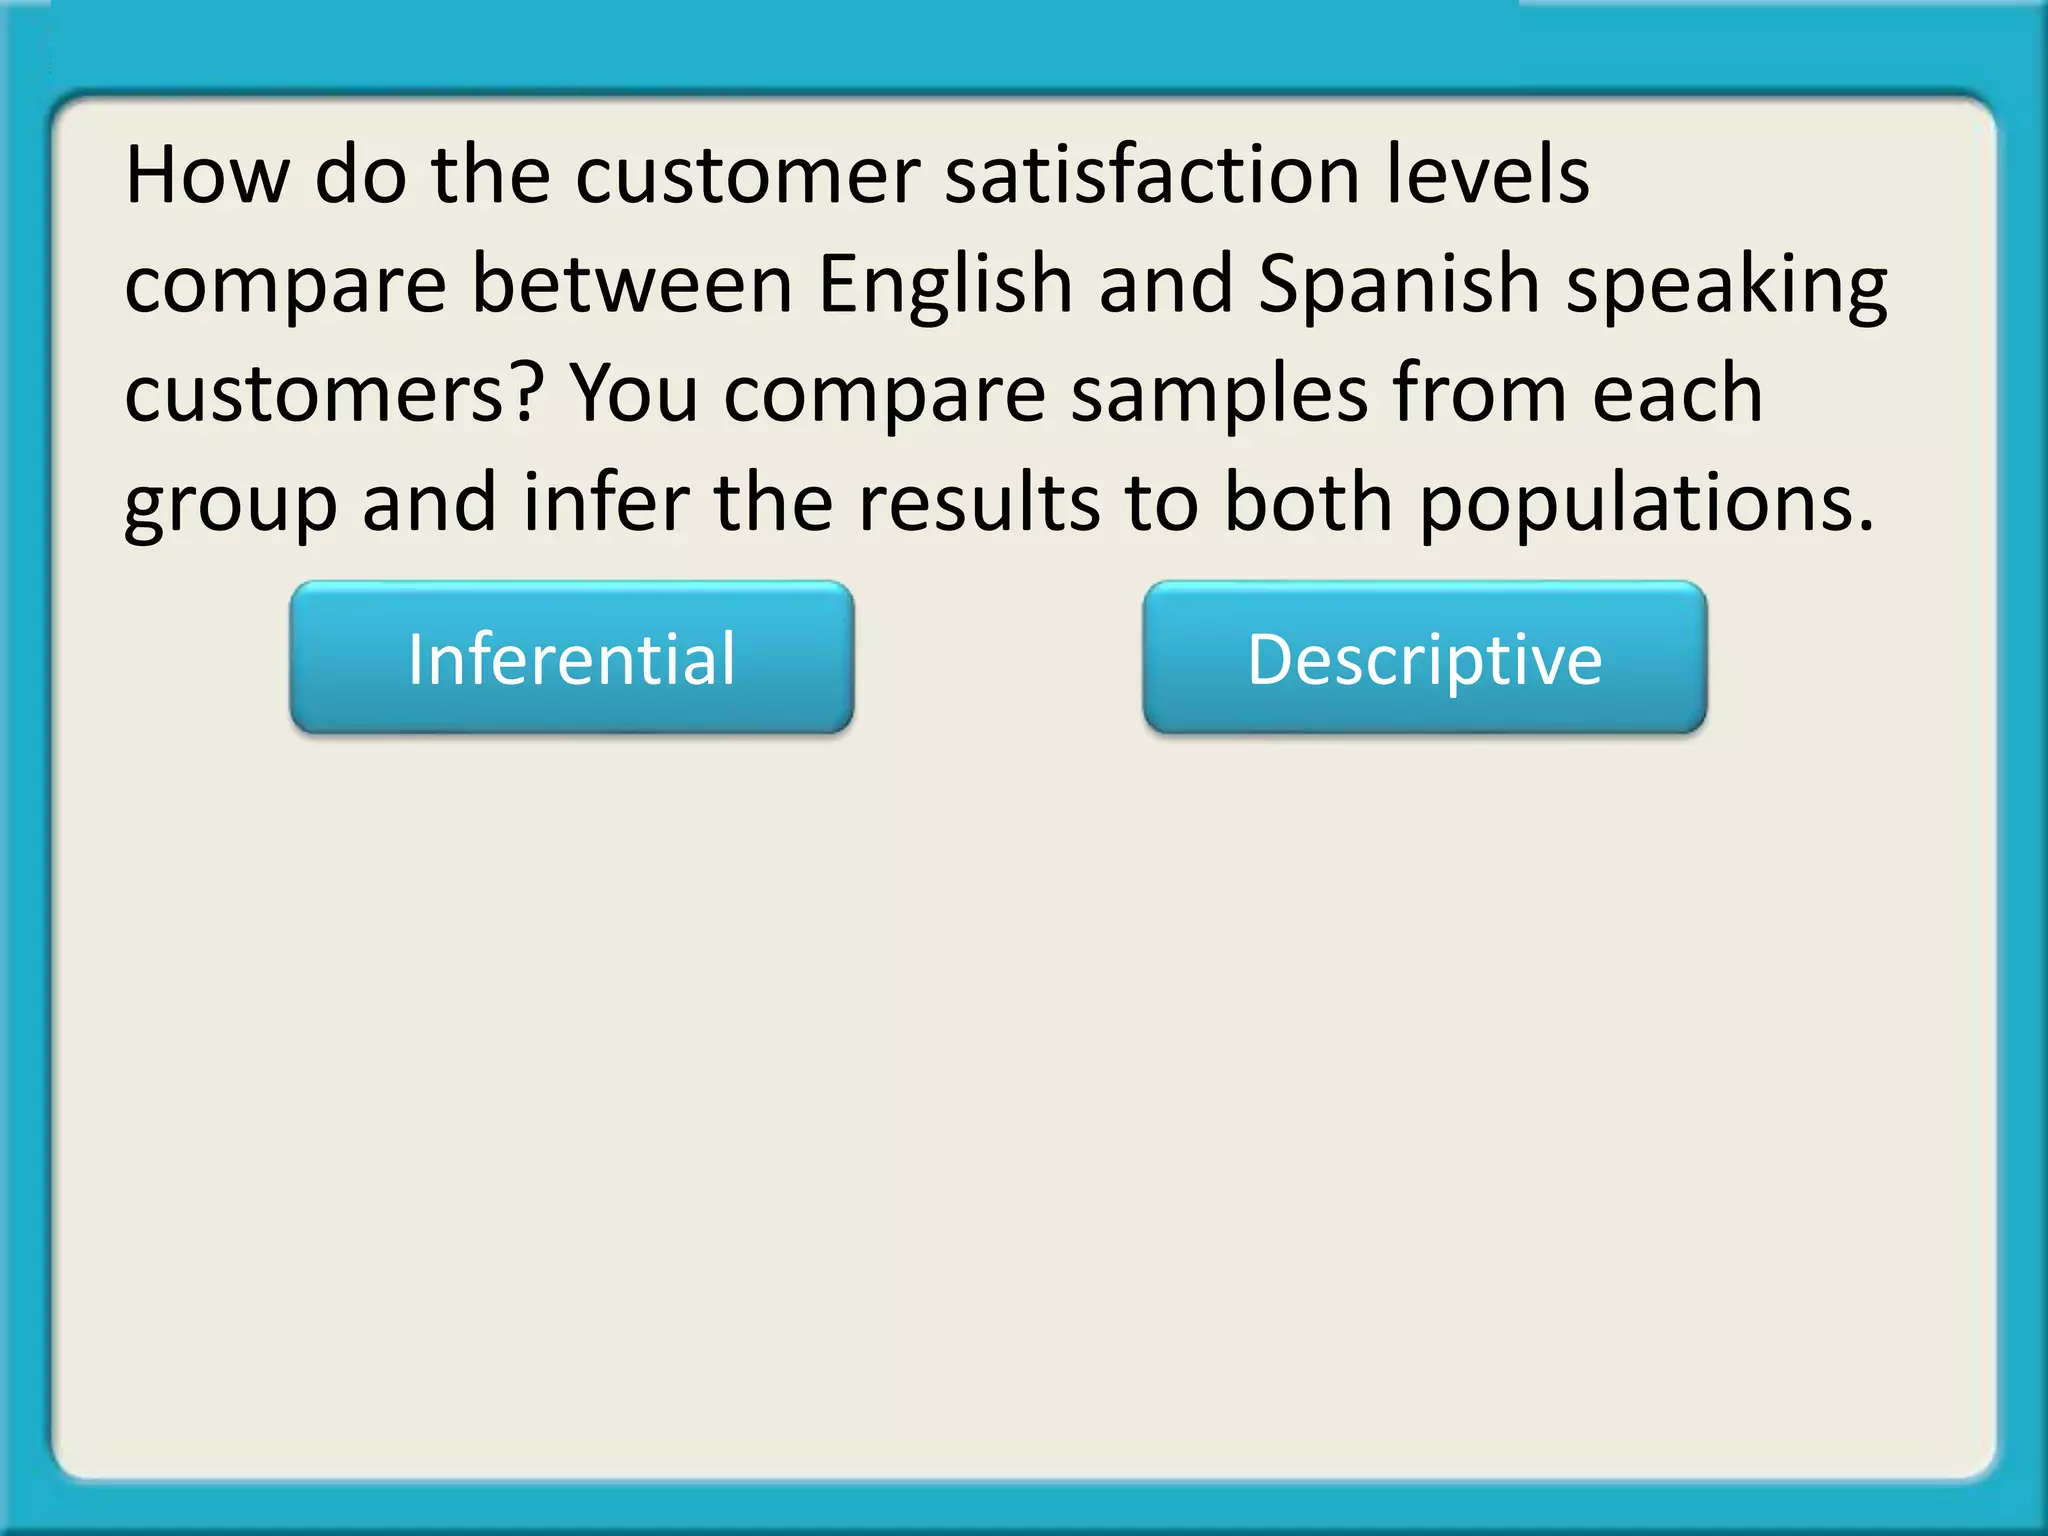
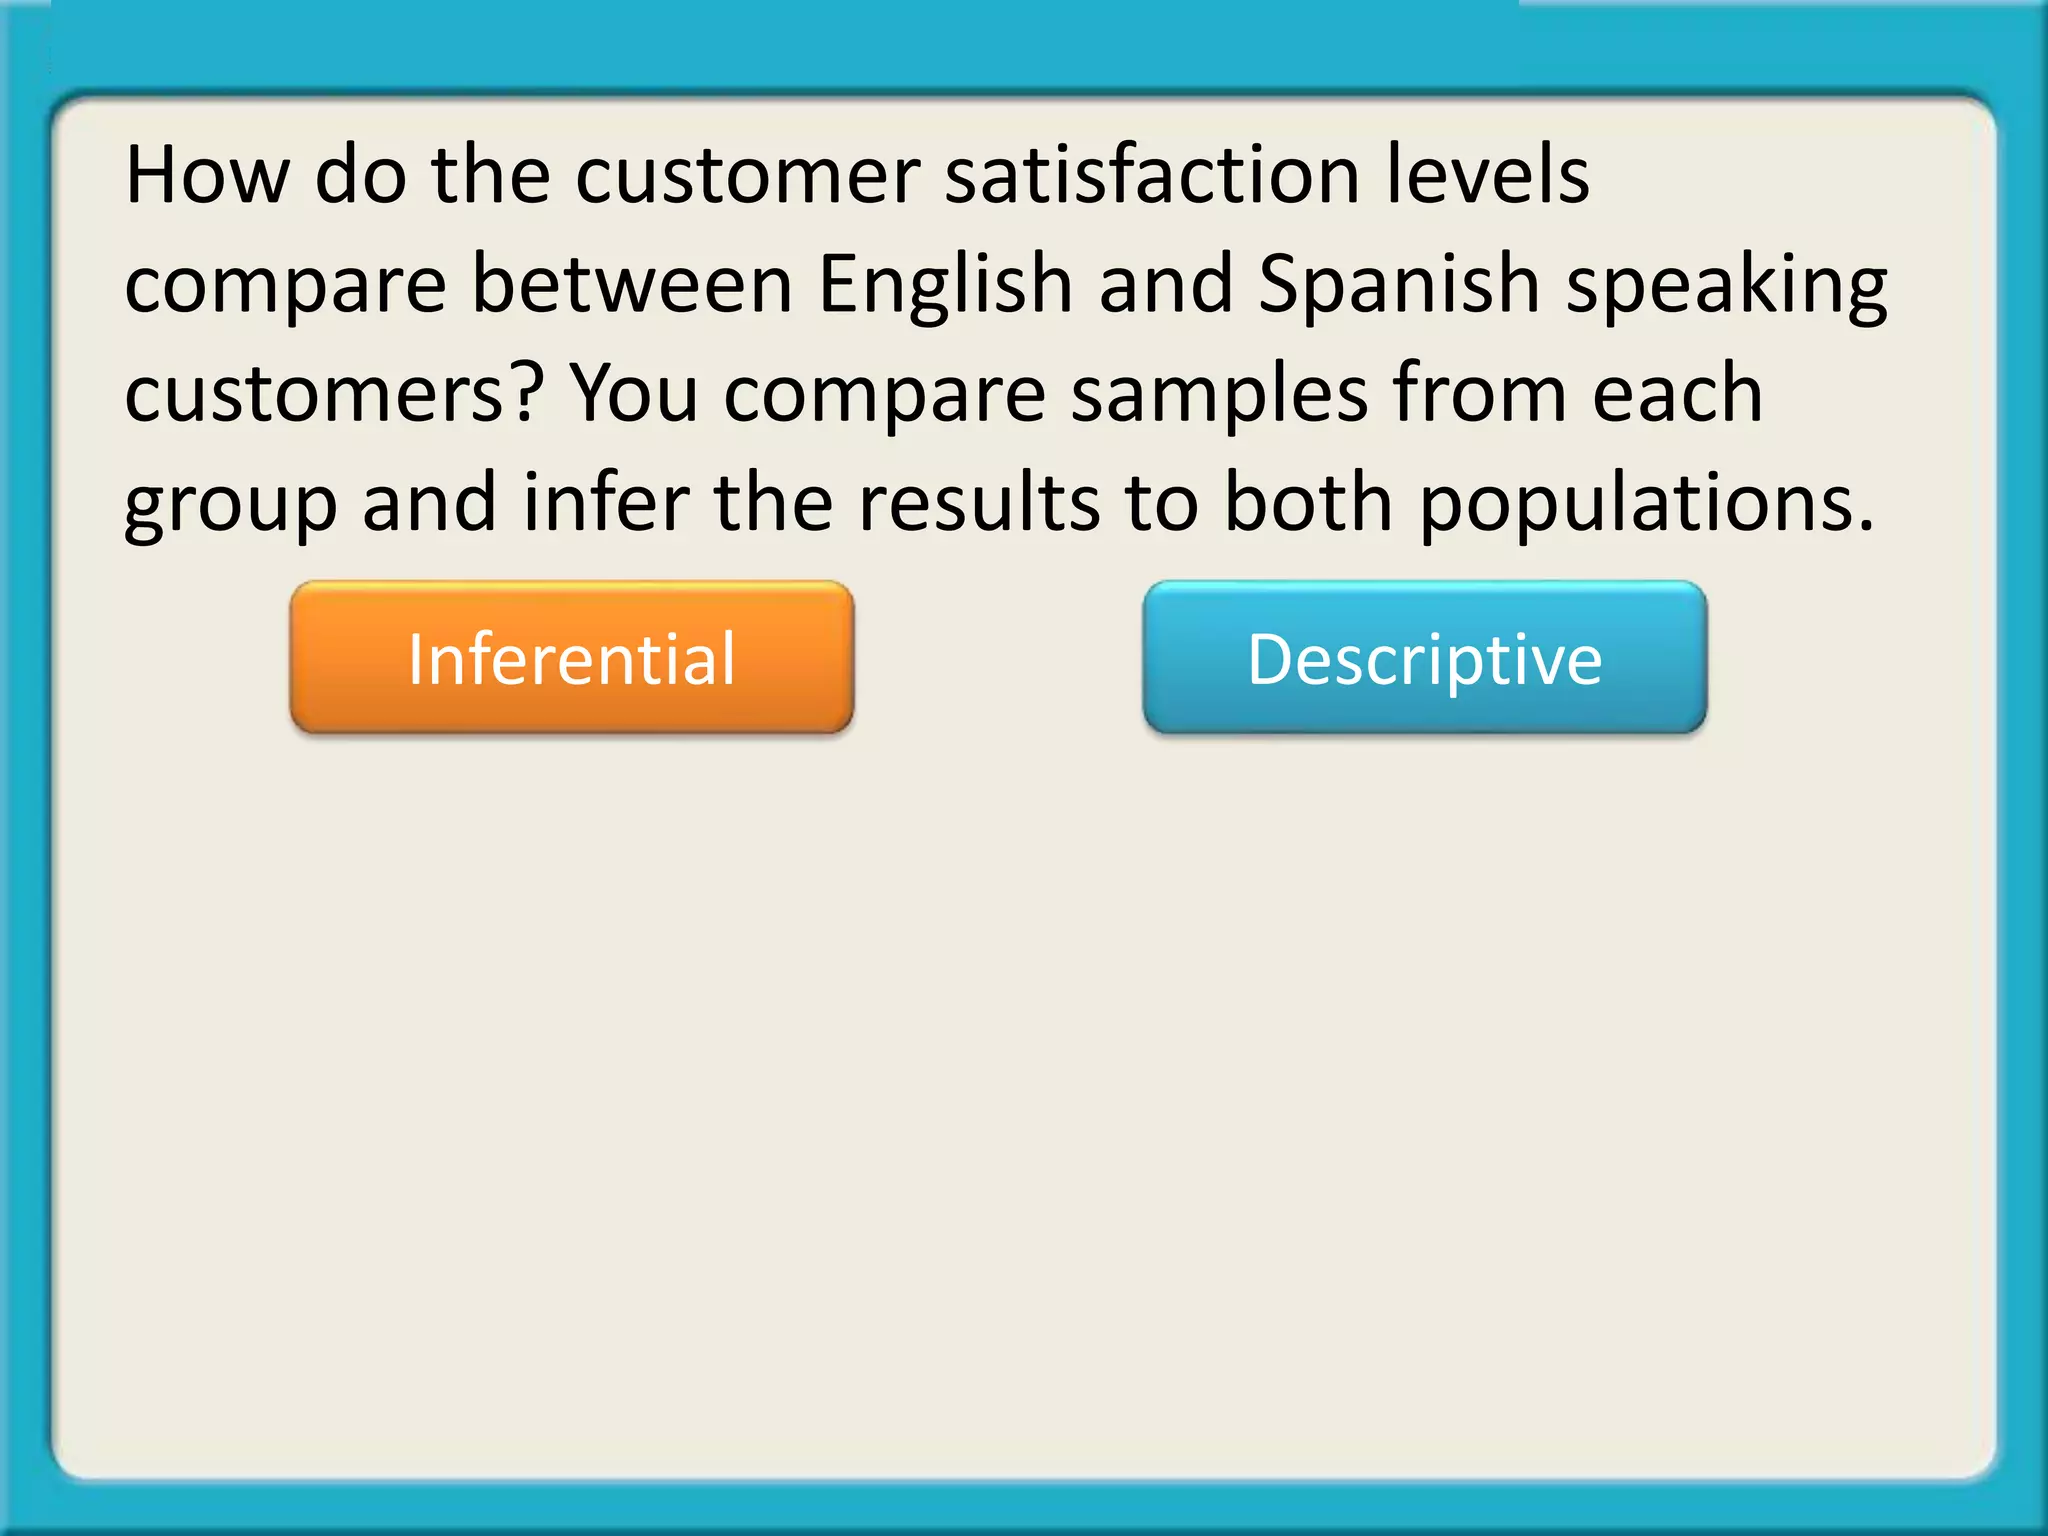
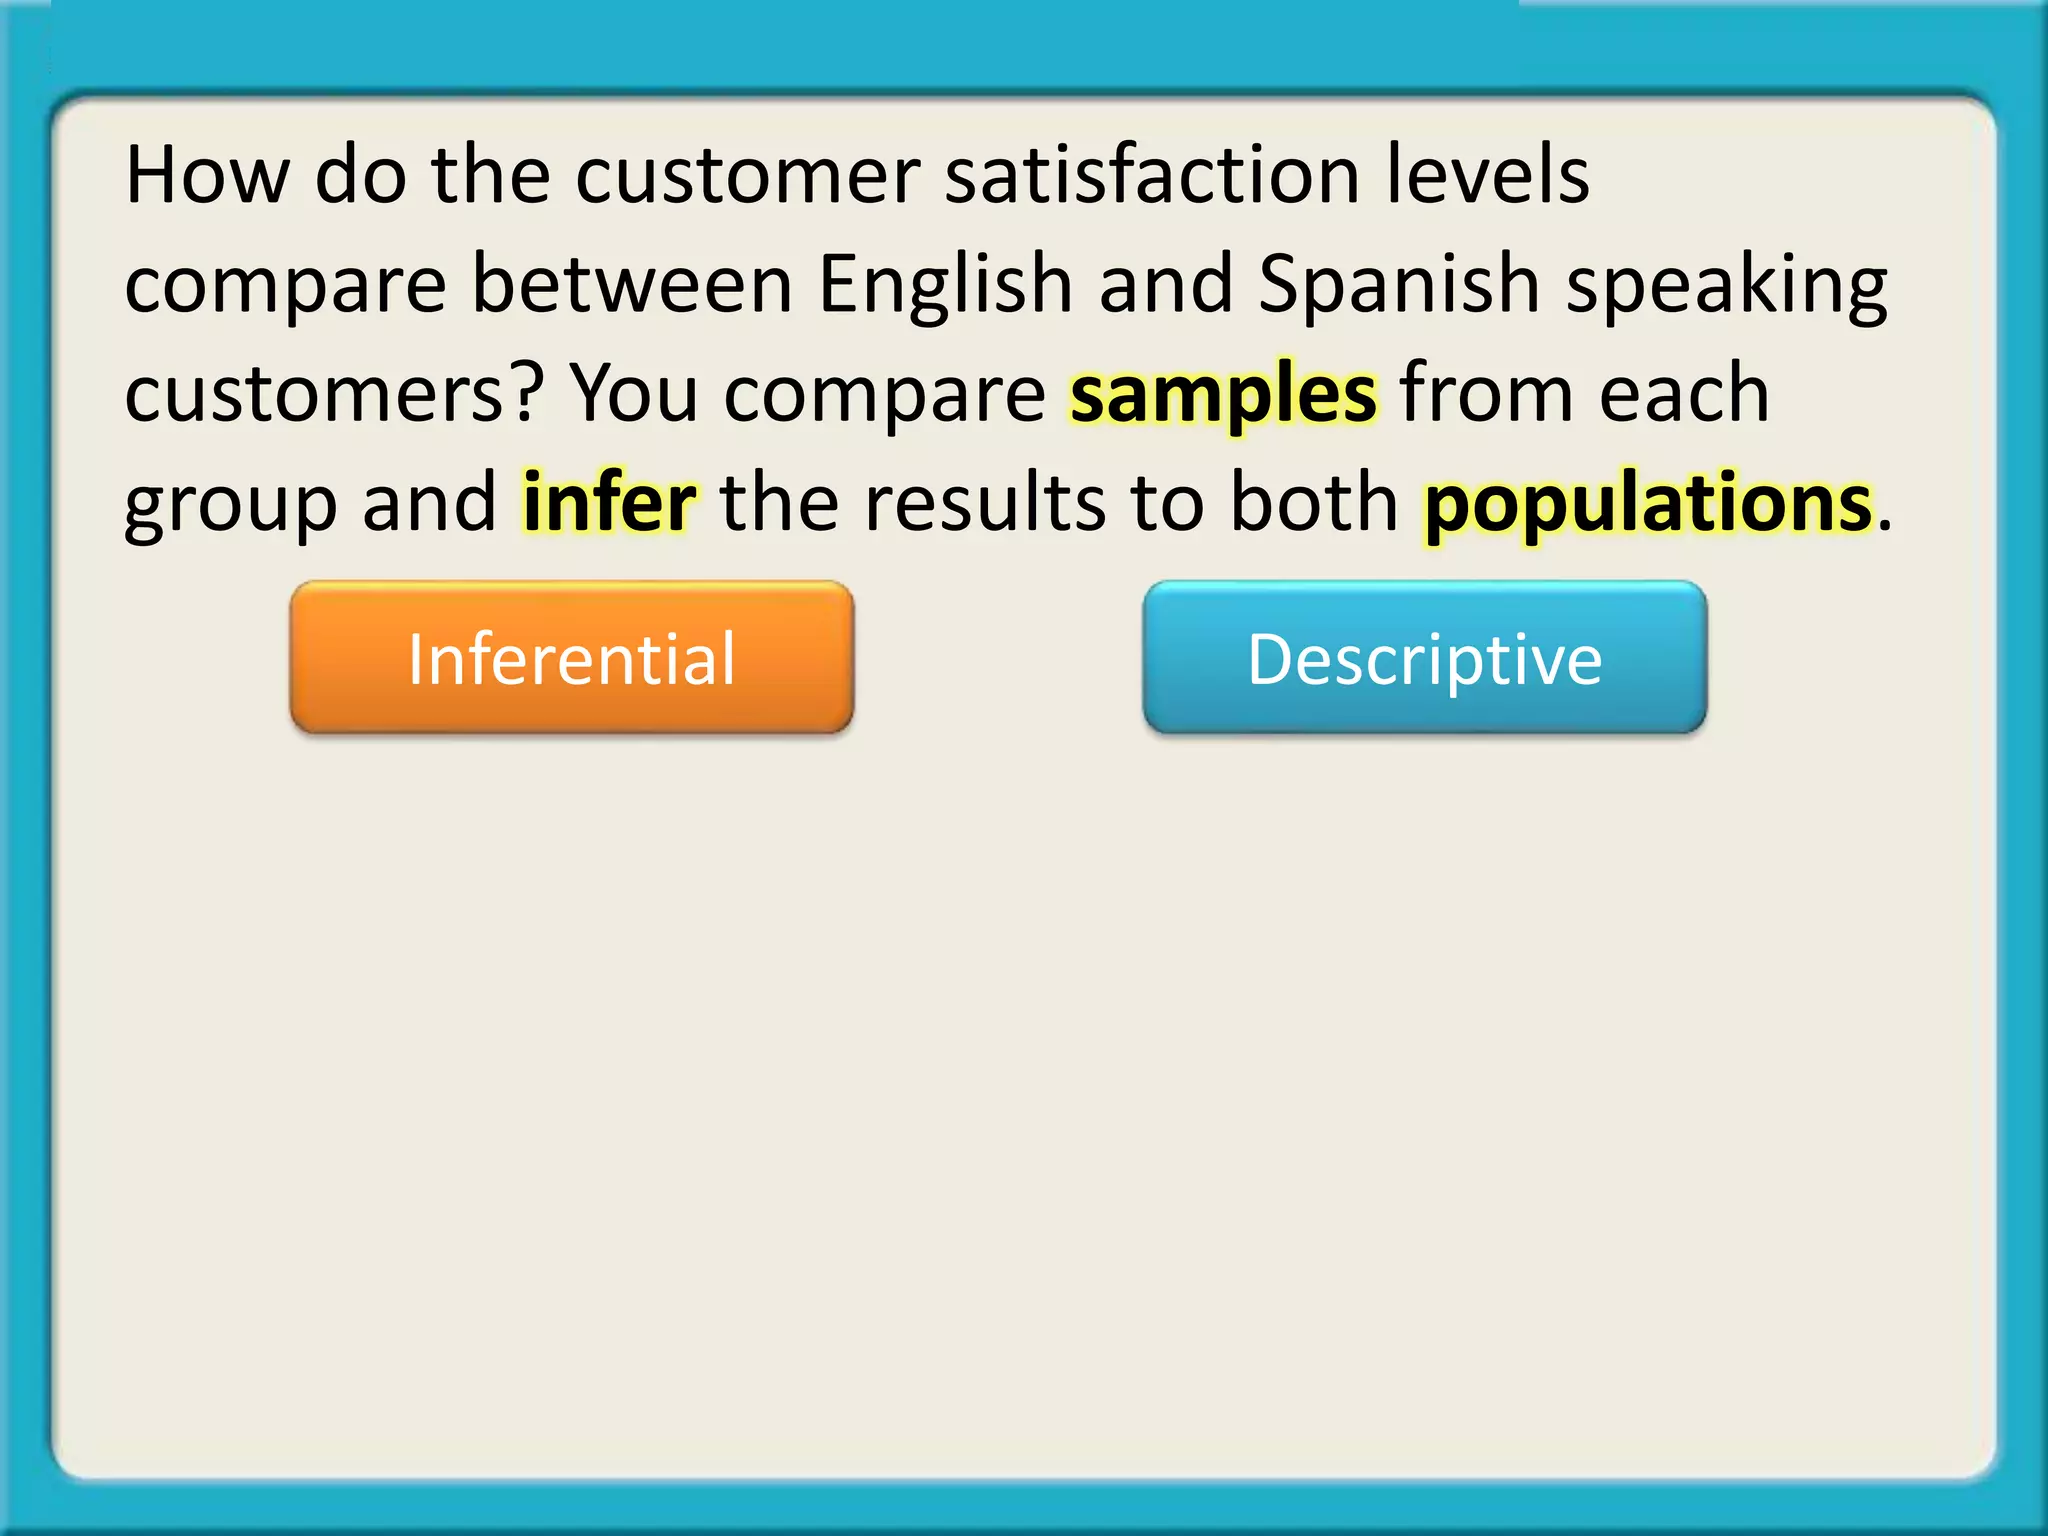
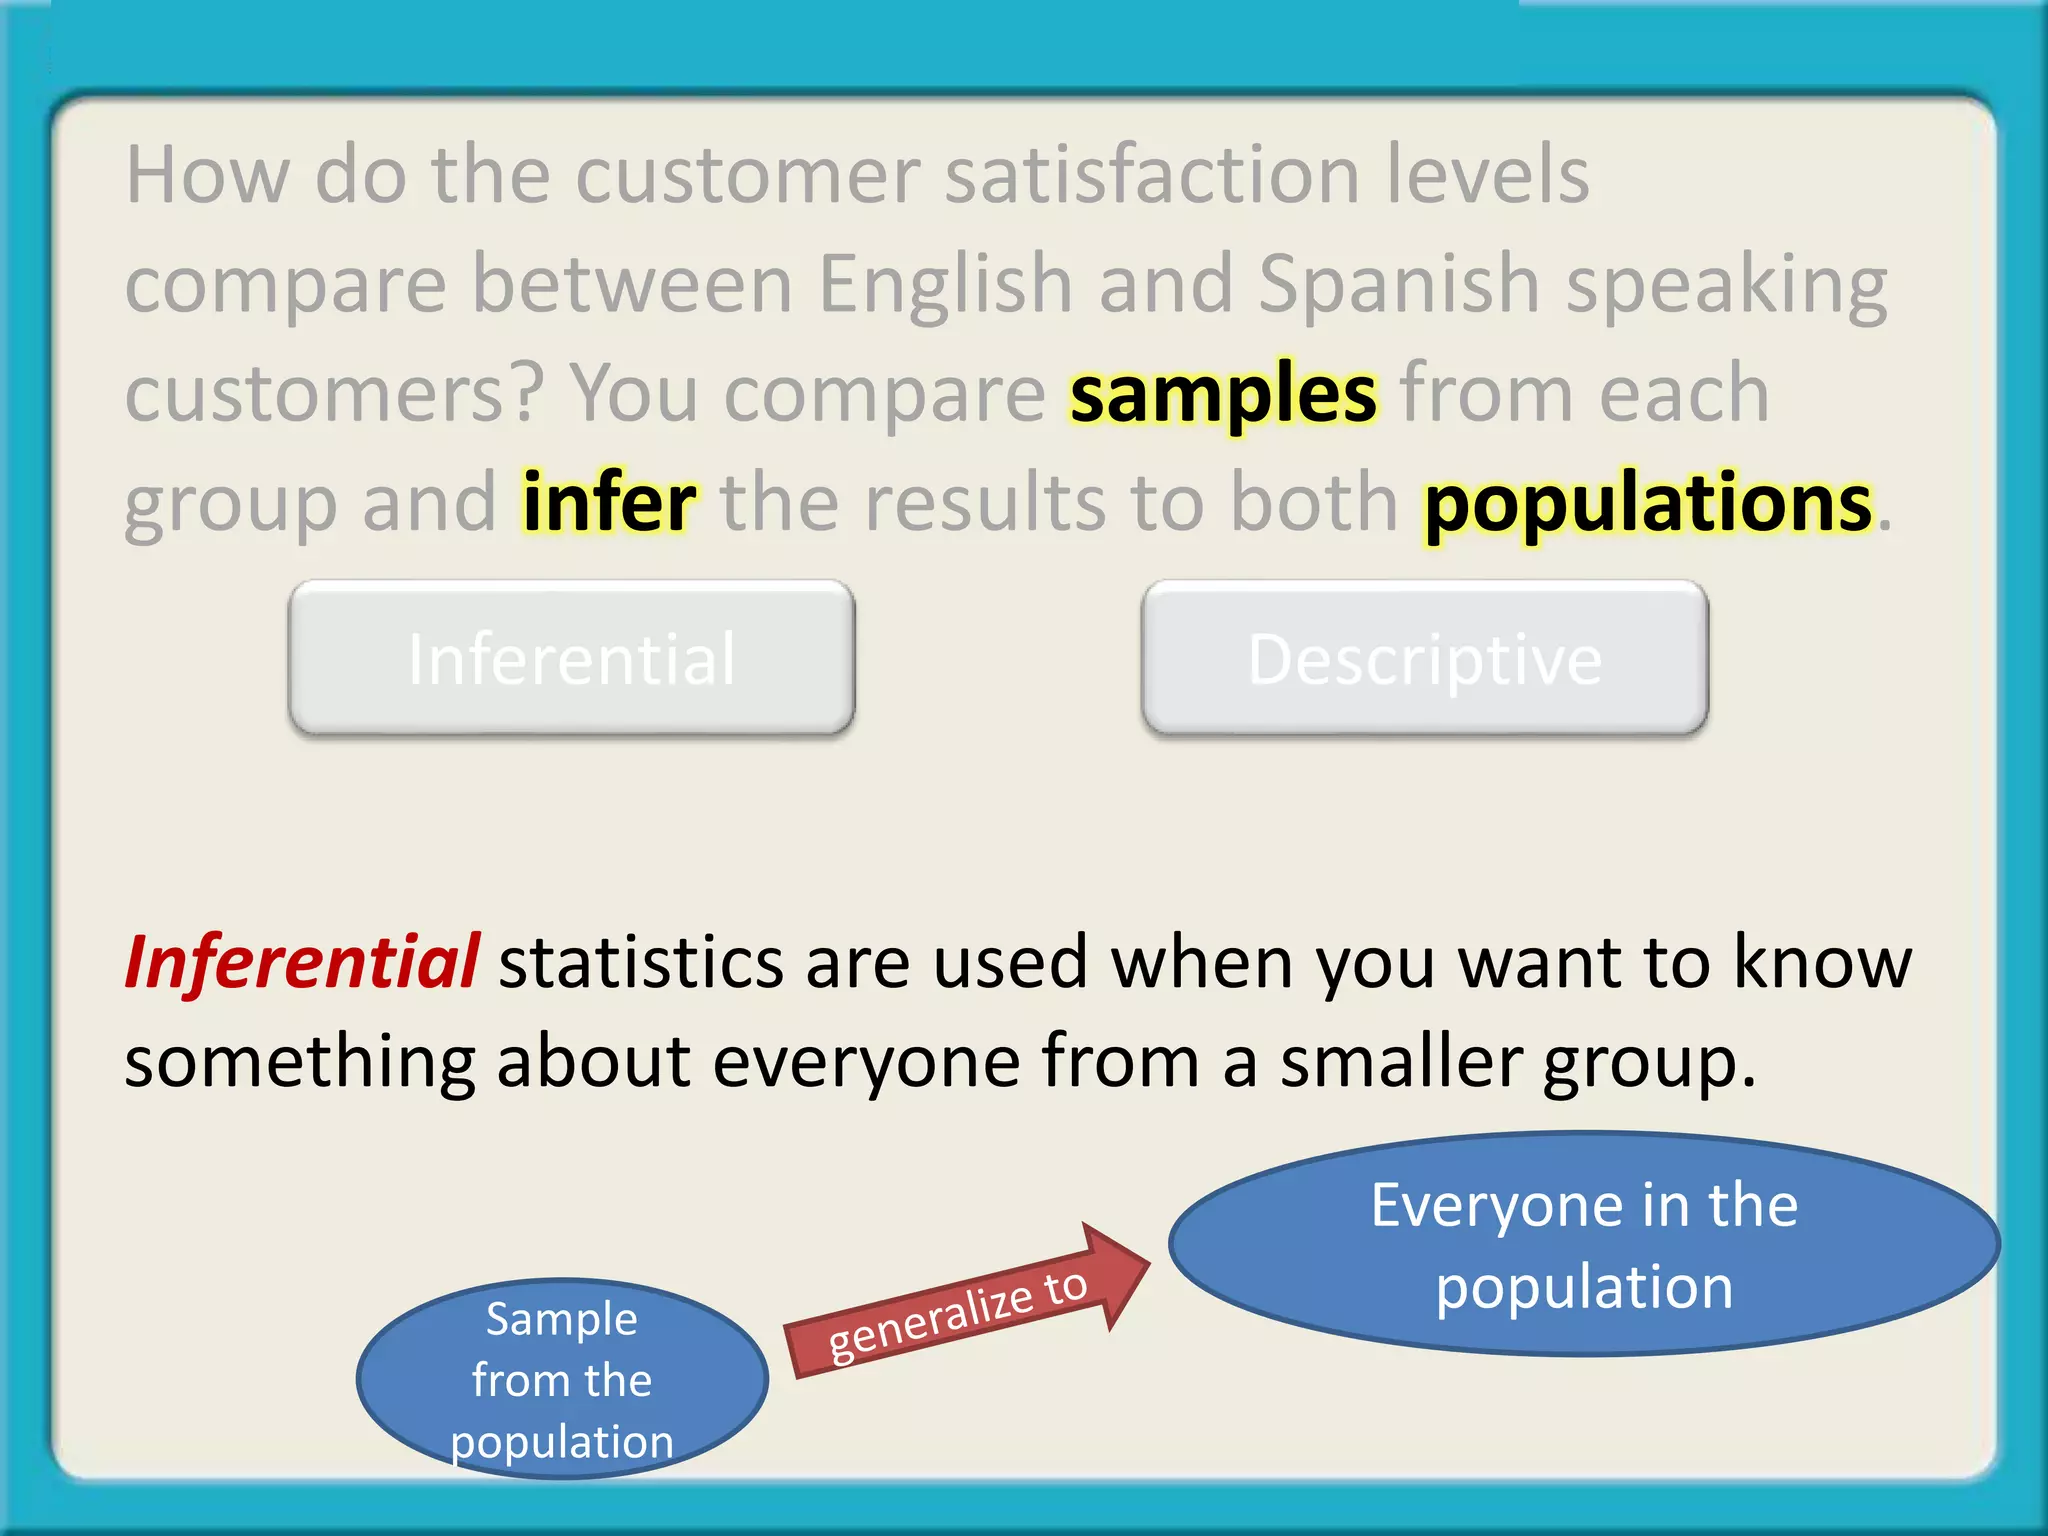


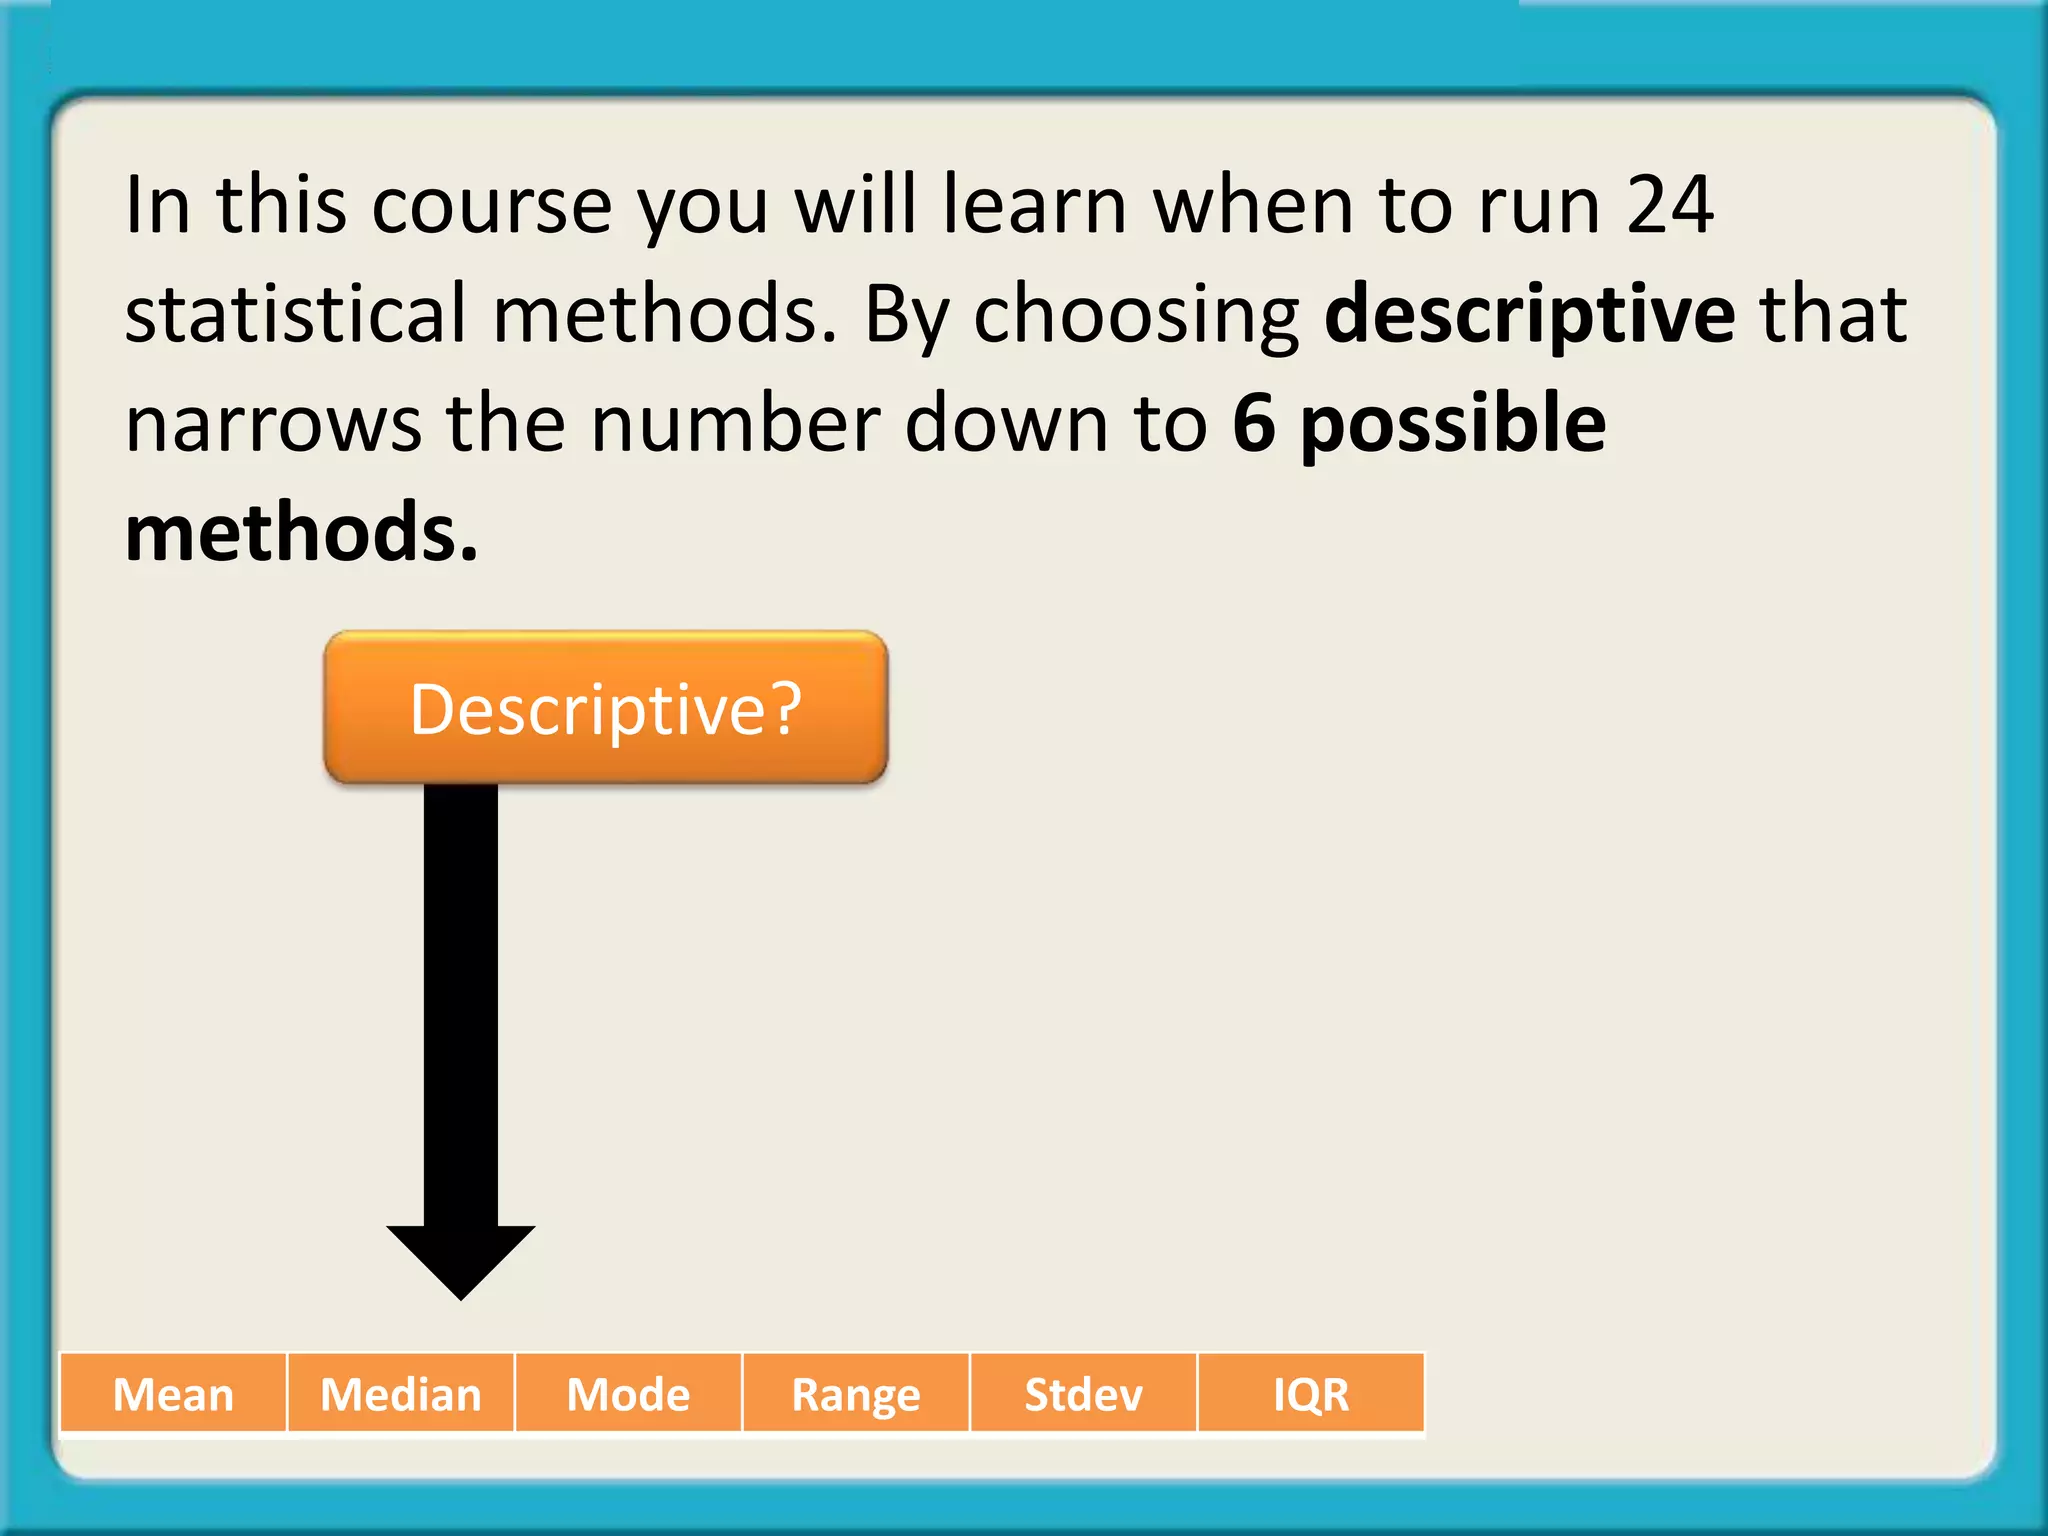

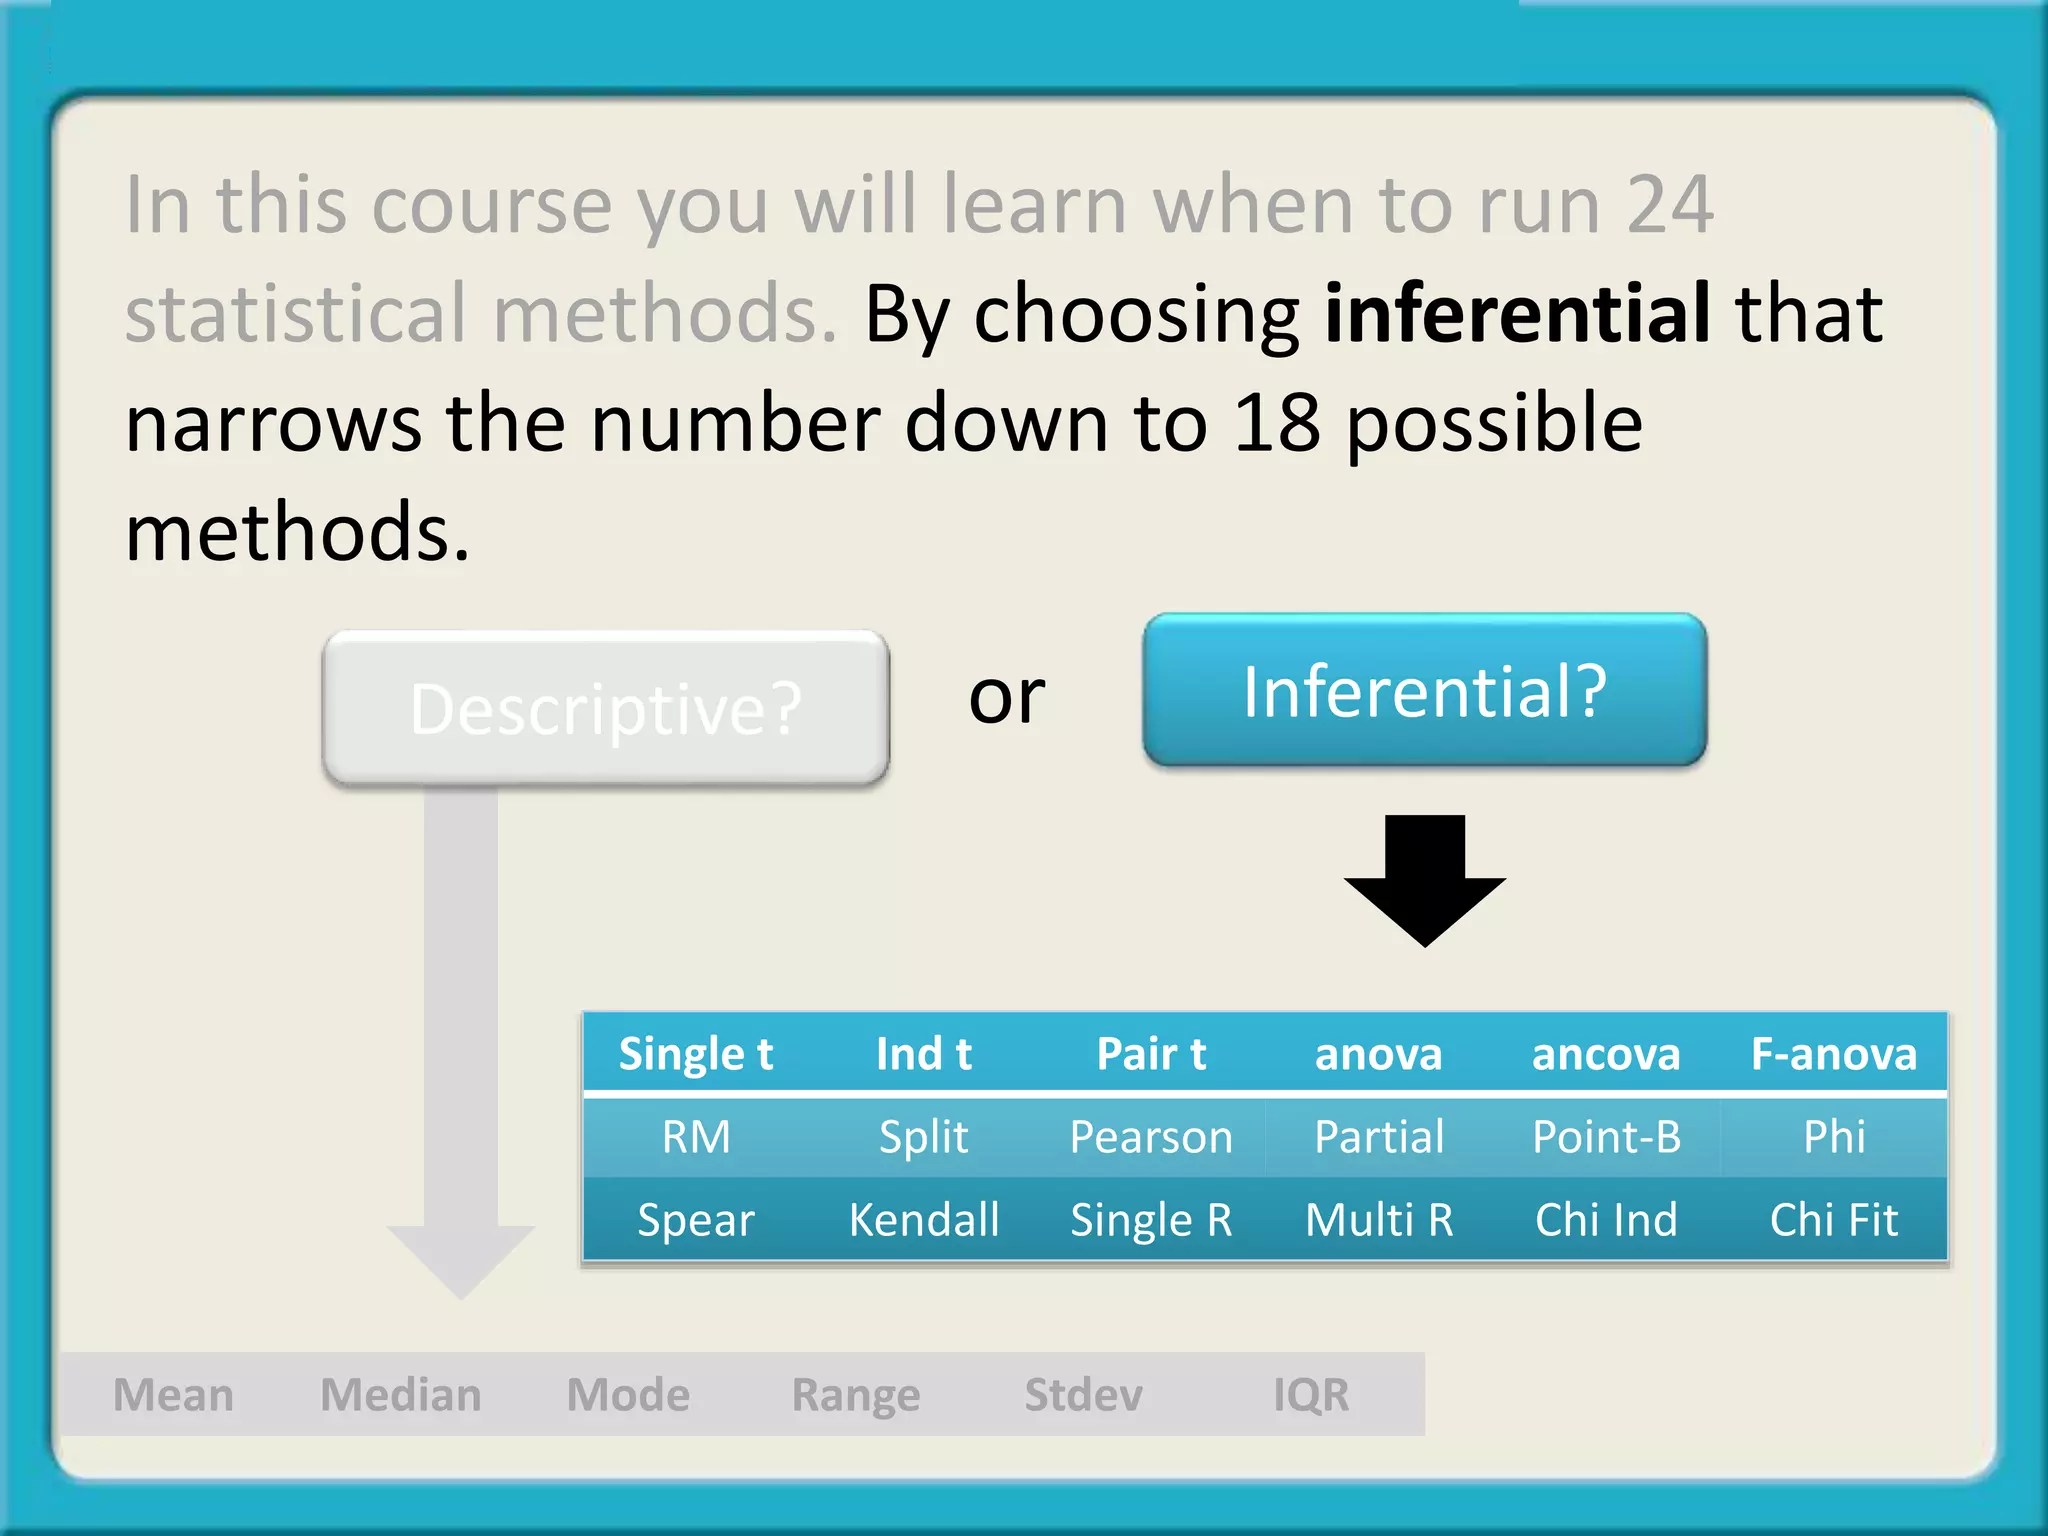

The document discusses the differences between descriptive and inferential statistics. Descriptive statistics are used to describe characteristics of a whole population, while inferential statistics are used when the whole population cannot be measured and conclusions are drawn from a sample to generalize to the larger population. Examples are provided to illustrate when each type of statistic would be used. Key differences include descriptive statistics examining entire populations while inferential statistics examine samples that aim to infer conclusions about populations.