Downloaded 335 times
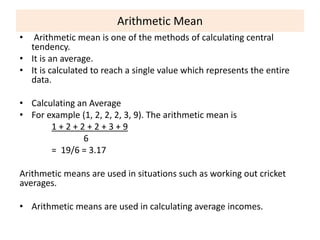
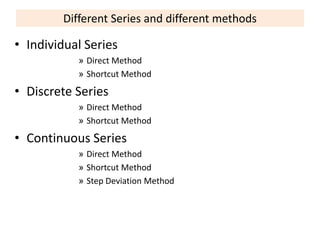
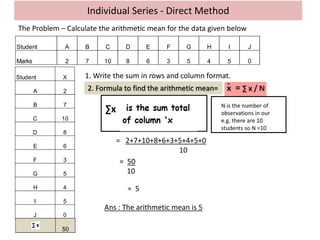
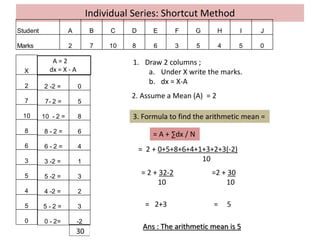
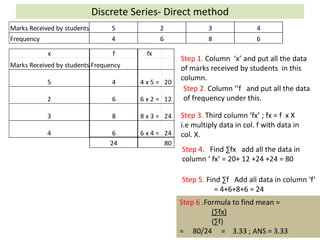
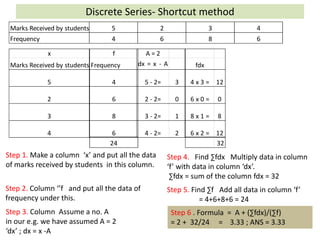
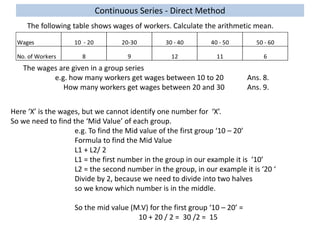
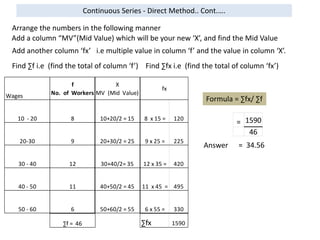
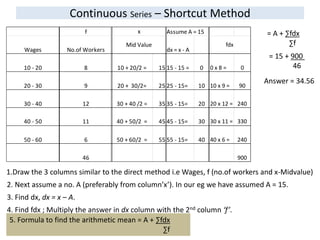
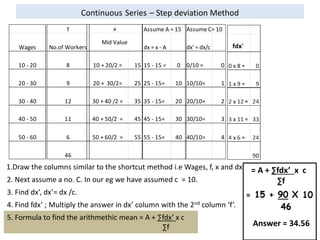
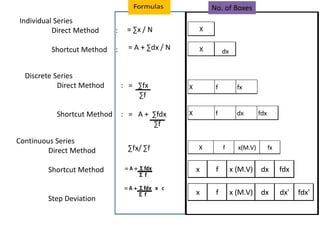

The document discusses different methods to calculate arithmetic mean from various types of data series. It explains the direct and shortcut methods to find the arithmetic mean for individual, discrete and continuous data series. For individual series, the direct method sums all data points and divides by the total number of data points. The shortcut method assumes a mean, calculates the differences from the assumed mean, and finds the mean as the assumed mean plus the sum of the differences divided by the total number of data points.