Downloaded 1,212 times

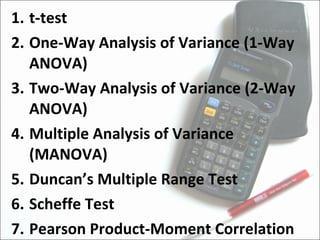


This document discusses various statistical techniques used for inferential statistics, including parametric and non-parametric techniques. Parametric techniques make assumptions about the population and can determine relationships, while non-parametric techniques make few assumptions and are useful for nominal and ordinal data. Commonly used parametric tests are t-tests, ANOVA, MANOVA, and correlation analysis. Non-parametric tests mentioned include Chi-square, Wilcoxon, and Friedman tests. Examples are provided to illustrate the appropriate uses of each technique.


