Downloaded 2,509 times


![Direct method
N .∑ XY − ∑ X .∑ Y
r=
[ N ∑ X − ( ∑ X ) ]. [ N.∑ Y − ( ∑ Y ) ]
2 2 2 2
08/01/12 anilmishra5555@rediffmail.com 17](https://image.slidesharecdn.com/correlationanalysisppt-120801035650-phpapp02/85/Correlation-analysis-ppt-17-320.jpg)


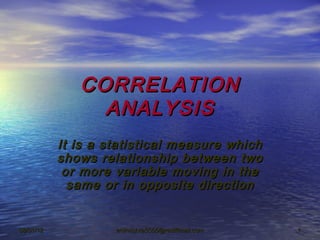
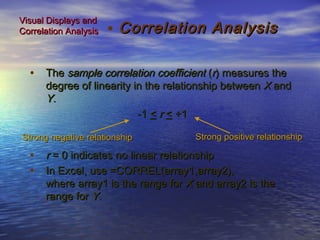
Correlation analysis measures the relationship between two or more variables. The sample correlation coefficient r ranges from -1 to 1, indicating the degree of linear relationship between variables. A value of 0 indicates no linear relationship, while values closer to 1 or -1 indicate a strong positive or negative linear relationship. Excel can be used to calculate r using the CORREL function.