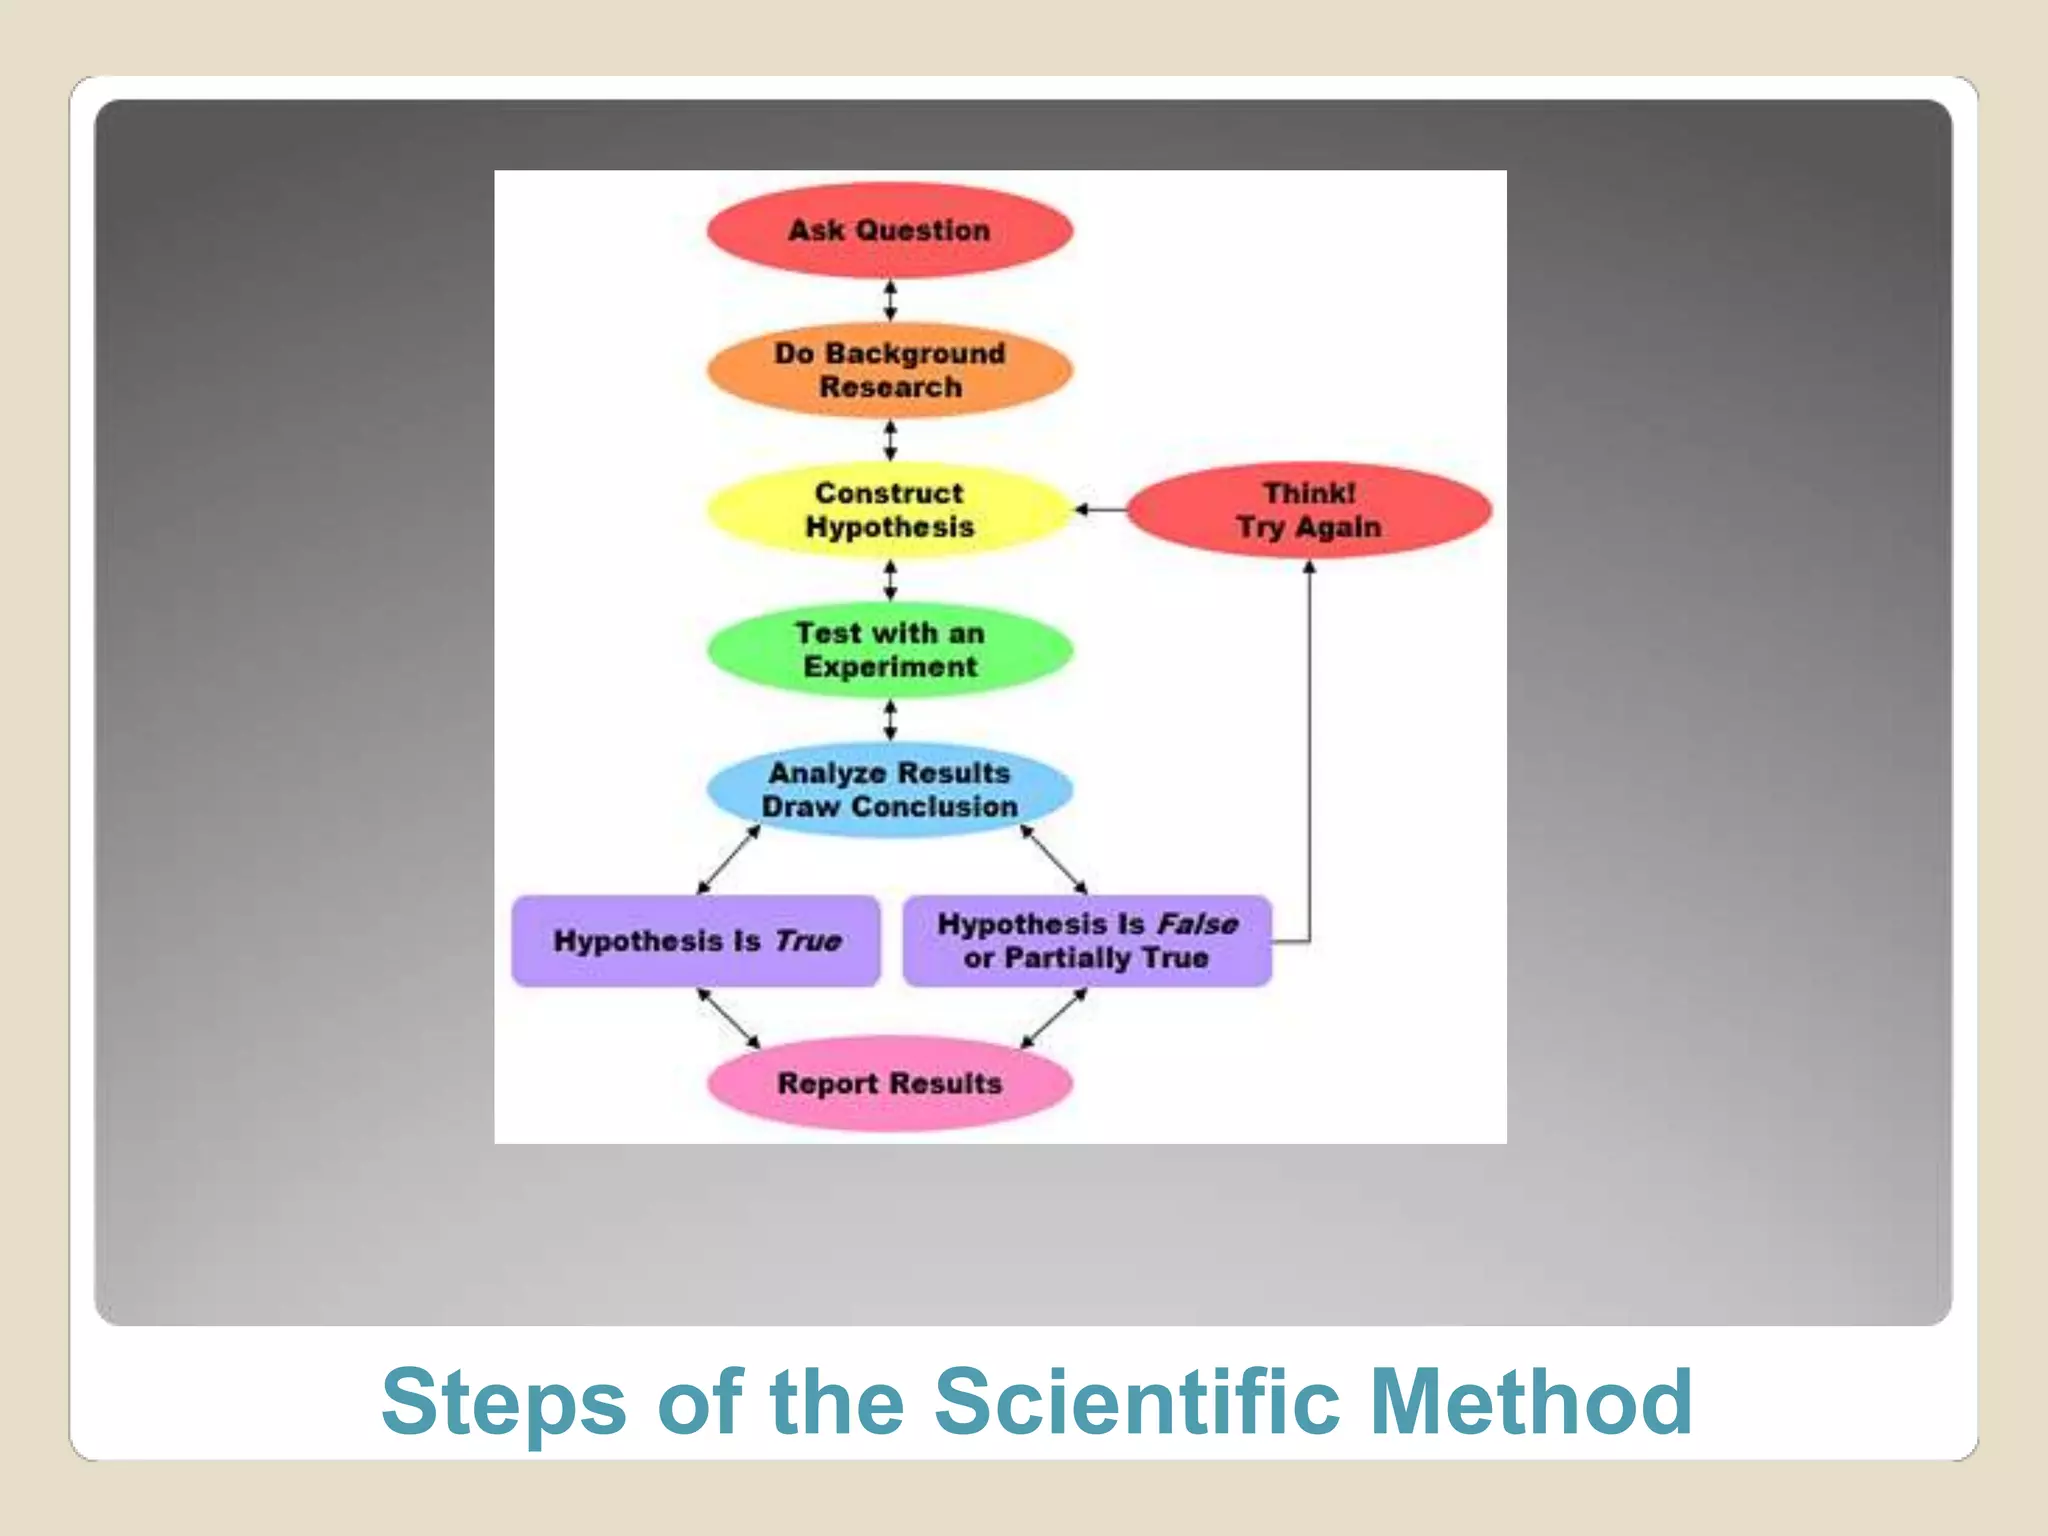
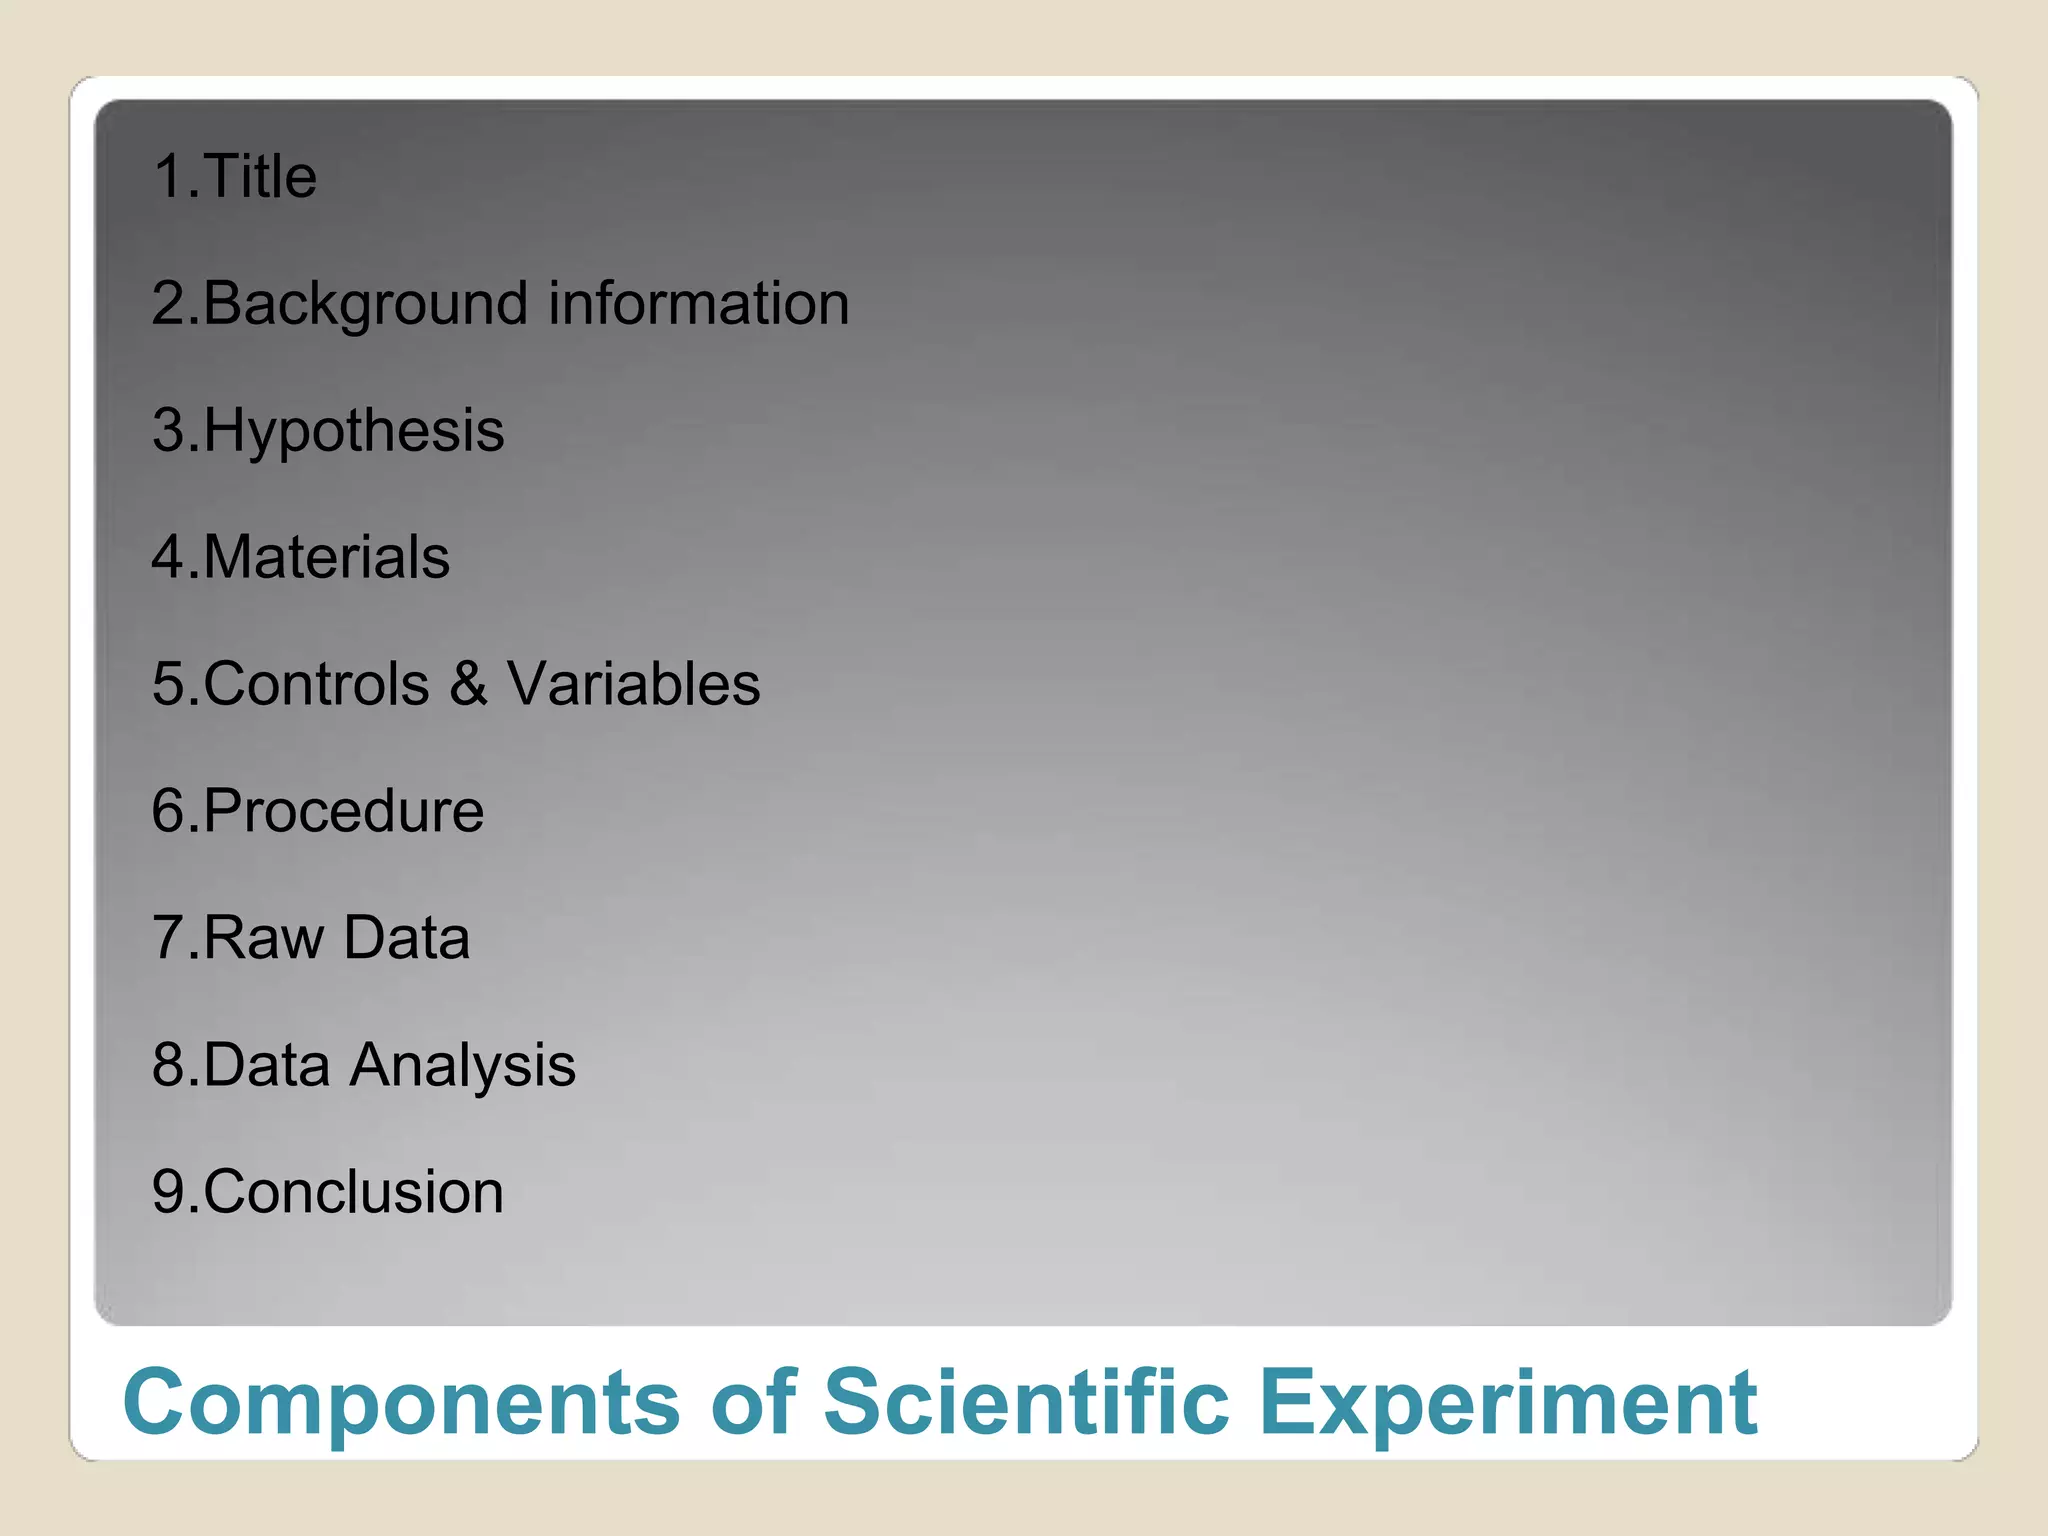
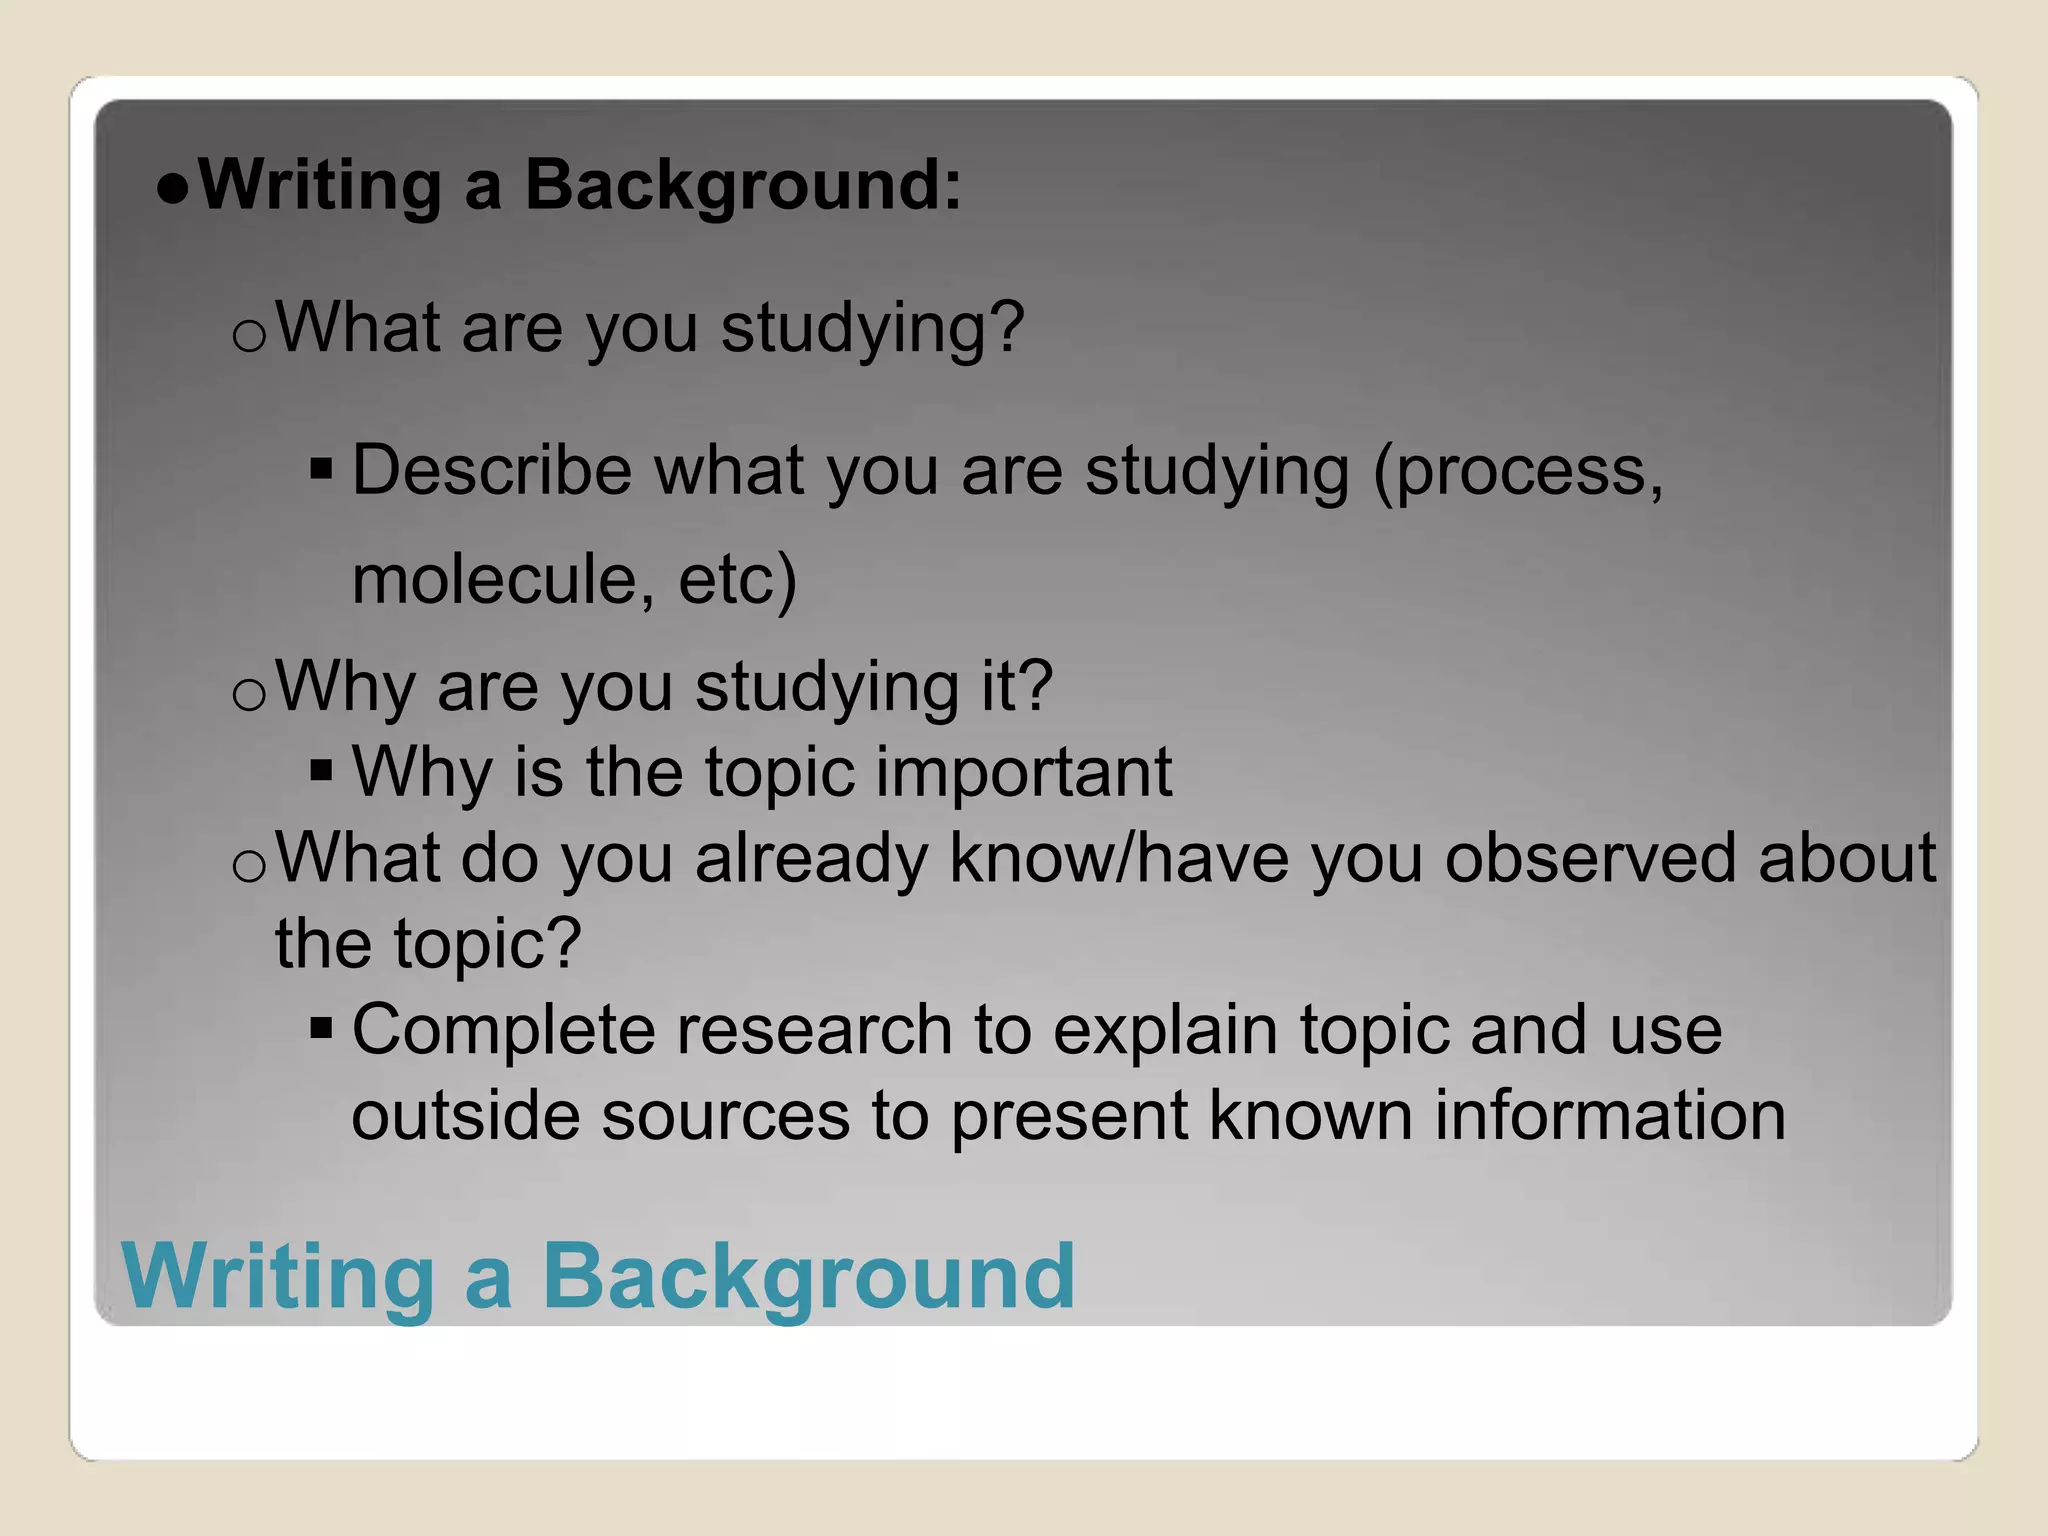
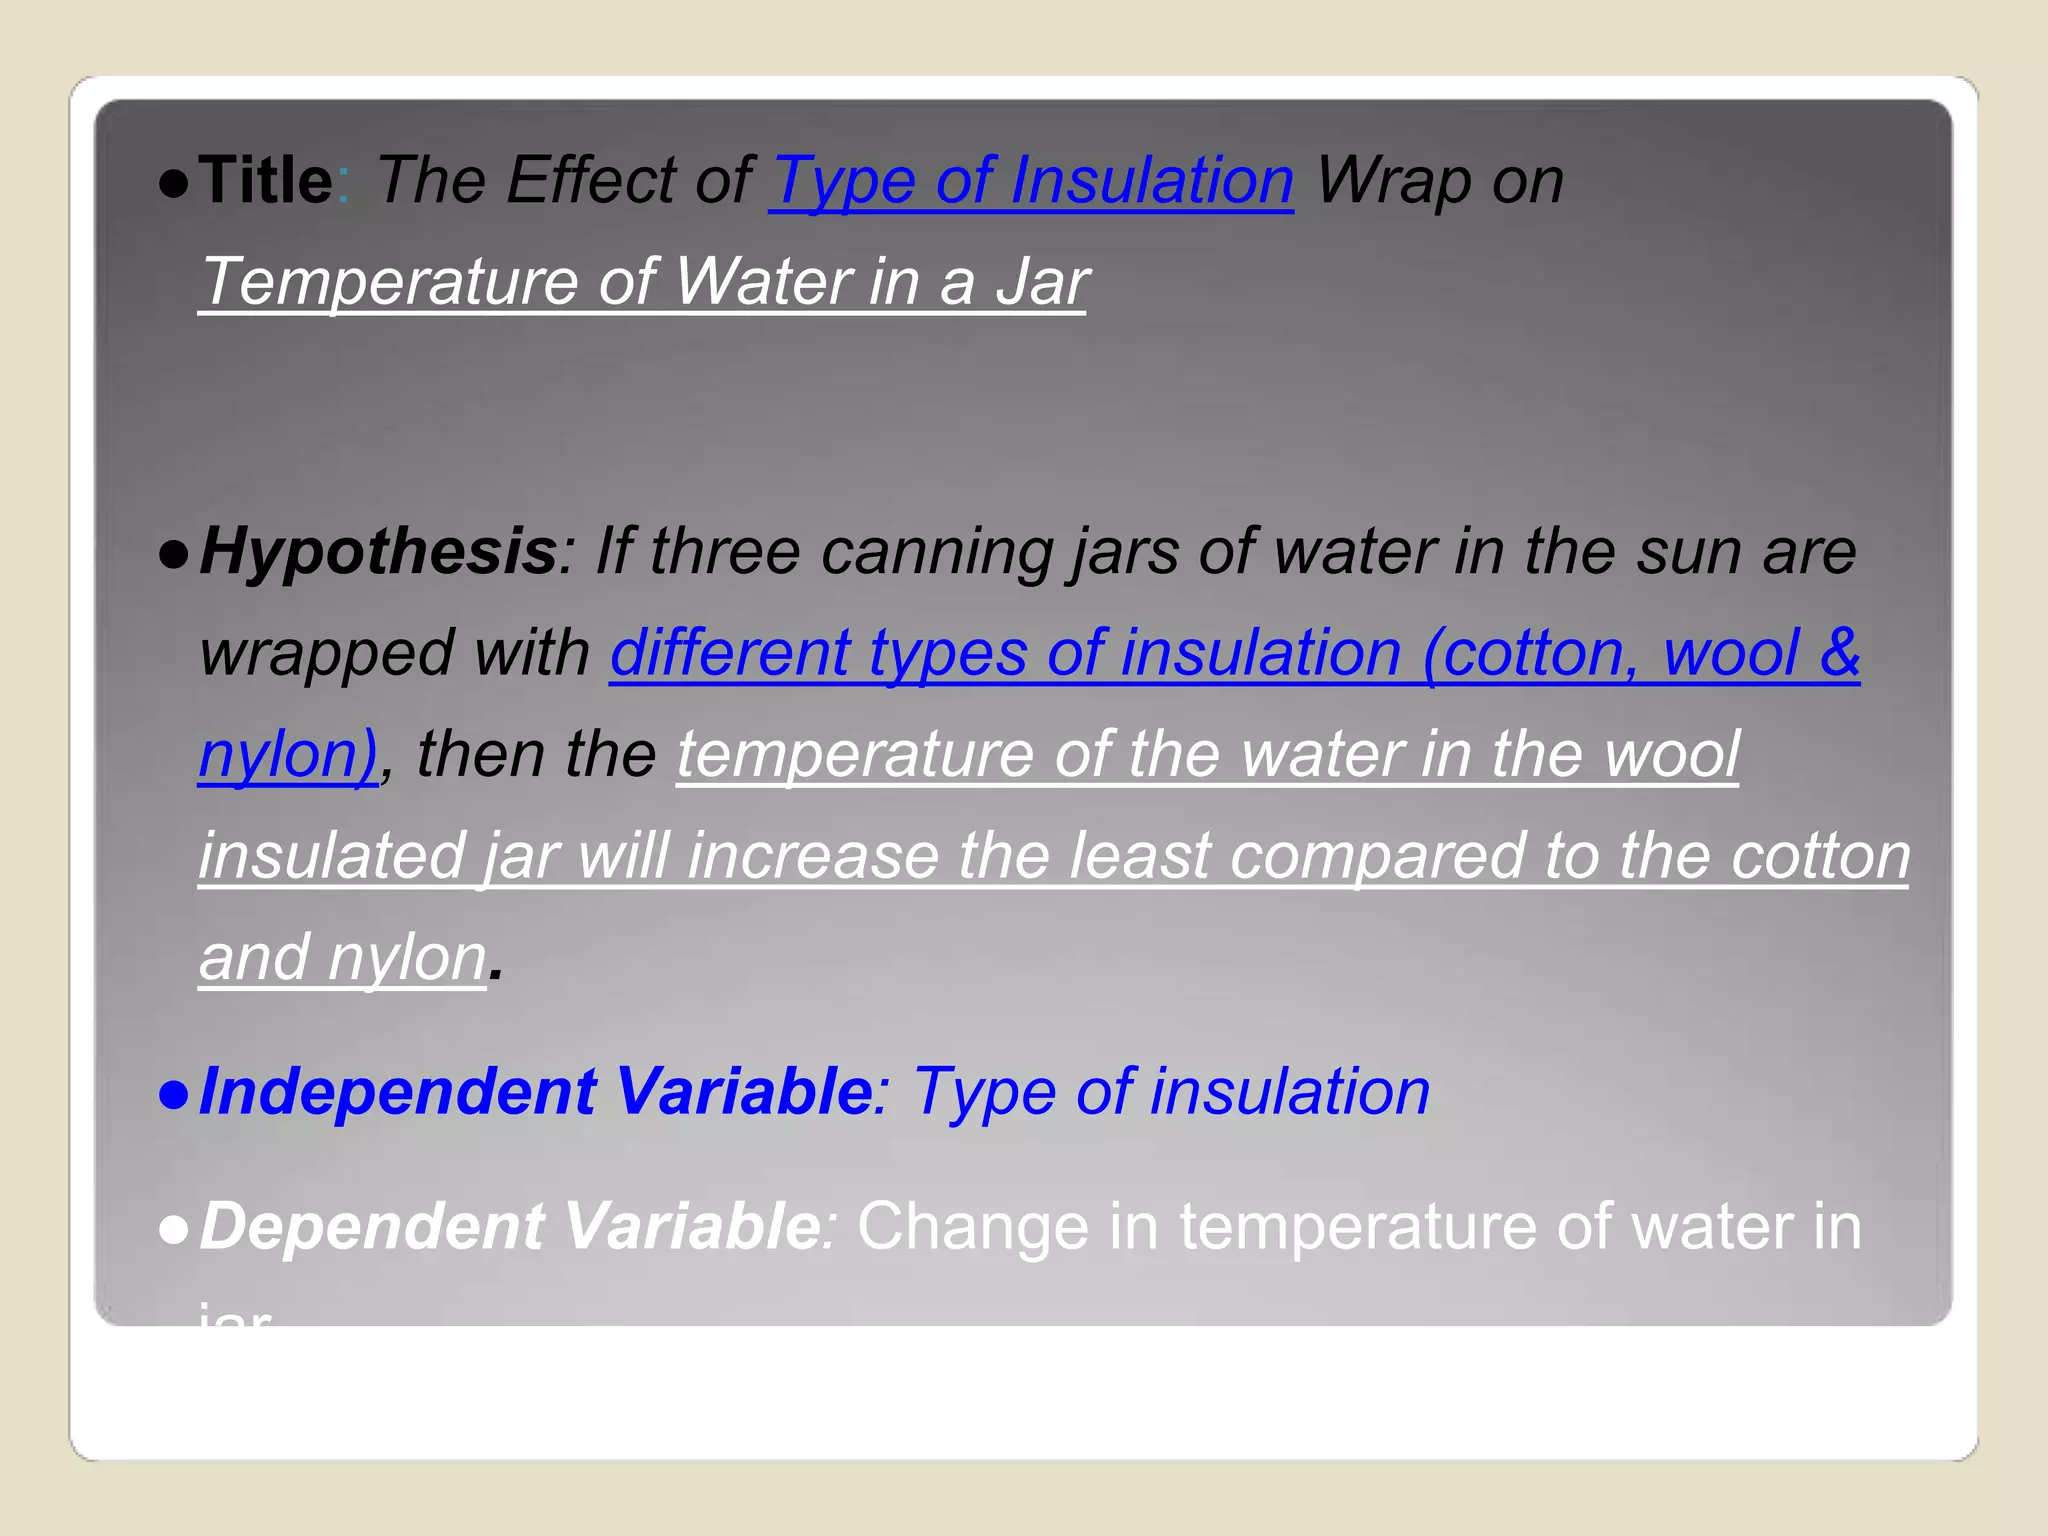
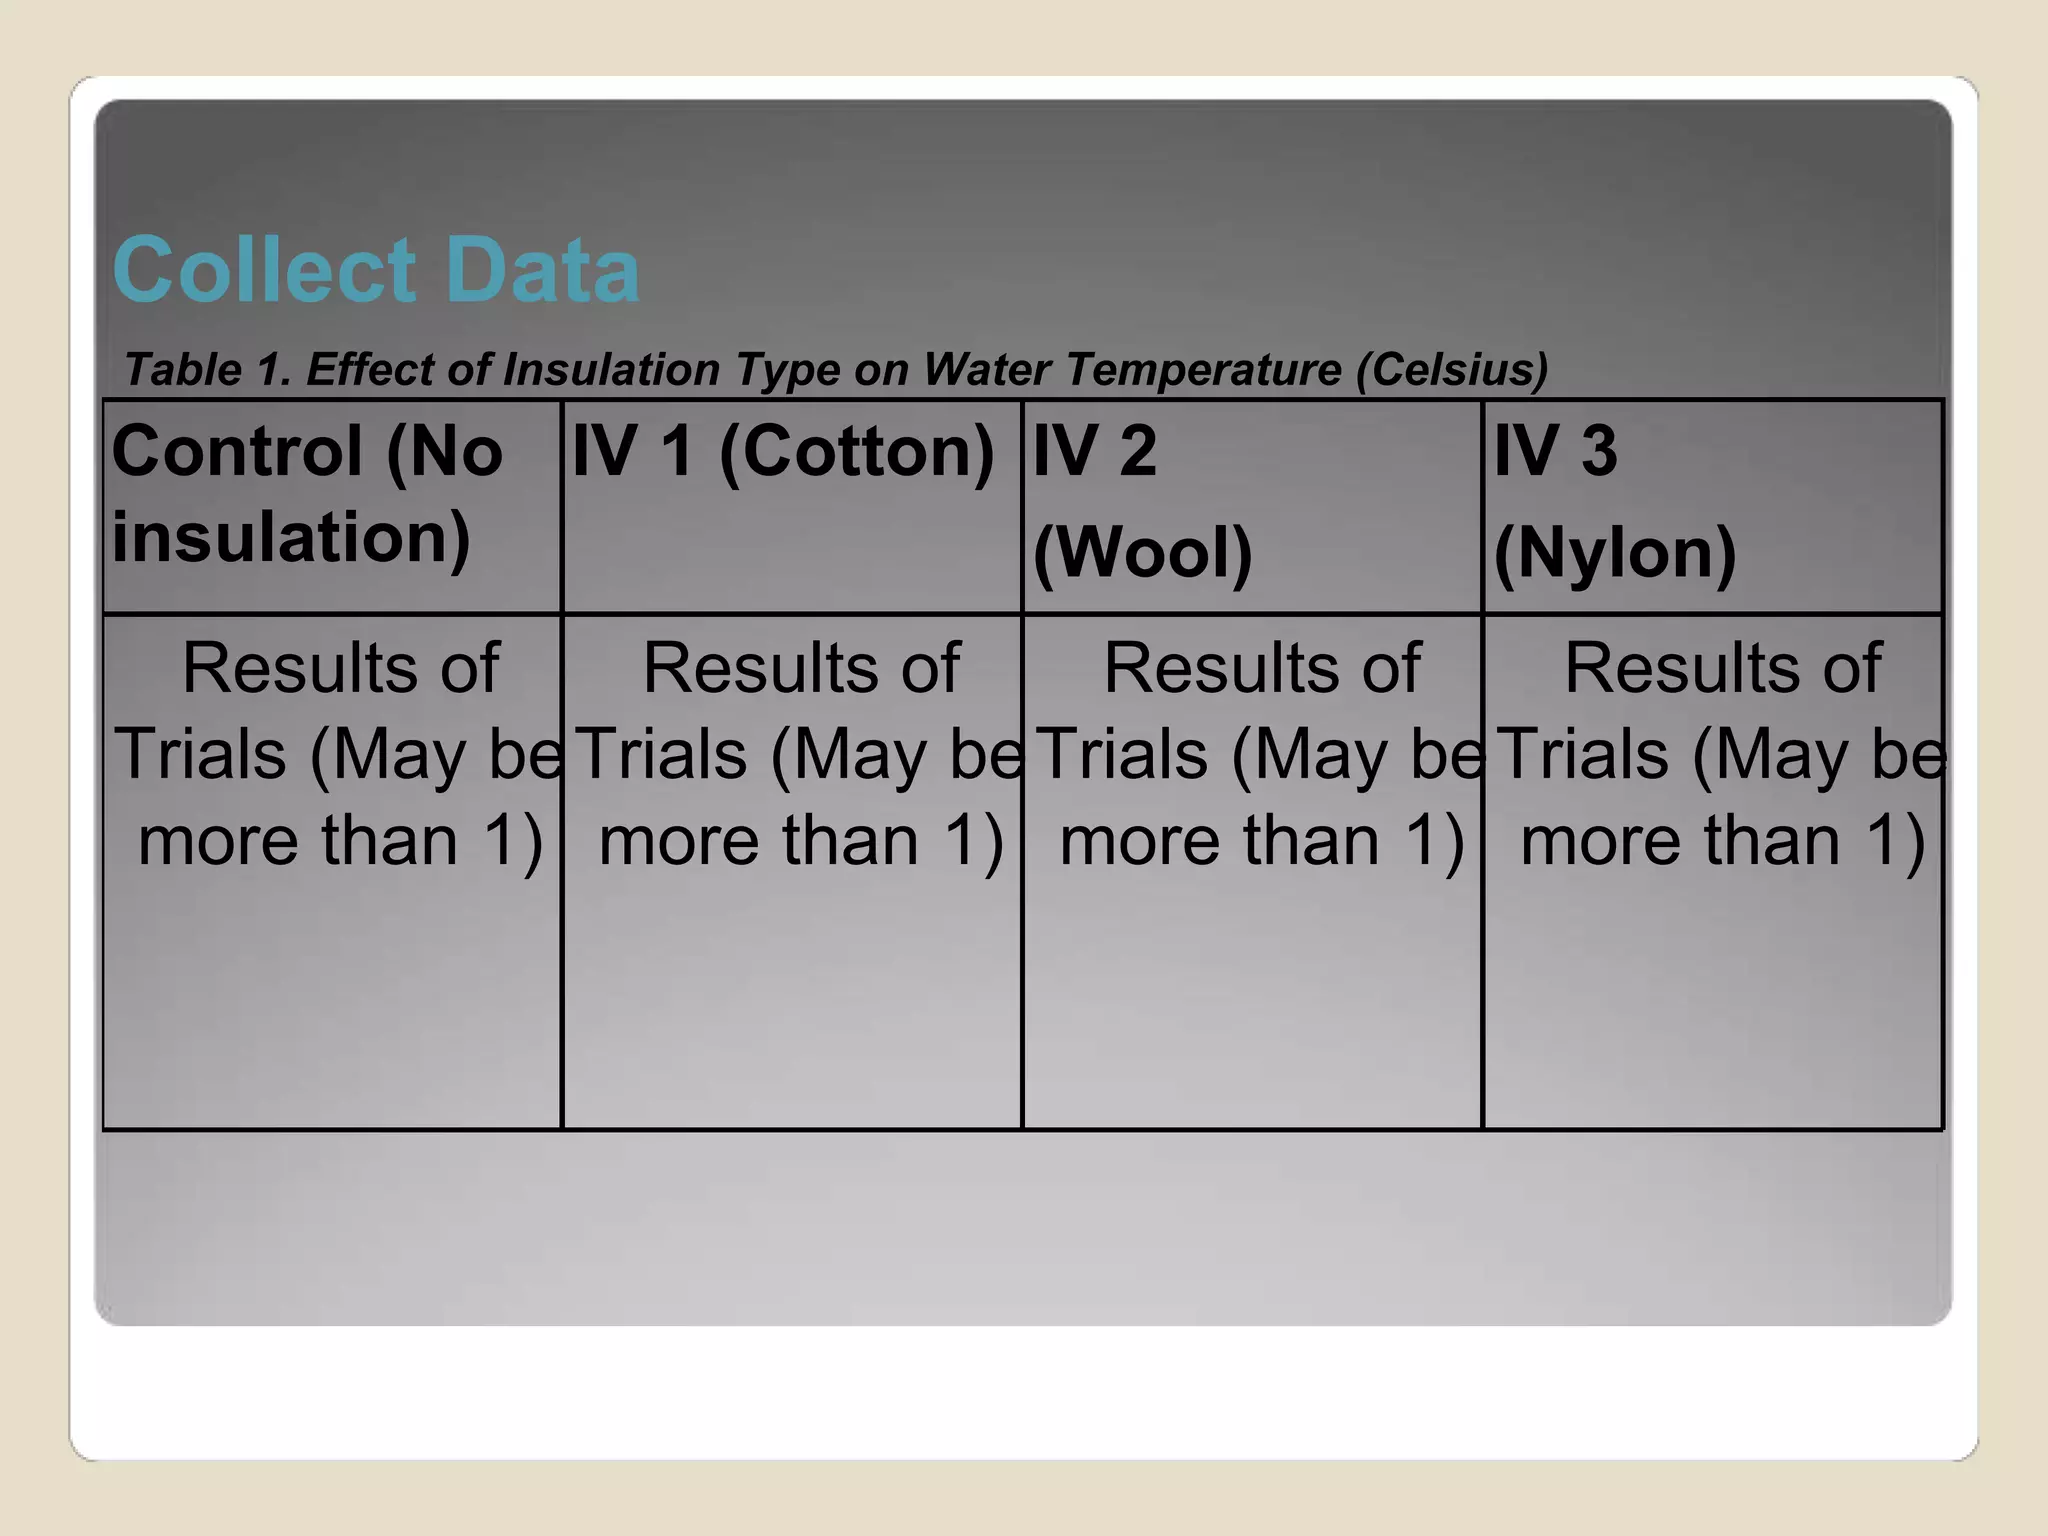
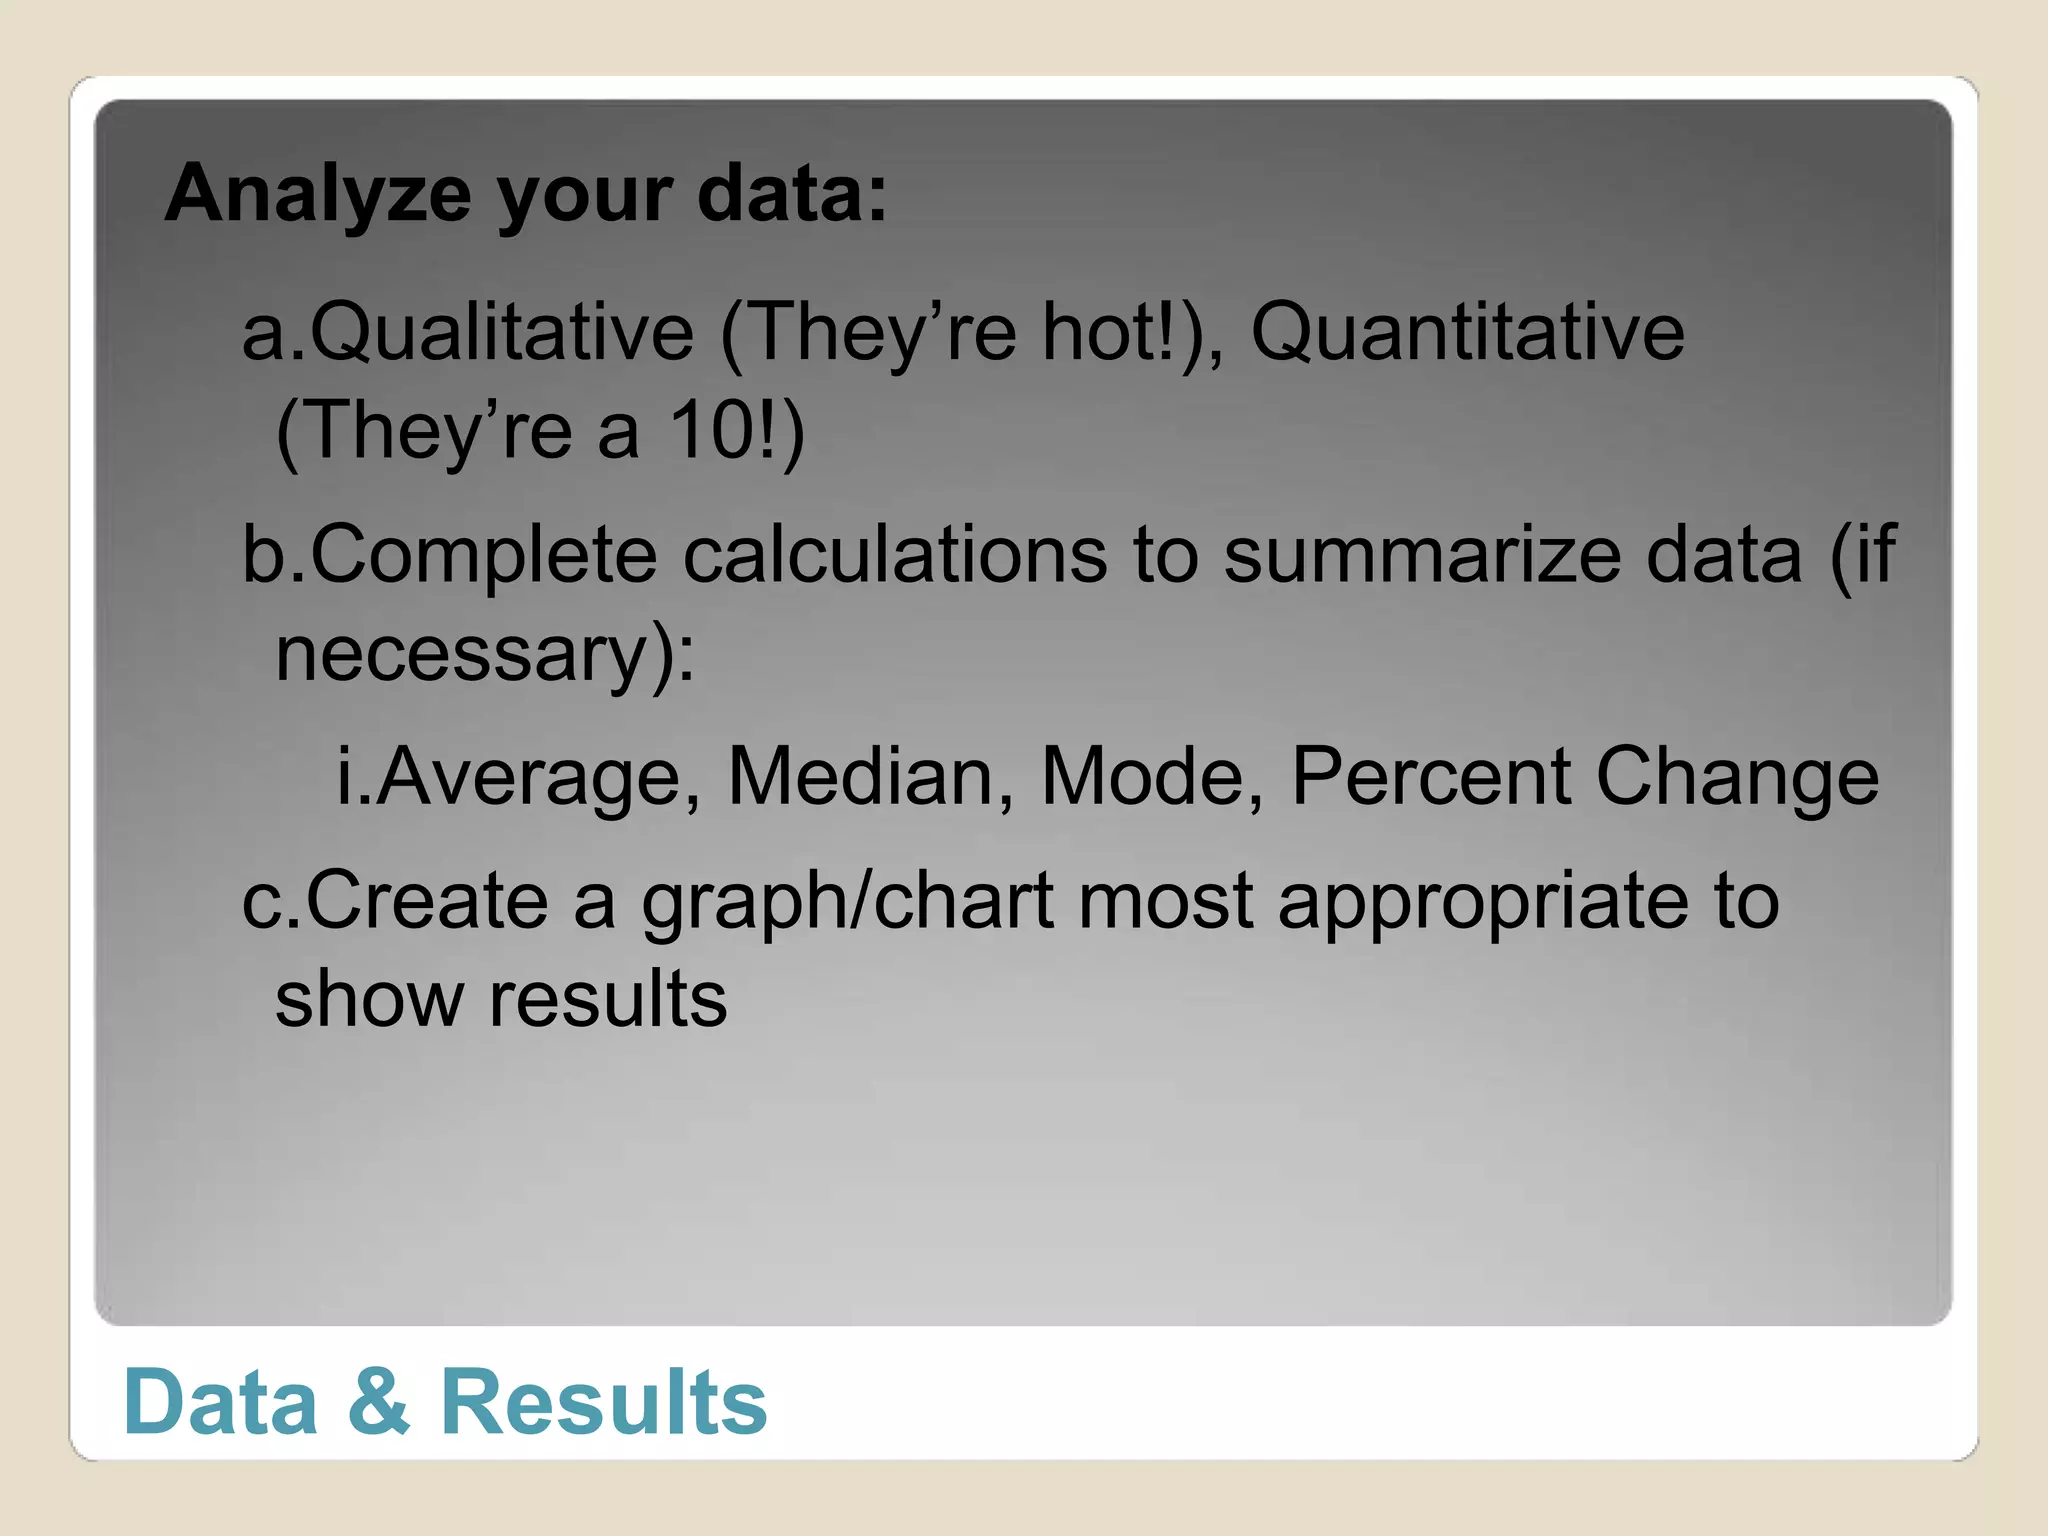
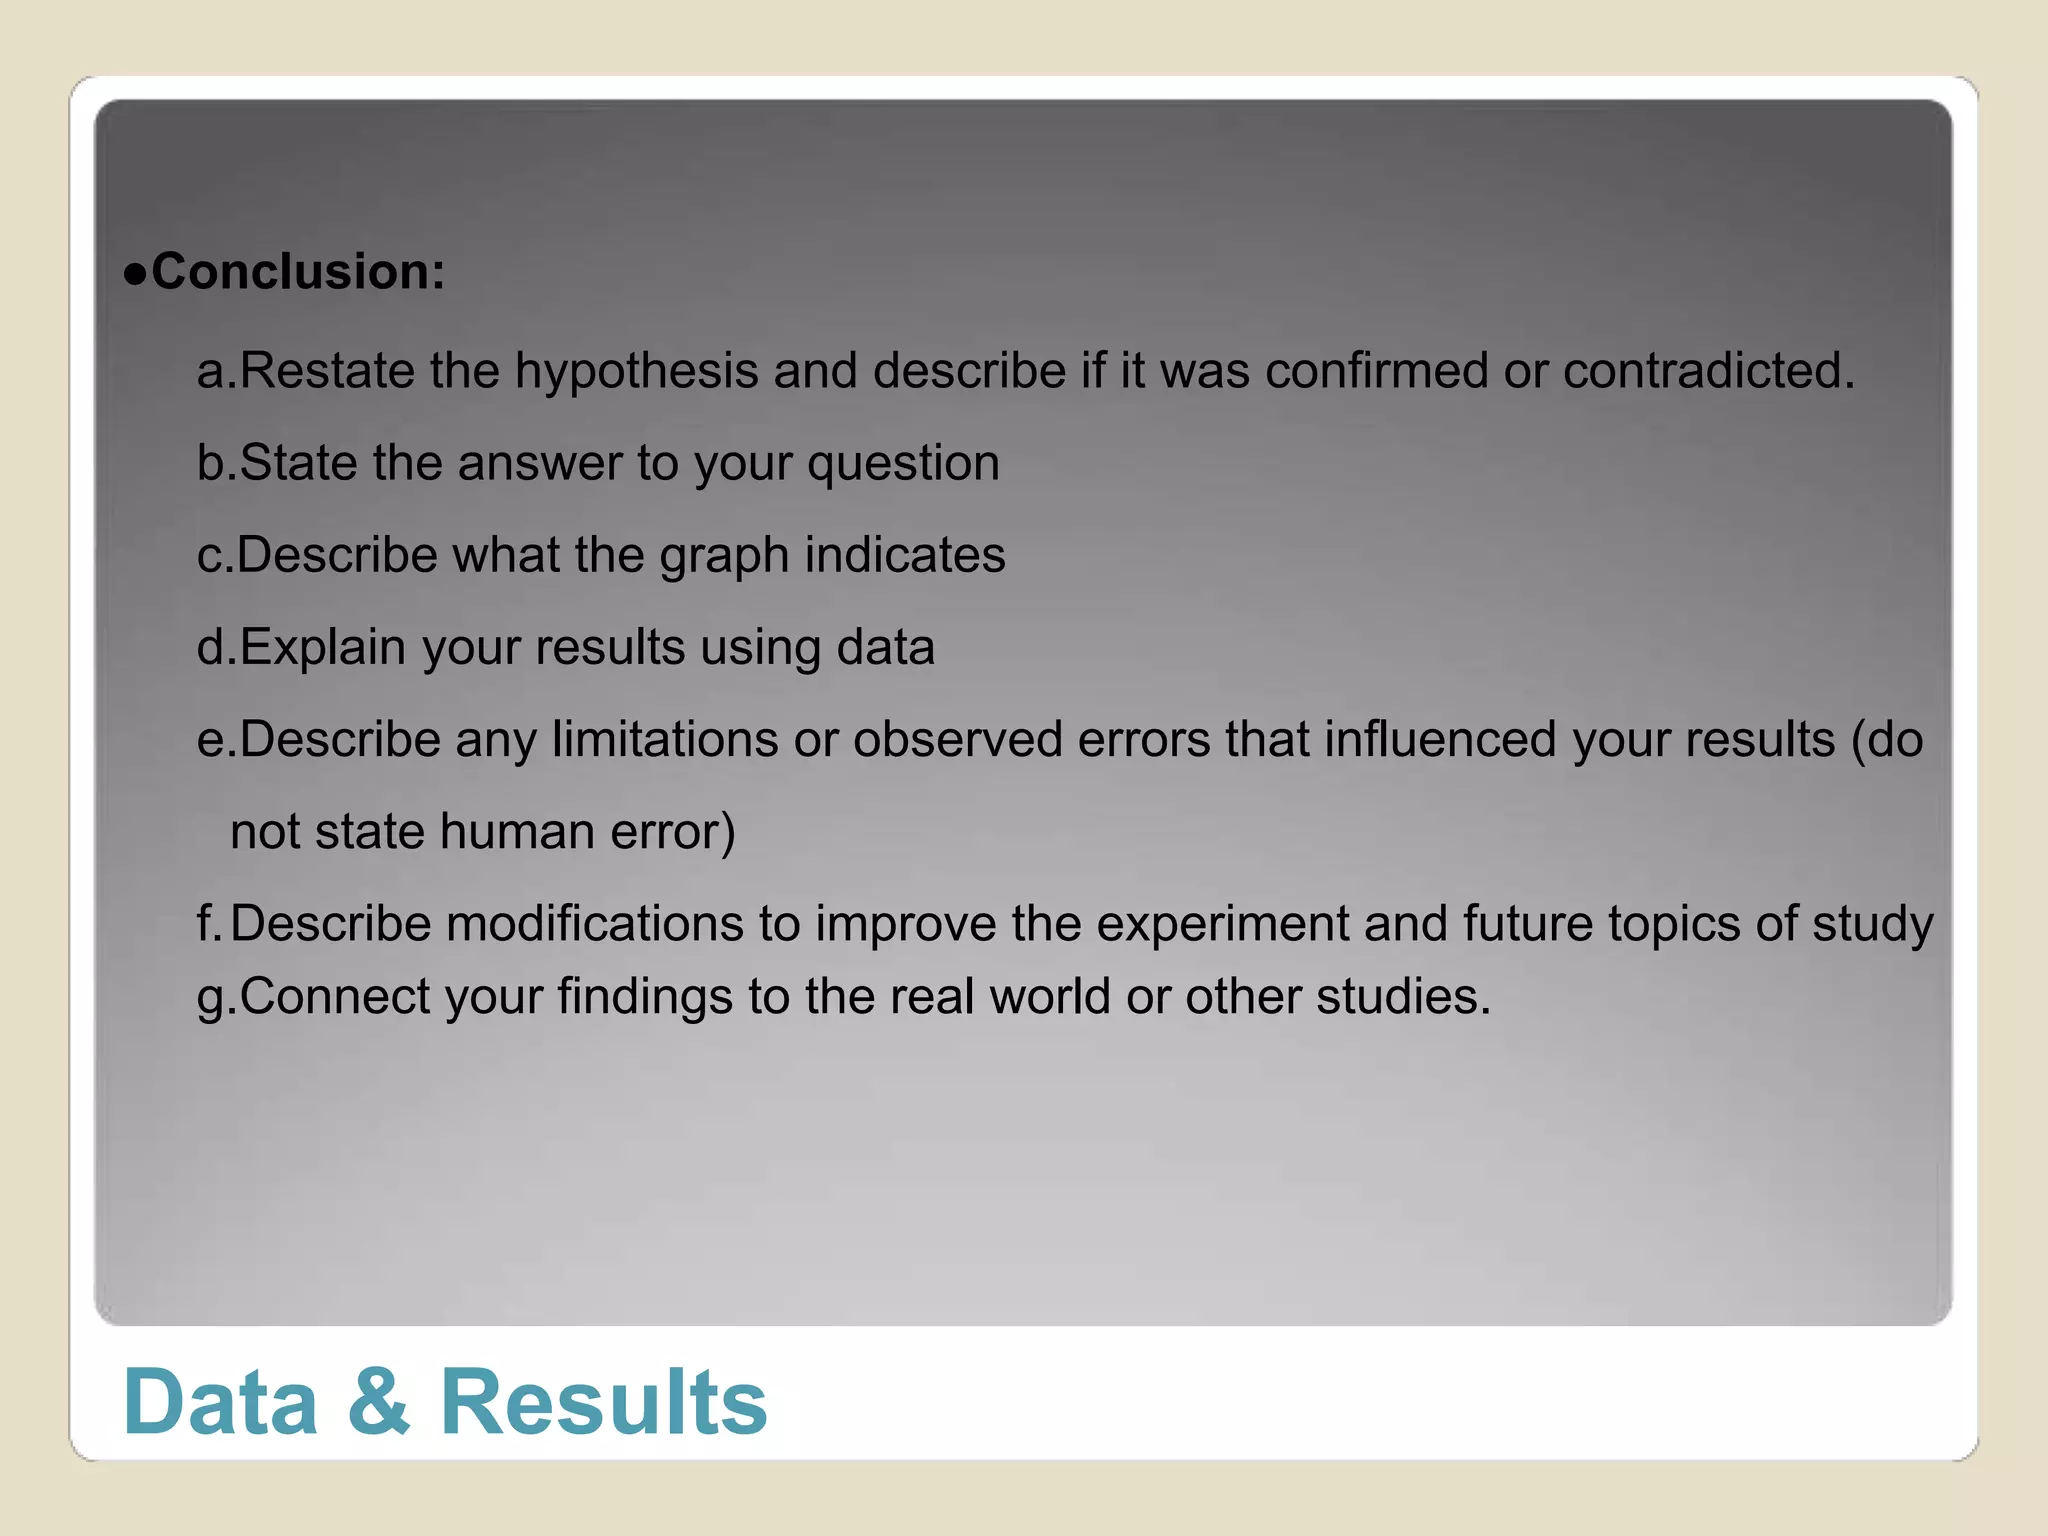
Practicing Scientific Method
Steps of the Scientific Method
1.Title 
2.Background information 
3.Hypothesis 
4.Materials 
5.Controls & Variables 
6.Procedure 
7.Raw Data 
8.Data Analysis 
9.Conclusion 
Components of Scientific Experiment
●Writing a Background: 
oWhat are you studying? 
 Describe what you are studying (process, 
molecule, etc) 
oWhy are you studying it? 
 Why is the topic important 
oWhat do you already know/have you observed about 
the topic? 
 Complete research to explain topic and use 
outside sources to present known information 
Writing a Background
●Variables are factors that change during an 
experiment. 
●Independent Variable (IV): variable that is 
purposely changed during experiment 
●Dependent Variable (DV): variable that 
changes in response to purposeful change (IV) 
Variables
●Control: Variable that all others will be compared 
to 
oControl group gives you something to compare 
the experimental group to 
●Procedure: Numbered step by step instructions of 
what you will do 
●Constant: Experimental aspect that is kept the 
same for all trials 
oThere should be numerous constants per 
experiment (shoot for at least five)
●Title of Experiment: 
oThe Effect of (Insert Independent Variable Here) 
on (Insert Dependent Variables Here). 
●Hypothesis of Experiment: 
oIf (planned change in independent variable), then 
(predicted change in dependent variable) 
Or another way to look at it… 
oIf (I do this) , then (this) will happen. 
●Test your hypothesis by conducting the experiment
Example: Test 
insulation of 
different materials 
on water 
temperature in a 
glass jar.
●Title: The Effect of Type of Insulation Wrap on 
Temperature of Water in a Jar 
●Hypothesis: If three canning jars of water in the sun are 
wrapped with different types of insulation (cotton, wool & 
nylon), then the temperature of the water in the wool 
insulated jar will increase the least compared to the cotton 
and nylon. 
●Independent Variable: Type of insulation 
●Dependent Variable: Change in temperature of water in 
jar
Collect Data 
Table 1. Effect of Insulation Type on Water Temperature (Celsius) 
Control (No 
insulation) 
IV 1 (Cotton) IV 2 
(Wool) 
IV 3 
(Nylon) 
Results of 
Trials (May be 
more than 1) 
Results of 
Trials (May be 
more than 1) 
Results of 
Trials (May be 
more than 1) 
Results of 
Trials (May be 
more than 1)
Analyze your data: 
a.Qualitative (They’re hot!), Quantitative 
(They’re a 10!) 
b.Complete calculations to summarize data (if 
necessary): 
i.Average, Median, Mode, Percent Change 
c.Create a graph/chart most appropriate to 
show results 
Data & Results
●Conclusion: 
a.Restate the hypothesis and describe if it was confirmed or contradicted. 
b.State the answer to your question 
c.Describe what the graph indicates 
d.Explain your results using data 
e.Describe any limitations or observed errors that influenced your results (do 
not state human error) 
f.Describe modifications to improve the experiment and future topics of study 
g.Connect your findings to the real world or other studies. 
Data & Results
A group of scientists want to measure the effect of adding 
different types of nutrients to the same plant species. They 
plan to add 3 different nutrients to the same species and 
measure the effect on the plant’s growth. 
1.What is the independent variable? 
2.What is the dependent variable? 
3.What would be an appropriate control? 
4.What are some of the constants? 
5.Describe what the graph would probably look like. 
Practice Science Method

Practicing sceintific method

  • 1.
  • 2.
    Steps of theScientific Method
  • 3.
    1.Title 2.Background information 3.Hypothesis 4.Materials 5.Controls & Variables 6.Procedure 7.Raw Data 8.Data Analysis 9.Conclusion Components of Scientific Experiment
  • 4.
    ●Writing a Background: oWhat are you studying?  Describe what you are studying (process, molecule, etc) oWhy are you studying it?  Why is the topic important oWhat do you already know/have you observed about the topic?  Complete research to explain topic and use outside sources to present known information Writing a Background
  • 5.
    ●Variables are factorsthat change during an experiment. ●Independent Variable (IV): variable that is purposely changed during experiment ●Dependent Variable (DV): variable that changes in response to purposeful change (IV) Variables
  • 6.
    ●Control: Variable thatall others will be compared to oControl group gives you something to compare the experimental group to ●Procedure: Numbered step by step instructions of what you will do ●Constant: Experimental aspect that is kept the same for all trials oThere should be numerous constants per experiment (shoot for at least five)
  • 7.
    ●Title of Experiment: oThe Effect of (Insert Independent Variable Here) on (Insert Dependent Variables Here). ●Hypothesis of Experiment: oIf (planned change in independent variable), then (predicted change in dependent variable) Or another way to look at it… oIf (I do this) , then (this) will happen. ●Test your hypothesis by conducting the experiment
  • 8.
    Example: Test insulationof different materials on water temperature in a glass jar.
  • 9.
    ●Title: The Effectof Type of Insulation Wrap on Temperature of Water in a Jar ●Hypothesis: If three canning jars of water in the sun are wrapped with different types of insulation (cotton, wool & nylon), then the temperature of the water in the wool insulated jar will increase the least compared to the cotton and nylon. ●Independent Variable: Type of insulation ●Dependent Variable: Change in temperature of water in jar
  • 10.
    Collect Data Table1. Effect of Insulation Type on Water Temperature (Celsius) Control (No insulation) IV 1 (Cotton) IV 2 (Wool) IV 3 (Nylon) Results of Trials (May be more than 1) Results of Trials (May be more than 1) Results of Trials (May be more than 1) Results of Trials (May be more than 1)
  • 11.
    Analyze your data: a.Qualitative (They’re hot!), Quantitative (They’re a 10!) b.Complete calculations to summarize data (if necessary): i.Average, Median, Mode, Percent Change c.Create a graph/chart most appropriate to show results Data & Results
  • 12.
    ●Conclusion: a.Restate thehypothesis and describe if it was confirmed or contradicted. b.State the answer to your question c.Describe what the graph indicates d.Explain your results using data e.Describe any limitations or observed errors that influenced your results (do not state human error) f.Describe modifications to improve the experiment and future topics of study g.Connect your findings to the real world or other studies. Data & Results
  • 13.
    A group ofscientists want to measure the effect of adding different types of nutrients to the same plant species. They plan to add 3 different nutrients to the same species and measure the effect on the plant’s growth. 1.What is the independent variable? 2.What is the dependent variable? 3.What would be an appropriate control? 4.What are some of the constants? 5.Describe what the graph would probably look like. Practice Science Method