Here are the identified variables for each hypothesis:
1) IV: weight of bowling ball
DV: speed it traveled down lane
2) IV: brand of paper towel
DV: amount of water absorbed per minute
3) IV: location of the plants
DV: height of plants
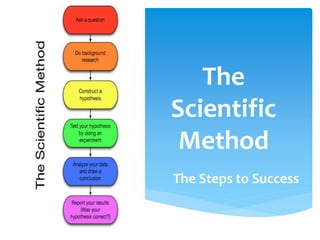
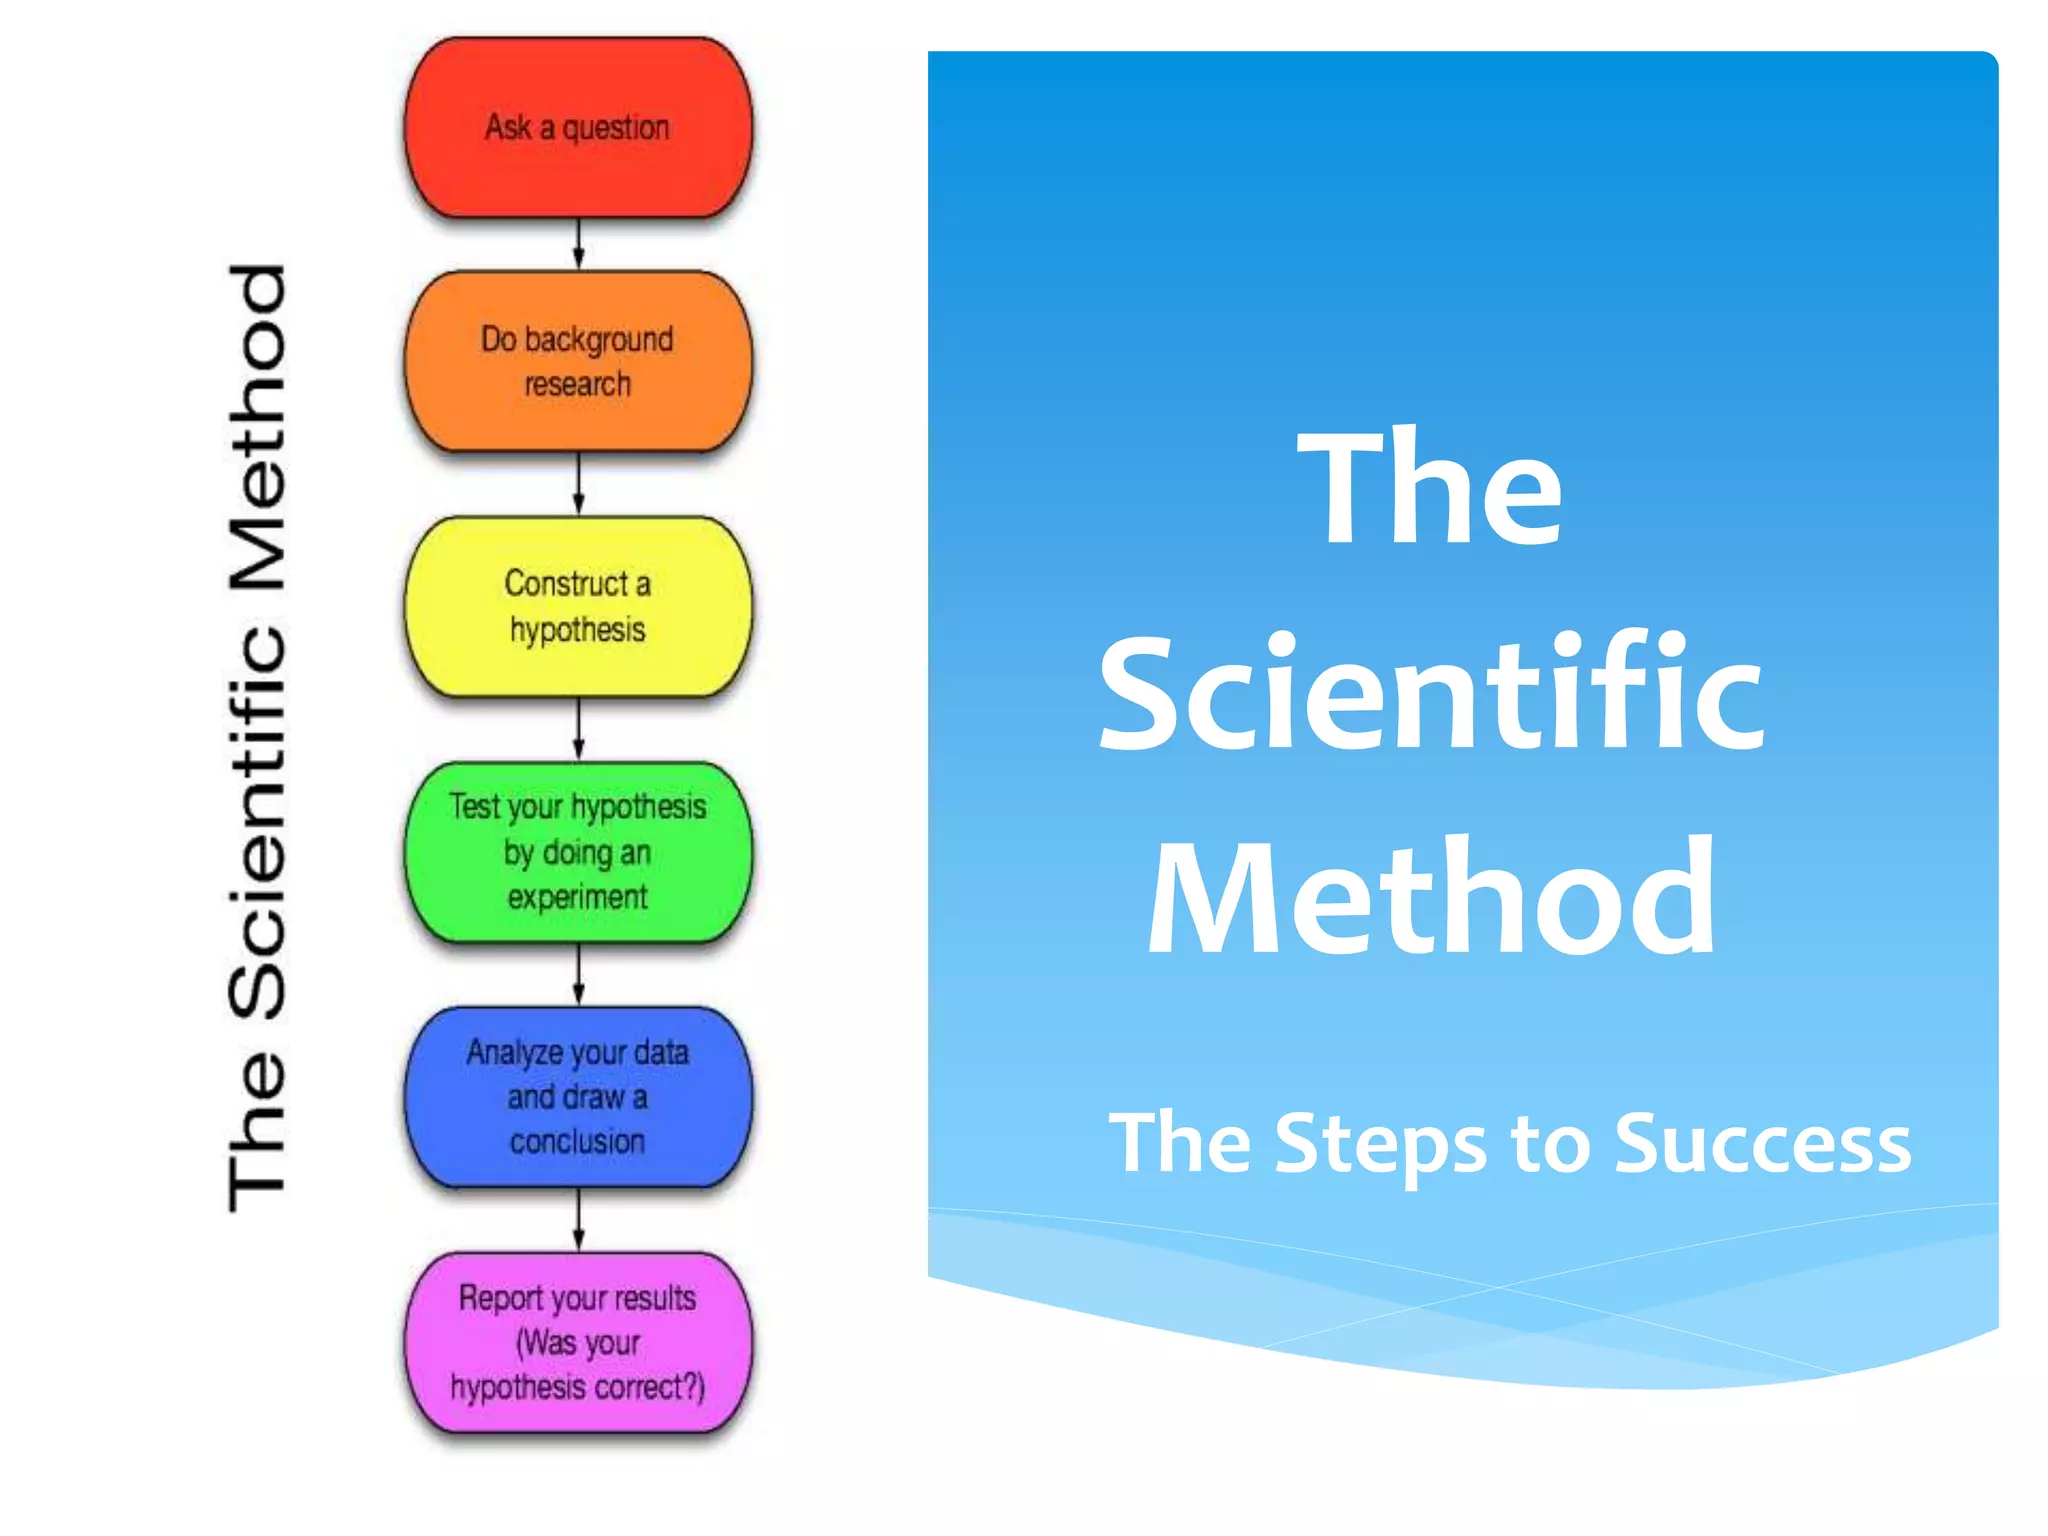
The Scientific Method
Whatis the scientific
method?
It is a process that
is used to find
answers to
questions about
the world around
us.
3.
Is thereonly one “scientific method”?
No, there are several versions of the
scientific method.
Some versions have more steps, while
others may have only a few.
However, they all begin with the
identification of a problem or a question to
be answered based on observations of the
world around us.
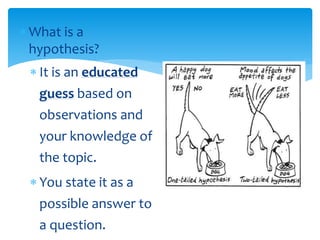
What isa
hypothesis?
It is an educated
guess based on
observations and
your knowledge of
the topic.
You state it as a
possible answer to
a question.
6.
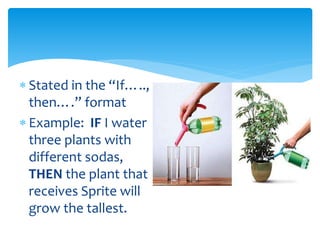
Stated inthe “If…..,
then….” format
Example: IF I water
three plants with
different sodas,
THEN the plant that
receives Sprite will
grow the tallest.
7.
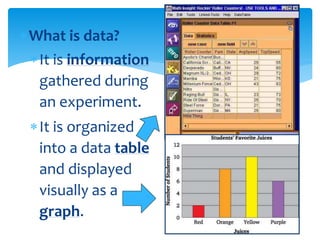
What is data?
Itis information
gathered during
an experiment.
It is organized
into a data table
and displayed
visually as a
graph.
8.
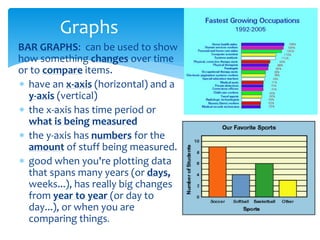
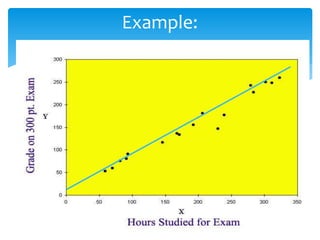
Graphs
BAR GRAPHS:can be used to show
how something changes over time
or to compare items.
have an x-axis (horizontal) and a
y-axis (vertical)
the x-axis has time period or
what is being measured
the y-axis has numbers for the
amount of stuff being measured.
good when you're plotting data
that spans many years (or days,
weeks...), has really big changes
from year to year (or day to
day...), or when you are
comparing things.
9.
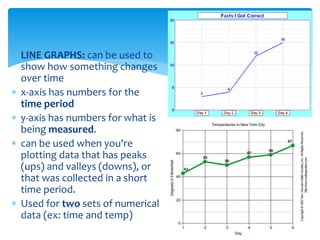
LINE GRAPHS:can be used to
show how something changes
over time
x-axis has numbers for the
time period
y-axis has numbers for what is
being measured.
can be used when you're
plotting data that has peaks
(ups) and valleys (downs), or
that was collected in a short
time period.
Used for two sets of numerical
data (ex: time and temp)
10.
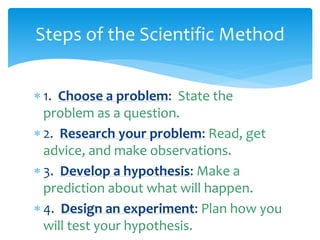
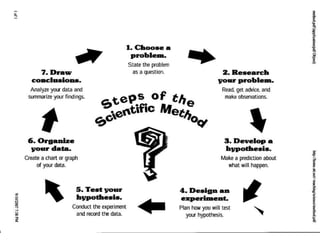
1. Choosea problem: State the
problem as a question.
2. Research your problem: Read, get
advice, and make observations.
3. Develop a hypothesis: Make a
prediction about what will happen.
4. Design an experiment: Plan how you
will test your hypothesis.
Steps of the Scientific Method
11.
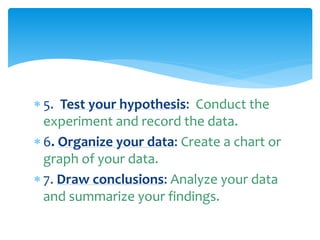
5. Testyour hypothesis: Conduct the
experiment and record the data.
6. Organize your data: Create a chart or
graph of your data.
7. Draw conclusions: Analyze your data
and summarize your findings.
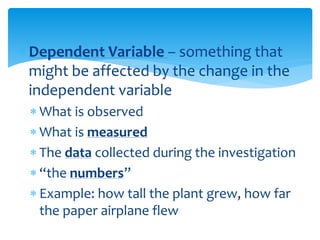
Dependent Variable –something that
might be affected by the change in the
independent variable
What is observed
What is measured
The data collected during the investigation
“the numbers”
Example: how tall the plant grew, how far
the paper airplane flew
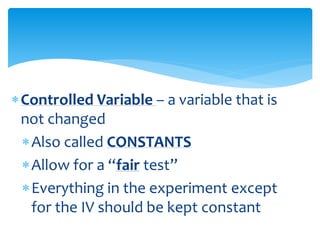
Controlled Variable –a variable that is
not changed
Also called CONSTANTS
Allow for a “fair test”
Everything in the experiment except
for the IV should be kept constant
19.
Give adetailed explanation of how you will
conduct the experiment to test your hypothesis
Be clear about the variables (elements you
change) versus your constants (elements that do
not change)
A control is the group that you use as a
comparison to see if change has occurred.
Example: In a medicine study, the group of
people who don’t get the medicine are the
control group
Procedure
20.
Be veryspecific about how you
will measure results to prove or
disprove your hypothesis. You
should include a regular timetable
for measuring results or
observing the projects (such as
every hour, every day, every
week)
21.
Conclusion: yourresults or findings based on
data collected during the experiment
Answer your problem/purpose statement
What does it all add up to? What is the value of
your project?
What further study do you recommend given the
results of your experiment? What would be the
next question to ask?
If you repeat this project, what would you
change?
Conclusion
22.
For Example:
Students ofdifferent ages were
given a jigsaw puzzle to put
together. The scientist wanted to
see if the students’ ages affected
how long it took to put the puzzle
together.
23.
Independent Variable (IV):
Agesof the students
Different ages were tested by the scientist
Dependent Variable (DV):
The time it took to put the puzzle
together
The time was observed and measured by
the scientist
Identify the Variables in this
Experiment:
24.
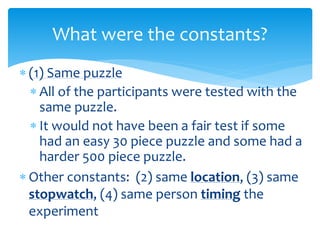
(1) Samepuzzle
All of the participants were tested with the
same puzzle.
It would not have been a fair test if some
had an easy 30 piece puzzle and some had a
harder 500 piece puzzle.
Other constants: (2) same location, (3) same
stopwatch, (4) same person timing the
experiment
What were the constants?
25.
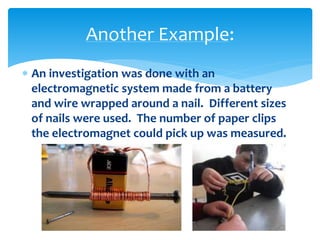
An investigationwas done with an
electromagnetic system made from a battery
and wire wrapped around a nail. Different sizes
of nails were used. The number of paper clips
the electromagnet could pick up was measured.
Another Example:
26.
IV: Sizes ofnails
These were changed by the scientist
DV: Number of paper clips picked up
The number of paper clips observed and
counted (measured)
Constants: Battery, wire, type of nail
None of these items were changed
What are the Variables?
27.
Let’s Practice!
If Iuse a heavier bowling
ball, then the ball will
travel faster down the
lane.
IV: weight of bowling ball
DV: speed it traveled down
lane
28.
2) IfI use different brands of
paper towels, then Bounty
will absorb more water per
minute than Sparkle or
Quilted.
IV: brand of paper towel
DV: amount of water
absorbed per minute
29.
3) If Iput 3 spider plants in
different locations, then the
plant in the sunlight will grow
taller in a one-week period
than the plants in the closet
and basement.
IV: location of the plants
DV: height of plants