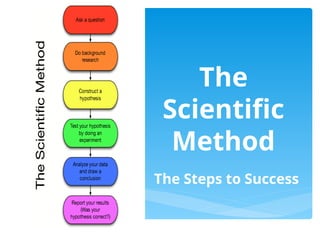
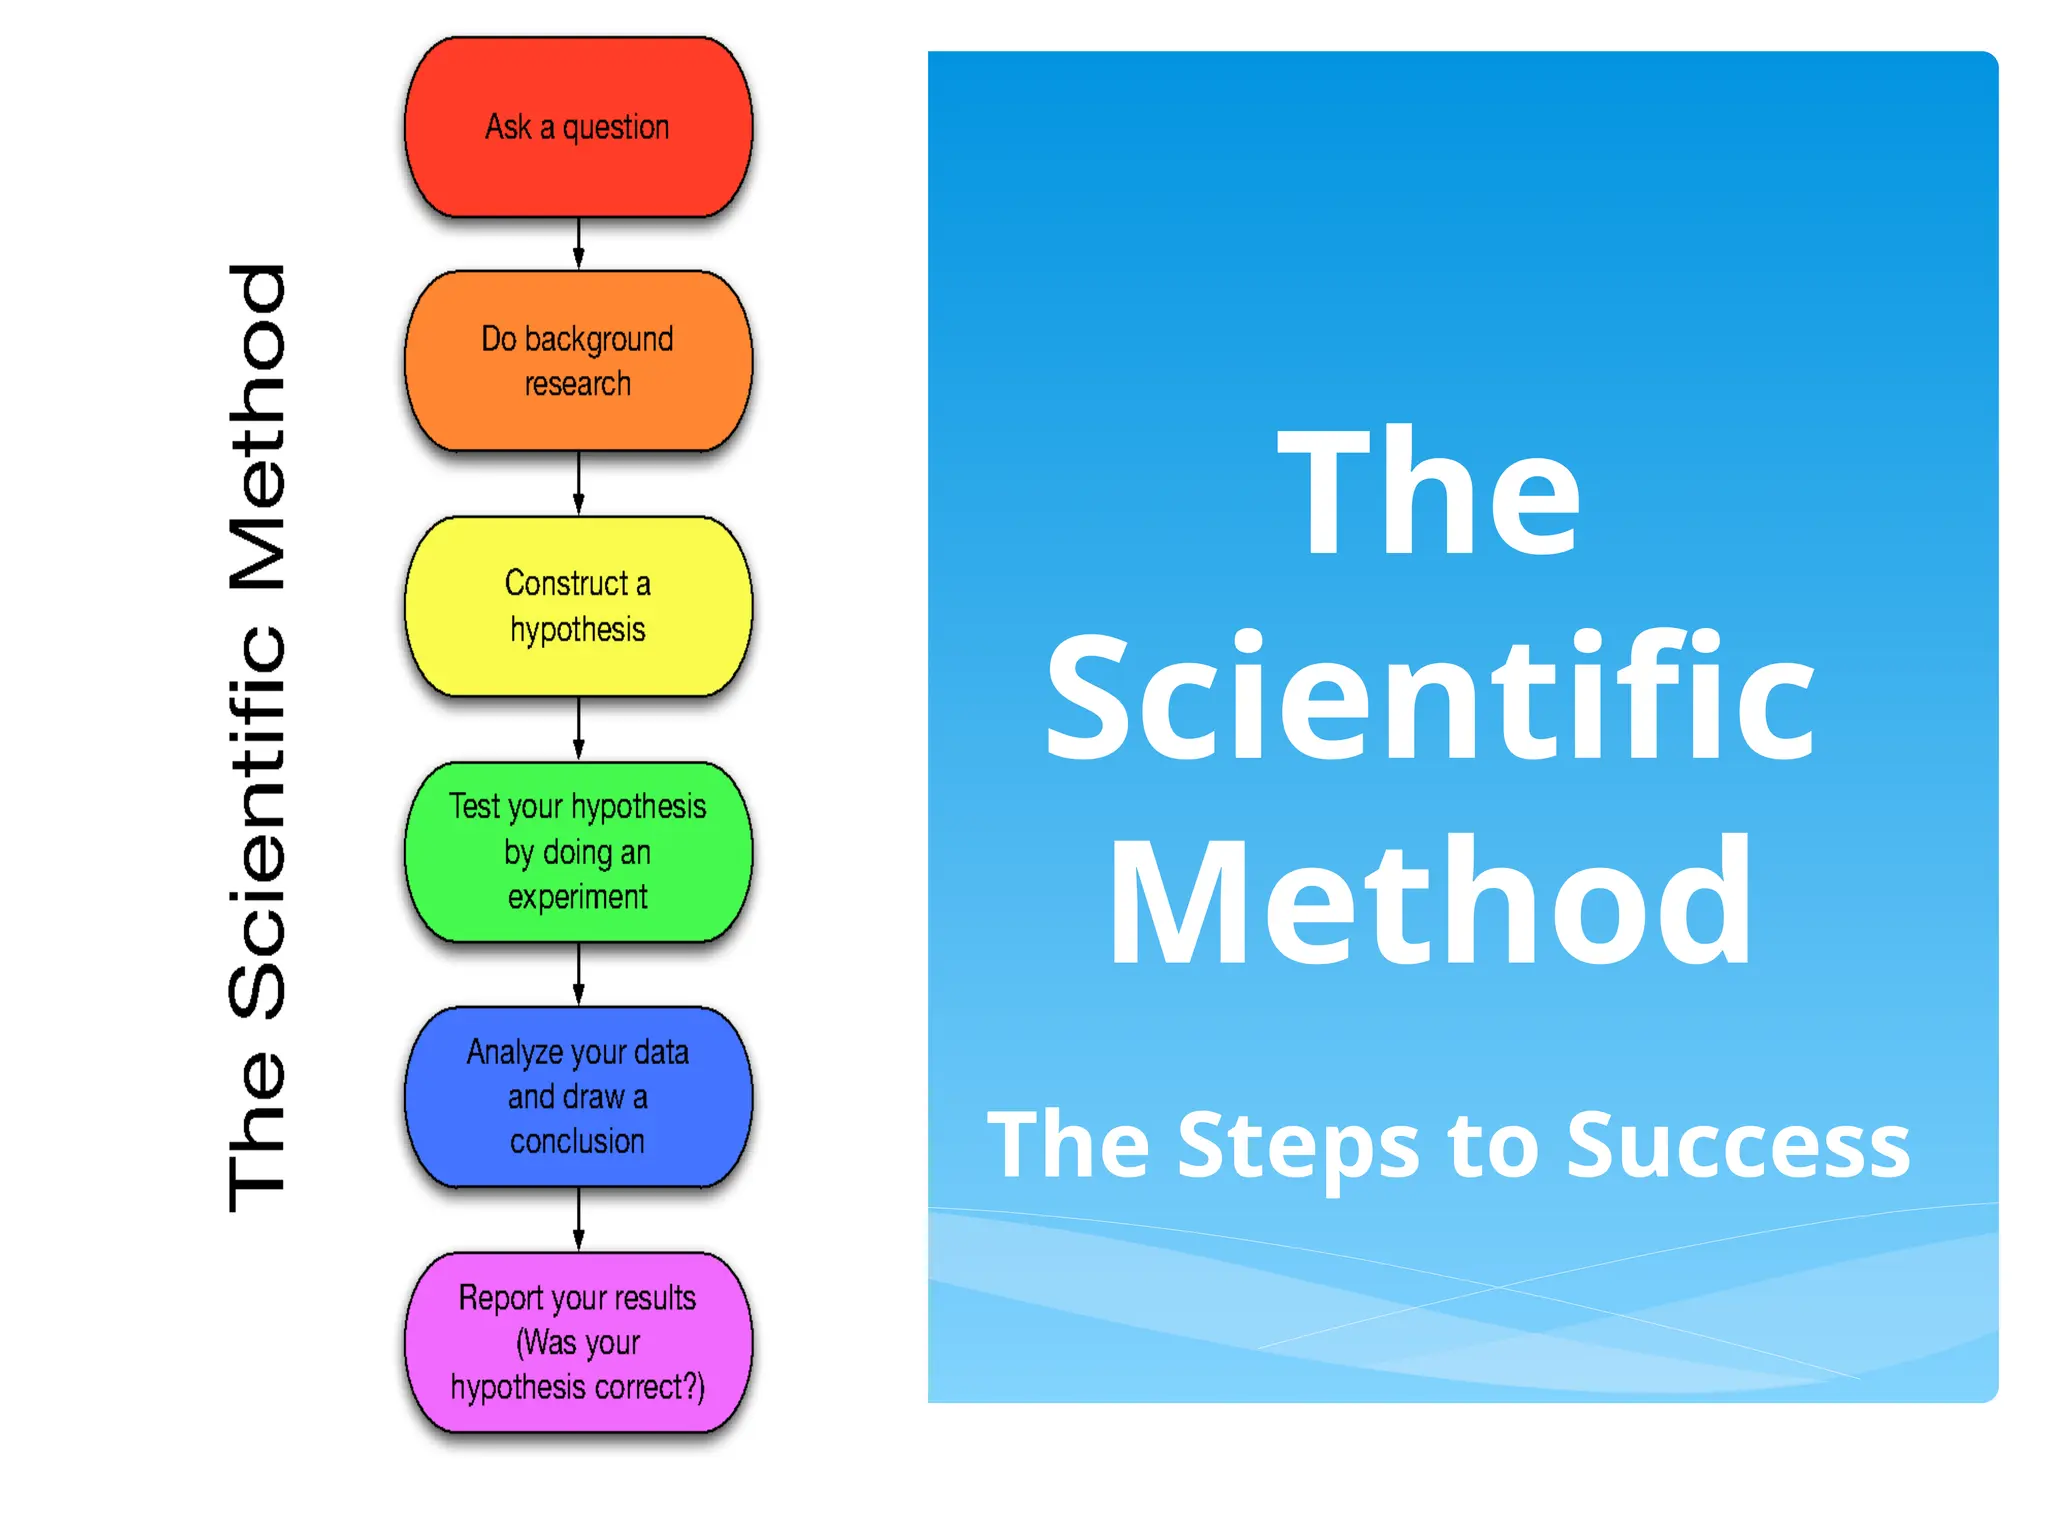
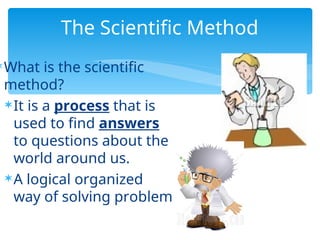
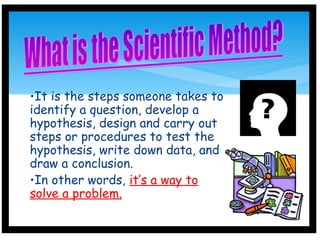
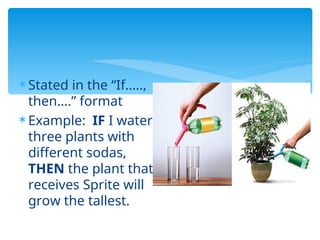
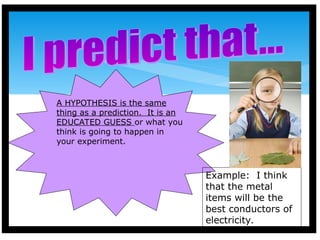
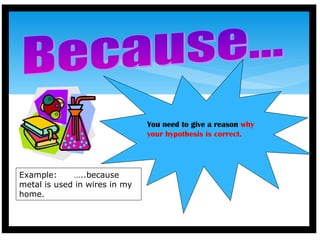
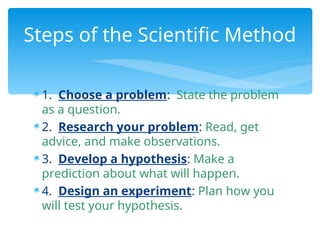
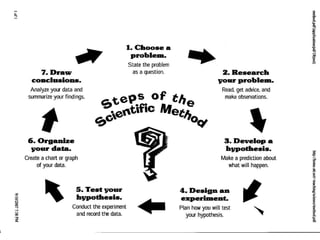
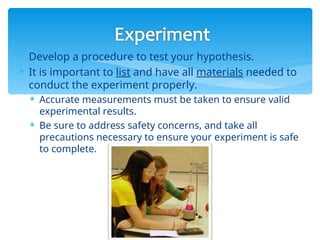
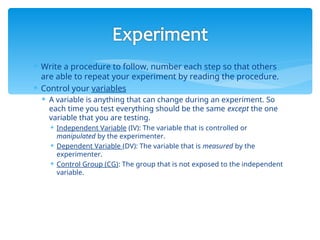
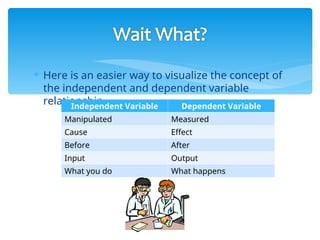
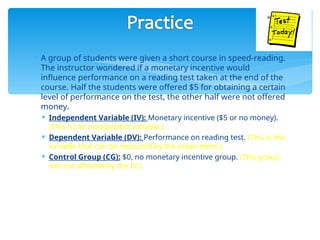
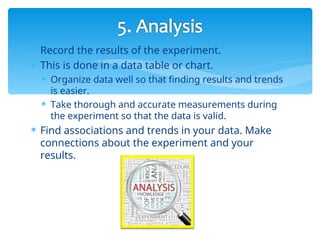
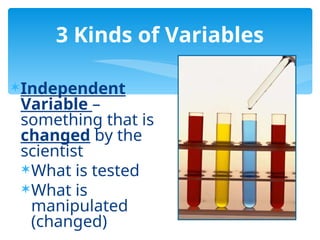
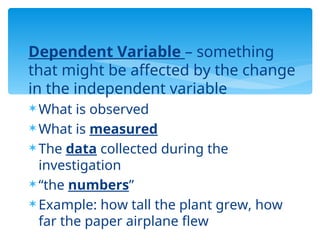
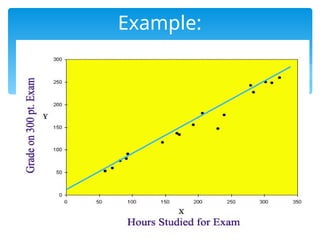
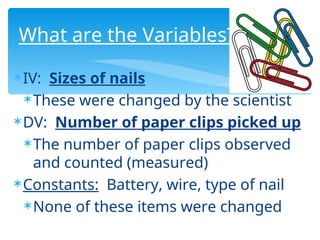
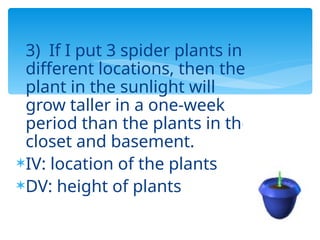
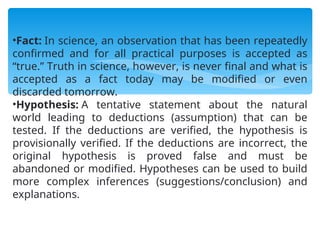
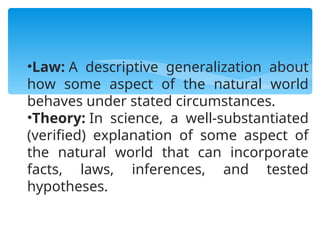
The
Scientific
Method
The Steps to Success
The Scientific Method
What is the scientific
method?
It is a process that is
used to find answers
to questions about the
world around us.
A logical organized
way of solving problem
•It is the steps someone takes to
identify a question, develop a
hypothesis, design and carry out
steps or procedures to test the
hypothesis, write down data, and
draw a conclusion.
•In other words, it’s a way to
solve a problem.
Scientists take time to think
logically when they are
investigating a question or
problem.
They break things down
into many steps that
make sense.
 Is there only one “scientific method”?
 No, there are several versions of the
scientific method.
 Some versions have more steps, while
others may have only a few.
 However, they all begin with the
identification of a problem or a question
to be answered based on observations
of the world around us.
They provide an
organized
method for
conducting and
analyzing an
experiment.
 What is a
hypothesis?
 It is an educated
guess based on
observations and
your knowledge
of the topic.
 You state it as a
possible answer
to a question.
 A hypothesis is an educated guess about the outcome of
your experiment, based on your knowledge and research
conducted.
 Your hypothesis should be a clear and simple statement. (Not
a question)
 It should only state what you think your results will be, not why
you think you will get those results.
 Example: “Bean plants will grow better in direct sunlight
than in indirect sunlight or shade.”
 It is understood that your hypothesis is an educated guess, so
it is unnecessary to say, “I think that” or “I believe” etc. in your
hypothesis.
 Use the words “if” and “then” to create your statement.
 Stated in the “If…..,
then….” format
 Example: IF I water
three plants with
different sodas,
THEN the plant that
receives Sprite will
grow the tallest.
A HYPOTHESIS is the same
thing as a prediction. It is an
EDUCATED GUESS or what you
think is going to happen in
your experiment.
Example: I think
that the metal
items will be the
best conductors of
electricity.
You need to give a reason why
your hypothesis is correct.
Example: …..because
metal is used in wires in my
home.
The next step scientists
take is to create and
conduct an experiment to
test their hypothesis.
What is data?
It is information
gathered during
an experiment.
It is organized
into a data table
and displayed
visually as a
graph.
Graphs
 BAR GRAPHS: can be used to
show how something changes
over time or to compare items.
 have an x-axis (horizontal)
and a y-axis (vertical)
 the x-axis has time period or
what is being measured
 the y-axis has numbers for
the amount of stuff being
measured.
 good when you're plotting
data that spans many years
(or days, weeks...), has really
big changes from year to
year (or day to day...), or when
you are comparing things.
 LINE GRAPHS: can be used
to show how something
changes over time
 x-axis has numbers for the
time period
 y-axis has numbers for
what is being measured.
 can be used when you're
plotting data that has peaks
(ups) and valleys (downs),
or that was collected in a
short time period.
 Used for two sets of
numerical data (ex: time
and temp)
 1. Choose a problem: State the problem
as a question.
 2. Research your problem: Read, get
advice, and make observations.
 3. Develop a hypothesis: Make a
prediction about what will happen.
 4. Design an experiment: Plan how you
will test your hypothesis.
Steps of the Scientific Method
 5. Test your hypothesis: Conduct
the experiment and record the data.
 6. Organize your data: Create a
chart or graph of your data.
 7. Draw conclusions: Analyze your
data and summarize your findings.
 Develop a procedure to test your hypothesis.
 It is important to list and have all materials needed to
conduct the experiment properly.
 Accurate measurements must be taken to ensure valid
experimental results.
 Be sure to address safety concerns, and take all
precautions necessary to ensure your experiment is safe
to complete.
 Write a procedure to follow, number each step so that others
are able to repeat your experiment by reading the procedure.
 Control your variables
 A variable is anything that can change during an experiment. So
each time you test everything should be the same except the one
variable that you are testing.
 Independent Variable (IV): The variable that is controlled or
manipulated by the experimenter.
 Dependent Variable (DV): The variable that is measured by the
experimenter.
 Control Group (CG): The group that is not exposed to the independent
variable.
 Here is an easier way to visualize the concept of
the independent and dependent variable
relationship.
Independent Variable Dependent Variable
Manipulated Measured
Cause Effect
Before After
Input Output
What you do What happens
 A group of students were given a short course in speed-reading.
The instructor wondered if a monetary incentive would
influence performance on a reading test taken at the end of the
course. Half the students were offered $5 for obtaining a certain
level of performance on the test, the other half were not offered
money.
 Independent Variable (IV): Monetary incentive ($5 or no money).
(This is the manipulated variable.)
 Dependent Variable (DV): Performance on reading test. (This is the
variable that can be measured by the experiment.)
 Control Group (CG): $0, no monetary incentive group. (This group
was not affected by the IV.)
 A researcher is studying the effect of sleep on aggression,
thinking that less sleep will lead to more aggression. She
has some people sleep 6 hours per night, some people
sleep 3 hours per night and some people sleep as much as
they want. She then monitors aggressive behavior during
basketball games among participants.
• Independent Variable (IV): Letting some people sleep only 3 hours,
and others only 6 hours. The researcher manipulates this variable.
• Dependent Variable (DV): Aggression (or aggressive behavior). The
experimenter is monitoring (i.e., measuring) aggressive behavior.
• Control Group (CG): The people that got to sleep as much as they
wanted. This is the group that was not exposed to the independent
variable.
 Record the results of the experiment.
 This is done in a data table or chart.
 Organize data well so that finding results and trends
is easier.
 Take thorough and accurate measurements during
the experiment so that the data is valid.
 Find associations and trends in your data. Make
connections about the experiment and your
results.
 Compare the hypothesis to the experiments
conclusion.
 State if you proved or disproved your hypothesis.
 Name any errors that could have been made
during the experiment or results that could have
affected your outcome.
Identifying
Variables
Independent Variables
Dependent Variables
Controlled Variables (Constants)
Independent
Variable –
something that is
changed by the
scientist
What is tested
What is
manipulated
(changed)
3 Kinds of Variables
Dependent Variable – something
that might be affected by the change
in the independent variable
 What is observed
 What is measured
 The data collected during the
investigation
 “the numbers”
 Example: how tall the plant grew, how
far the paper airplane flew
Example:
Controlled Variable – a variable
that is not changed
Also called CONSTANTS
Allow for a “fair test”
Everything in the experiment
except for the IV should be kept
constant
 Give a detailed explanation of how you will
conduct the experiment to test your hypothesis
 Be clear about the variables (elements you
change) versus your constants (elements that
do not change)
 A control is the group that you use as a
comparison to see if change has occurred.
 Example: In a medicine study, the group of
people who don’t get the medicine are the
control group
Procedure
 Be very specific about how you
will measure results to prove
or disprove your hypothesis.
You should include a regular
timetable for measuring
results or observing the
projects (such as every hour,
every day, every week)
 Conclusion: your results or findings based
on data collected during the experiment
 Answer your problem/purpose statement
 What does it all add up to? What is the
value of your project?
 What further study do you recommend
given the results of your experiment? What
would be the next question to ask?
 If you repeat this project, what would you
change?
Conclusion
For Example:
Students of different ages were
given a jigsaw puzzle to put
together. The scientist wanted to
see if the students’ ages affected
how long it took to put the puzzle
together.
Independent Variable (IV):
Ages of the students
Different ages were tested by the scientist
Dependent Variable (DV):
The time it took to put the puzzle
together
The time was observed and measured by
the scientist
Identify the Variables in this
Experiment:
 (1) Same puzzle
 All of the participants were tested with
the same puzzle.
 It would not have been a fair test if
some had an easy 30 piece puzzle and
some had a harder 500 piece puzzle.
 Other constants: (2) same location, (3)
same stopwatch, (4) same person
timing the experiment
What were the constants?
 An investigation was done with an
electromagnetic system made from a
battery and wire wrapped around a nail.
Different sizes of nails were used. The
number of paper clips the
electromagnet could pick up was
measured.
Another Example:
IV: Sizes of nails
These were changed by the scientist
DV: Number of paper clips picked up
The number of paper clips observed
and counted (measured)
Constants: Battery, wire, type of nail
None of these items were changed
What are the Variables?
Let’s Practice!
If I use a heavier bowling
ball, then the ball will
travel faster down the
lane.
IV: weight of bowling ball
DV: speed it traveled
down lane
 2) If I use different brands
of paper towels, then
Bounty will absorb more
water per minute than
Sparkle or Quilted.
 IV: brand of paper towel
 DV: amount of water
absorbed per minute
3) If I put 3 spider plants in
different locations, then the
plant in the sunlight will
grow taller in a one-week
period than the plants in the
closet and basement.
IV: location of the plants
DV: height of plants
•Fact: In science, an observation that has been repeatedly
confirmed and for all practical purposes is accepted as
“true.” Truth in science, however, is never final and what is
accepted as a fact today may be modified or even
discarded tomorrow.
•Hypothesis: A tentative statement about the natural
world leading to deductions (assumption) that can be
tested. If the deductions are verified, the hypothesis is
provisionally verified. If the deductions are incorrect, the
original hypothesis is proved false and must be
abandoned or modified. Hypotheses can be used to build
more complex inferences (suggestions/conclusion) and
explanations.
•Law: A descriptive generalization about
how some aspect of the natural world
behaves under stated circumstances.
•Theory: In science, a well-substantiated
(verified) explanation of some aspect of
the natural world that can incorporate
facts, laws, inferences, and tested
hypotheses.
•Fact: Observations about the world around us. A fact is an event or
thing that is definitely known to have happened, to exist, and to be
true. Facts are based on experience and scientific evidence. Example:
“It’s bright outside.”
•Hypothesis: A proposed explanation for a phenomenon made as a
starting point for further investigation. hypothesis is a proposed
explanation for the occurrence of a phenomenon. Scientists formulate
hypotheses as statements and then test them through experiments and
other forms of research. Hypotheses are developed using logic,
inference, and mathematical arguments in order to explain observed
phenomena. However, it must always be possible to refute a scientific
hypothesis. Example: “It’s bright outside because the sun is probably
out.”
Theory: A well-substantiated explanation acquired through the
scientific method and repeatedly tested and confirmed through
observation and experimentation. A theory is a broader conception
that refers to a set of explanations, rules, and laws. These are
supported by a large body of observational and experimental
evidence, all leading to robust conclusions. It is important to note
that the term 'theory' is used differently in science than in common
language. What people generally mean then they say they have a
'theory' is that they have an idea. This most closely resembles a
scientific hypothesis. In science, theories are widely supported and
accepted. The following are some of the most famous theories in
science:
•the theory of gravitation, first proposed by Isaac Newton (1642-
1727)
•Example: “When the sun is out, it tends to make it bright outside.”
•Law: A statement based on repeated experimental observations that
describes some phenomenon of nature. Proof that something happens
and how it happens, but not why it happens. Example:
Newton’s Law of Universal Gravitation.

Scientific_Method_ FINAL PPT.pptbwjsjsbsbs

  • 1.
  • 2.
    The Scientific Method Whatis the scientific method? It is a process that is used to find answers to questions about the world around us. A logical organized way of solving problem
  • 3.
    •It is thesteps someone takes to identify a question, develop a hypothesis, design and carry out steps or procedures to test the hypothesis, write down data, and draw a conclusion. •In other words, it’s a way to solve a problem.
  • 4.
    Scientists take timeto think logically when they are investigating a question or problem. They break things down into many steps that make sense.
  • 5.
     Is thereonly one “scientific method”?  No, there are several versions of the scientific method.  Some versions have more steps, while others may have only a few.  However, they all begin with the identification of a problem or a question to be answered based on observations of the world around us.
  • 6.
    They provide an organized methodfor conducting and analyzing an experiment.
  • 7.
     What isa hypothesis?  It is an educated guess based on observations and your knowledge of the topic.  You state it as a possible answer to a question.
  • 8.
     A hypothesisis an educated guess about the outcome of your experiment, based on your knowledge and research conducted.  Your hypothesis should be a clear and simple statement. (Not a question)  It should only state what you think your results will be, not why you think you will get those results.  Example: “Bean plants will grow better in direct sunlight than in indirect sunlight or shade.”  It is understood that your hypothesis is an educated guess, so it is unnecessary to say, “I think that” or “I believe” etc. in your hypothesis.  Use the words “if” and “then” to create your statement.
  • 9.
     Stated inthe “If….., then….” format  Example: IF I water three plants with different sodas, THEN the plant that receives Sprite will grow the tallest.
  • 10.
    A HYPOTHESIS isthe same thing as a prediction. It is an EDUCATED GUESS or what you think is going to happen in your experiment. Example: I think that the metal items will be the best conductors of electricity.
  • 11.
    You need togive a reason why your hypothesis is correct. Example: …..because metal is used in wires in my home.
  • 12.
    The next stepscientists take is to create and conduct an experiment to test their hypothesis.
  • 13.
    What is data? Itis information gathered during an experiment. It is organized into a data table and displayed visually as a graph.
  • 14.
    Graphs  BAR GRAPHS:can be used to show how something changes over time or to compare items.  have an x-axis (horizontal) and a y-axis (vertical)  the x-axis has time period or what is being measured  the y-axis has numbers for the amount of stuff being measured.  good when you're plotting data that spans many years (or days, weeks...), has really big changes from year to year (or day to day...), or when you are comparing things.
  • 15.
     LINE GRAPHS:can be used to show how something changes over time  x-axis has numbers for the time period  y-axis has numbers for what is being measured.  can be used when you're plotting data that has peaks (ups) and valleys (downs), or that was collected in a short time period.  Used for two sets of numerical data (ex: time and temp)
  • 16.
     1. Choosea problem: State the problem as a question.  2. Research your problem: Read, get advice, and make observations.  3. Develop a hypothesis: Make a prediction about what will happen.  4. Design an experiment: Plan how you will test your hypothesis. Steps of the Scientific Method
  • 17.
     5. Testyour hypothesis: Conduct the experiment and record the data.  6. Organize your data: Create a chart or graph of your data.  7. Draw conclusions: Analyze your data and summarize your findings.
  • 19.
     Develop aprocedure to test your hypothesis.  It is important to list and have all materials needed to conduct the experiment properly.  Accurate measurements must be taken to ensure valid experimental results.  Be sure to address safety concerns, and take all precautions necessary to ensure your experiment is safe to complete.
  • 20.
     Write aprocedure to follow, number each step so that others are able to repeat your experiment by reading the procedure.  Control your variables  A variable is anything that can change during an experiment. So each time you test everything should be the same except the one variable that you are testing.  Independent Variable (IV): The variable that is controlled or manipulated by the experimenter.  Dependent Variable (DV): The variable that is measured by the experimenter.  Control Group (CG): The group that is not exposed to the independent variable.
  • 21.
     Here isan easier way to visualize the concept of the independent and dependent variable relationship. Independent Variable Dependent Variable Manipulated Measured Cause Effect Before After Input Output What you do What happens
  • 22.
     A groupof students were given a short course in speed-reading. The instructor wondered if a monetary incentive would influence performance on a reading test taken at the end of the course. Half the students were offered $5 for obtaining a certain level of performance on the test, the other half were not offered money.  Independent Variable (IV): Monetary incentive ($5 or no money). (This is the manipulated variable.)  Dependent Variable (DV): Performance on reading test. (This is the variable that can be measured by the experiment.)  Control Group (CG): $0, no monetary incentive group. (This group was not affected by the IV.)
  • 23.
     A researcheris studying the effect of sleep on aggression, thinking that less sleep will lead to more aggression. She has some people sleep 6 hours per night, some people sleep 3 hours per night and some people sleep as much as they want. She then monitors aggressive behavior during basketball games among participants. • Independent Variable (IV): Letting some people sleep only 3 hours, and others only 6 hours. The researcher manipulates this variable. • Dependent Variable (DV): Aggression (or aggressive behavior). The experimenter is monitoring (i.e., measuring) aggressive behavior. • Control Group (CG): The people that got to sleep as much as they wanted. This is the group that was not exposed to the independent variable.
  • 24.
     Record theresults of the experiment.  This is done in a data table or chart.  Organize data well so that finding results and trends is easier.  Take thorough and accurate measurements during the experiment so that the data is valid.  Find associations and trends in your data. Make connections about the experiment and your results.
  • 25.
     Compare thehypothesis to the experiments conclusion.  State if you proved or disproved your hypothesis.  Name any errors that could have been made during the experiment or results that could have affected your outcome.
  • 26.
  • 27.
    Independent Variable – something thatis changed by the scientist What is tested What is manipulated (changed) 3 Kinds of Variables
  • 28.
    Dependent Variable –something that might be affected by the change in the independent variable  What is observed  What is measured  The data collected during the investigation  “the numbers”  Example: how tall the plant grew, how far the paper airplane flew
  • 29.
  • 30.
    Controlled Variable –a variable that is not changed Also called CONSTANTS Allow for a “fair test” Everything in the experiment except for the IV should be kept constant
  • 31.
     Give adetailed explanation of how you will conduct the experiment to test your hypothesis  Be clear about the variables (elements you change) versus your constants (elements that do not change)  A control is the group that you use as a comparison to see if change has occurred.  Example: In a medicine study, the group of people who don’t get the medicine are the control group Procedure
  • 32.
     Be veryspecific about how you will measure results to prove or disprove your hypothesis. You should include a regular timetable for measuring results or observing the projects (such as every hour, every day, every week)
  • 33.
     Conclusion: yourresults or findings based on data collected during the experiment  Answer your problem/purpose statement  What does it all add up to? What is the value of your project?  What further study do you recommend given the results of your experiment? What would be the next question to ask?  If you repeat this project, what would you change? Conclusion
  • 34.
    For Example: Students ofdifferent ages were given a jigsaw puzzle to put together. The scientist wanted to see if the students’ ages affected how long it took to put the puzzle together.
  • 35.
    Independent Variable (IV): Agesof the students Different ages were tested by the scientist Dependent Variable (DV): The time it took to put the puzzle together The time was observed and measured by the scientist Identify the Variables in this Experiment:
  • 36.
     (1) Samepuzzle  All of the participants were tested with the same puzzle.  It would not have been a fair test if some had an easy 30 piece puzzle and some had a harder 500 piece puzzle.  Other constants: (2) same location, (3) same stopwatch, (4) same person timing the experiment What were the constants?
  • 37.
     An investigationwas done with an electromagnetic system made from a battery and wire wrapped around a nail. Different sizes of nails were used. The number of paper clips the electromagnet could pick up was measured. Another Example:
  • 38.
    IV: Sizes ofnails These were changed by the scientist DV: Number of paper clips picked up The number of paper clips observed and counted (measured) Constants: Battery, wire, type of nail None of these items were changed What are the Variables?
  • 39.
    Let’s Practice! If Iuse a heavier bowling ball, then the ball will travel faster down the lane. IV: weight of bowling ball DV: speed it traveled down lane
  • 40.
     2) IfI use different brands of paper towels, then Bounty will absorb more water per minute than Sparkle or Quilted.  IV: brand of paper towel  DV: amount of water absorbed per minute
  • 41.
    3) If Iput 3 spider plants in different locations, then the plant in the sunlight will grow taller in a one-week period than the plants in the closet and basement. IV: location of the plants DV: height of plants
  • 42.
    •Fact: In science,an observation that has been repeatedly confirmed and for all practical purposes is accepted as “true.” Truth in science, however, is never final and what is accepted as a fact today may be modified or even discarded tomorrow. •Hypothesis: A tentative statement about the natural world leading to deductions (assumption) that can be tested. If the deductions are verified, the hypothesis is provisionally verified. If the deductions are incorrect, the original hypothesis is proved false and must be abandoned or modified. Hypotheses can be used to build more complex inferences (suggestions/conclusion) and explanations.
  • 43.
    •Law: A descriptivegeneralization about how some aspect of the natural world behaves under stated circumstances. •Theory: In science, a well-substantiated (verified) explanation of some aspect of the natural world that can incorporate facts, laws, inferences, and tested hypotheses.
  • 44.
    •Fact: Observations aboutthe world around us. A fact is an event or thing that is definitely known to have happened, to exist, and to be true. Facts are based on experience and scientific evidence. Example: “It’s bright outside.” •Hypothesis: A proposed explanation for a phenomenon made as a starting point for further investigation. hypothesis is a proposed explanation for the occurrence of a phenomenon. Scientists formulate hypotheses as statements and then test them through experiments and other forms of research. Hypotheses are developed using logic, inference, and mathematical arguments in order to explain observed phenomena. However, it must always be possible to refute a scientific hypothesis. Example: “It’s bright outside because the sun is probably out.”
  • 45.
    Theory: A well-substantiatedexplanation acquired through the scientific method and repeatedly tested and confirmed through observation and experimentation. A theory is a broader conception that refers to a set of explanations, rules, and laws. These are supported by a large body of observational and experimental evidence, all leading to robust conclusions. It is important to note that the term 'theory' is used differently in science than in common language. What people generally mean then they say they have a 'theory' is that they have an idea. This most closely resembles a scientific hypothesis. In science, theories are widely supported and accepted. The following are some of the most famous theories in science: •the theory of gravitation, first proposed by Isaac Newton (1642- 1727) •Example: “When the sun is out, it tends to make it bright outside.” •Law: A statement based on repeated experimental observations that describes some phenomenon of nature. Proof that something happens and how it happens, but not why it happens. Example: Newton’s Law of Universal Gravitation.

Editor's Notes