Downloaded 177 times
![What is R
§ R is a programming language and software
environment for statistical computing and graphics.
The R language is widely used among statisticians
and data miners for developing statistical software[2]
[3] and data analysis.
8](https://image.slidesharecdn.com/workshop3rnaseqr-170315174539/75/RNA-Seq-with-R-Bioconductor-8-2048.jpg)


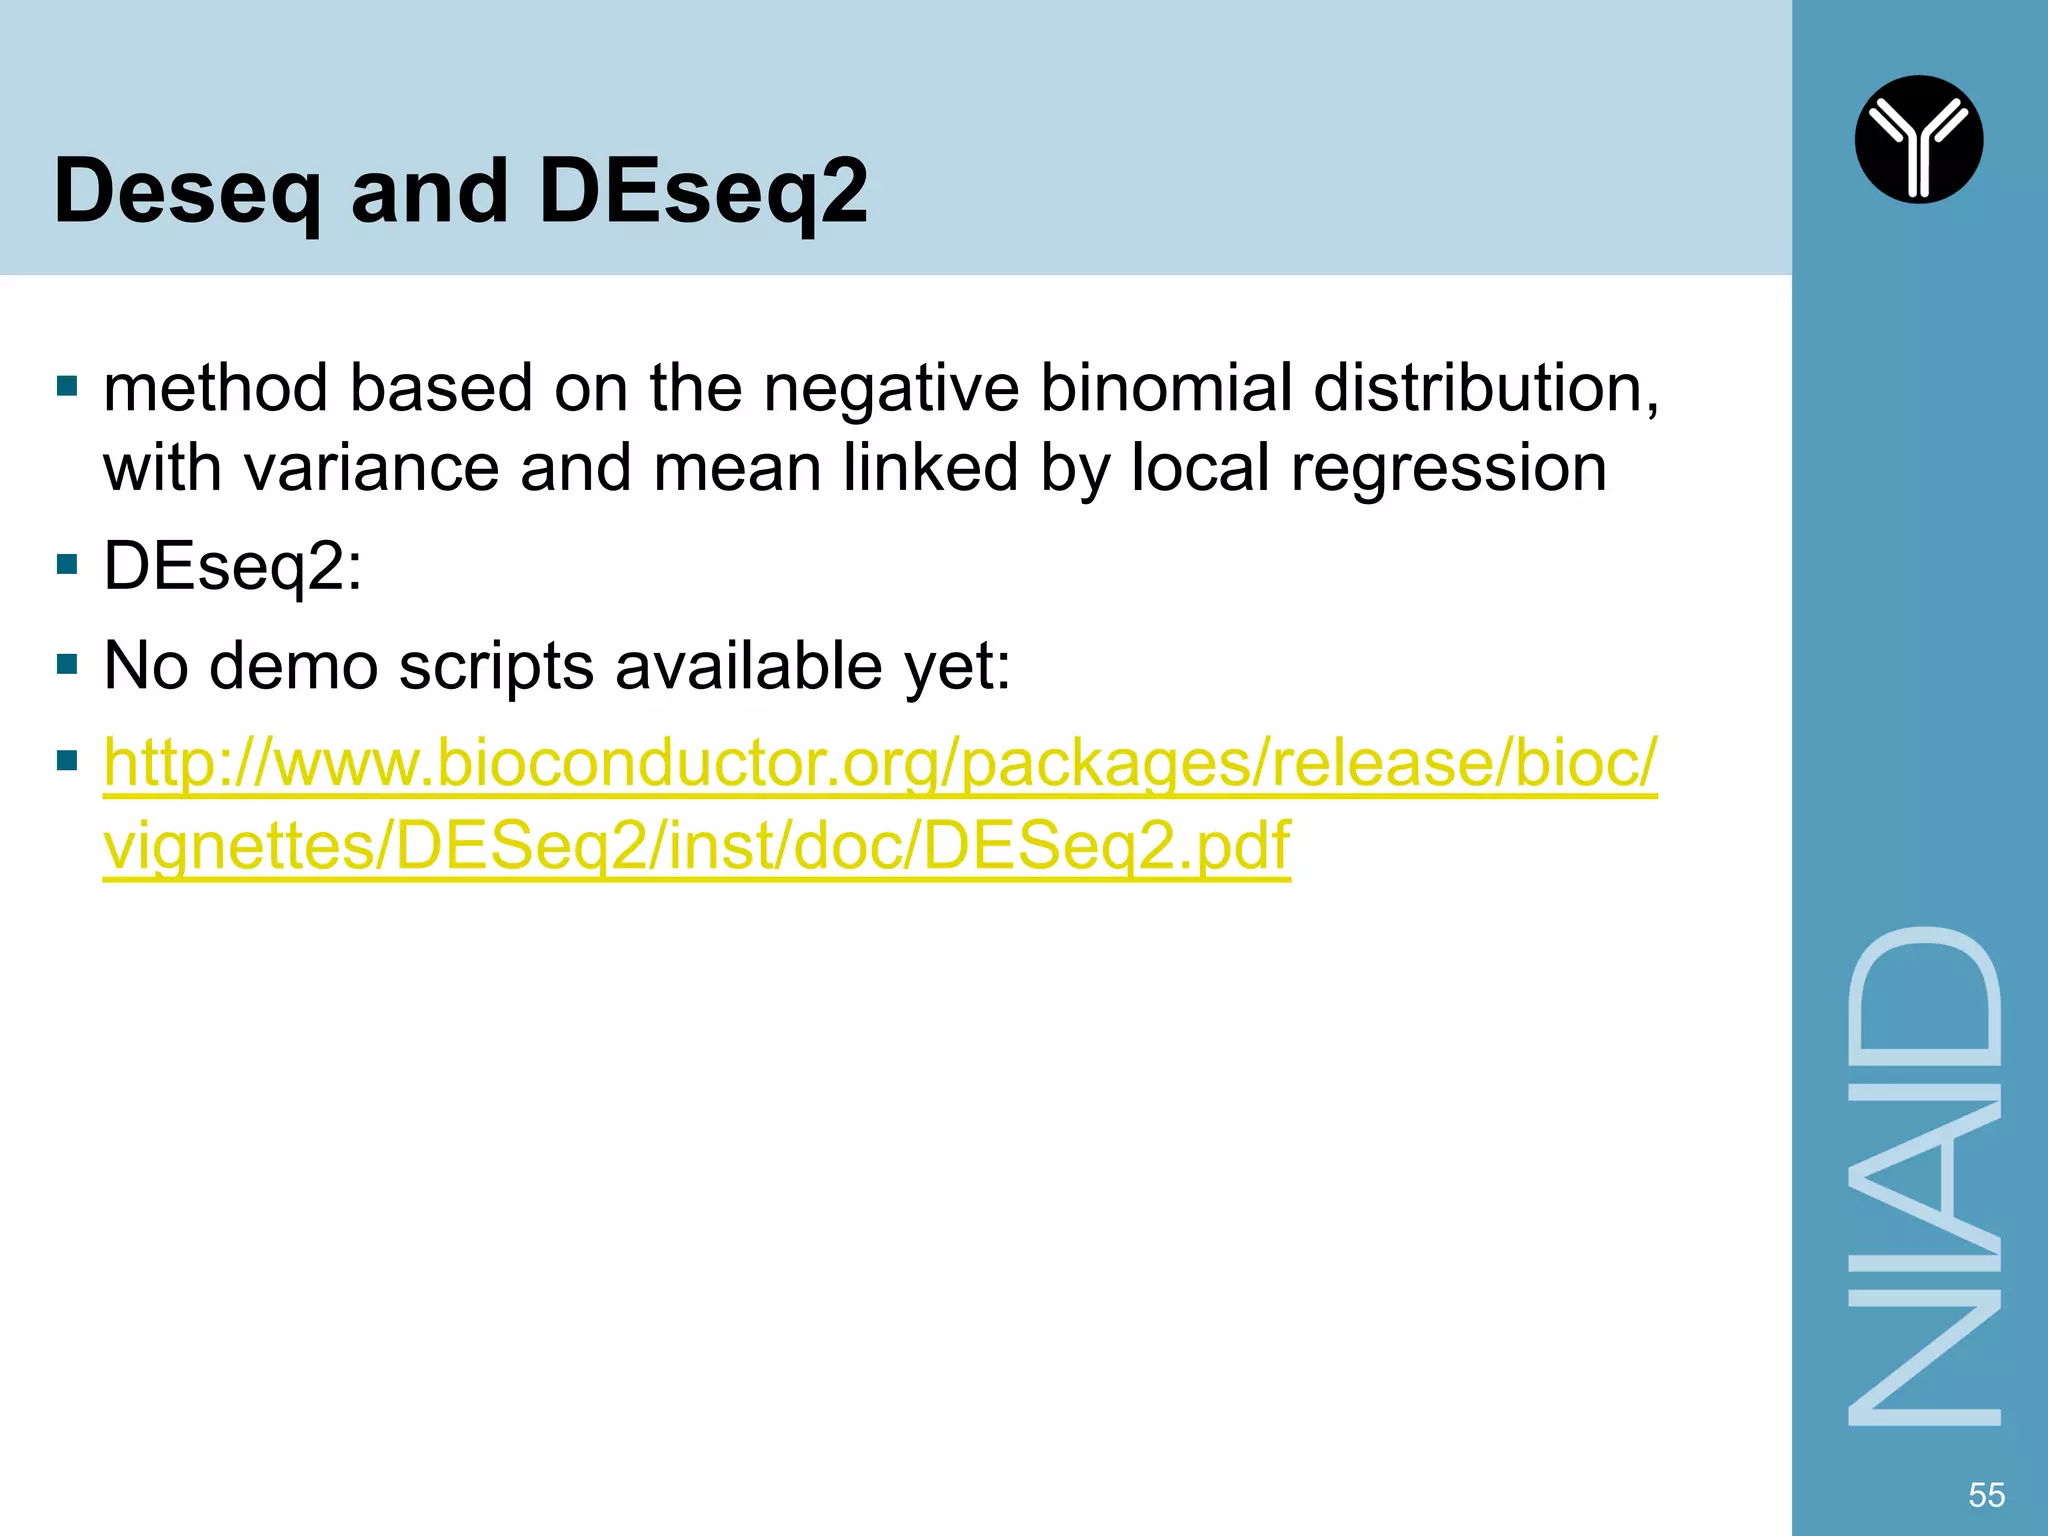
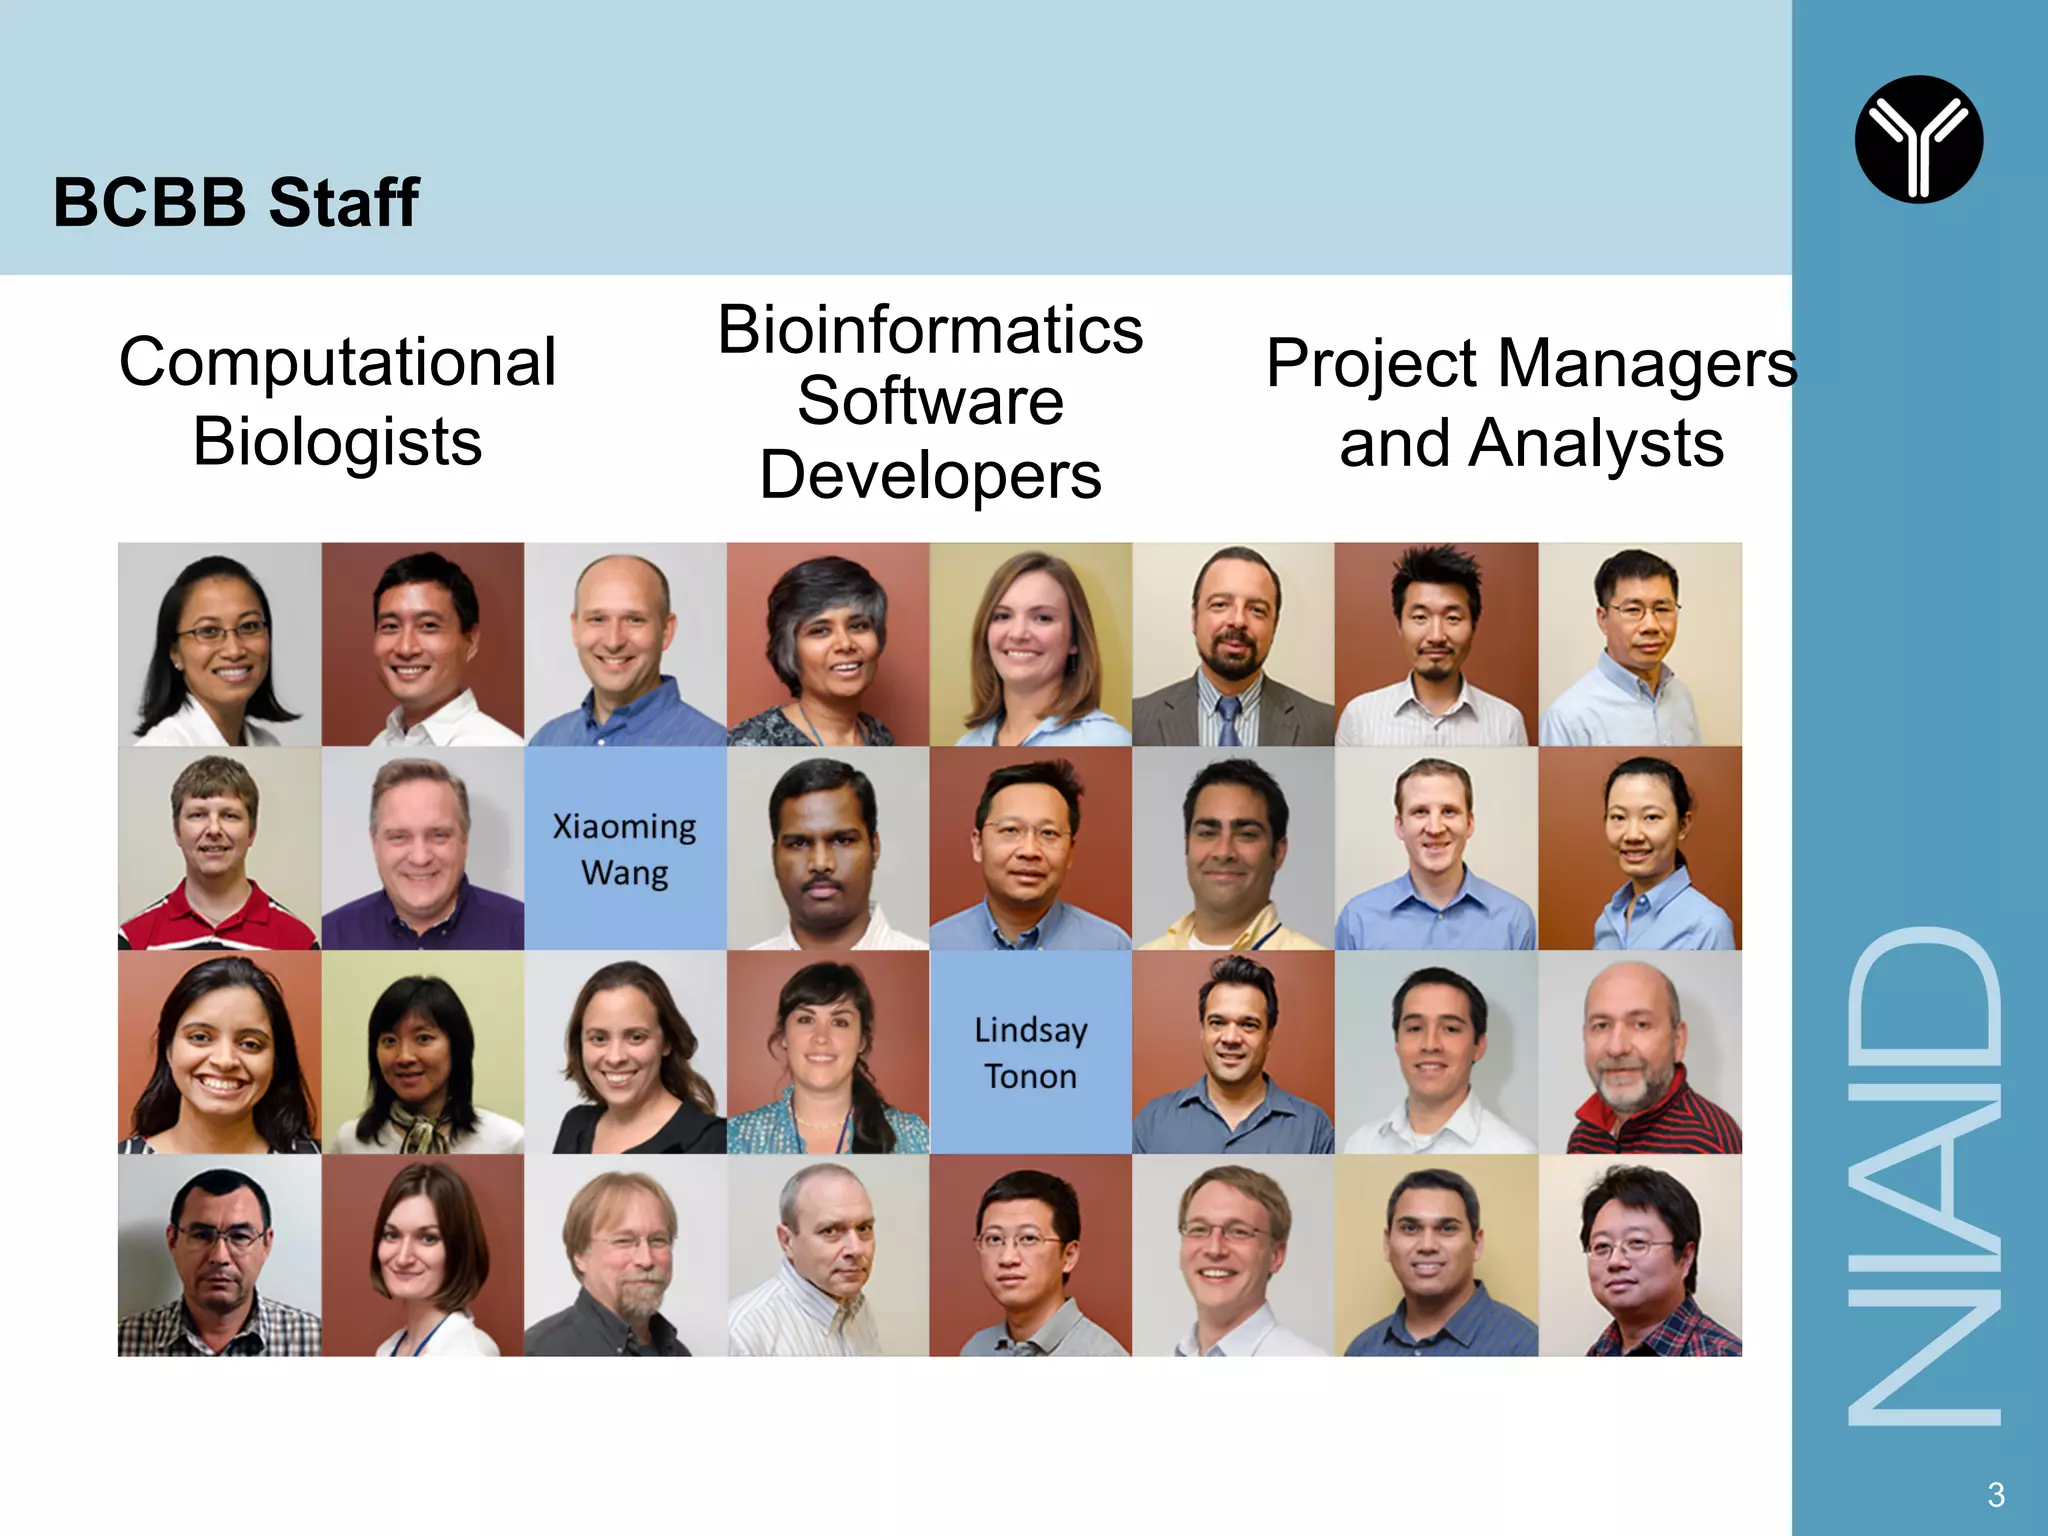
The document provides information about RNA-seq analysis using R and Bioconductor. It begins with an introduction to the BCBB branch and its services assisting researchers with bioinformatics and computational projects. The document then discusses RNA-seq, R, and Bioconductor individually before explaining how they can be used together for RNA-seq analysis. Step-by-step tutorials and resources are provided for differential expression analysis and other tasks using R packages like DESeq2.