
Downloaded 16 times
![Crash Course: Better Graphics in R
11
commands from the Hmisc package library. Similarly, the functions spss.get() and read.spss() from the
package libraries Hmisc and foreign, respectively, can both be used to open SPSS data files (.sav file
extension) in R. The command stata.get() from the Hmisc package library can be used to import Stata
datasets into R, etc. Data sets from most commercial statistics software packages can be imported directly.
1.8 Basic Manipulation of Data
There are a many ways to manipulate data sets in R, but some methods will be crucial to the rest of this
manual. Specifically, users will need to be able to call specific columns, rows and variables from the data tables
they have stored in R using the import methods described above.
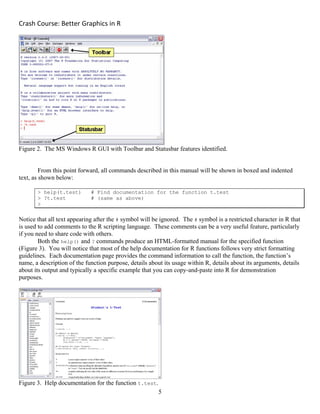
1.8.1 Indexing
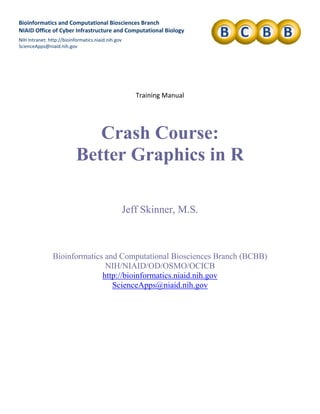
One of the most important concepts in R is the idea of indexing, because it applies to so many types of R
objects. Vectors, matrices, data frames, arrays and lists can all be indexed using similar command notations.
The index of an R object refers to the specific location of a value in a vector, matrix, array, data frame or list.
You can generalize this concept by thinking of the index as the row and column number of any value entry in a
spreadsheet, but remember that some R objects can have more than two dimensions or fewer than two
dimensions. Here are some examples:
> # Report the third entry from a vector of length = 6
> Vector[3]
[1] 53
> # Report the entry from the 2nd row and 5th column of a matrix
> Matrix[2,5]
[1] 49
> # Report the 3rd row, 2nd column and 2nd panel of an array
> Array[3,2,2]
[1] 49
> # Report the 3rd row, 2nd column and 'Female' gender of a table
> Table[3,2,"Female"]
[1] 4
> # Report the 1st entry of the 1st column from AFP
> AFP[1,1]
[1] 1
Generally, you refer to an indexed entry of an R object by adding square brackets after the objects name
(e.g. Vector[3] refers to the 3rd
entry of the object Vector). The dimensions of an object are separated by
commas (e.g. Matrix[2,5] refers to the 2nd
row and 5th
column of the object Matrix). If the dimensions of an
object are named instead of numbered, then those dimensions can be specified with a quoted character string
(e.g. specify the "Female" of the gender dimension). The examples above use indexing to report single values
from vectors, matrices, arrays, tables, data frames and lists, but an index can be used in more complicated ways.
> # Rows 2-3 and columns 1, 2 and 6 of a matrix
> Matrix[2:3,c(1,2,6)]
[,1] [,2] [,3]
[1,] 49 45 46
[2,] 45 56 51](https://image.slidesharecdn.com/bettergraphicsinrmanual-170503184421/85/Better-graphics-in-R-11-320.jpg)
![Crash Course: Better Graphics in R
12
> # Overwrite one value from a matrix
> Matrix[3,3] <- NA> Matrix
[,1] [,2] [,3] [,4] [,5] [,6]
[1,] 49 54 49 47 57 53
[2,] 49 45 50 50 49 46
[3,] 45 56 NA 52 46 51
[4,] 47 46 48 48 55 48
> # Identify observations with % Body fat less than 10%
> AE[Percent.Body.Fat <= 10,]
Region Gender Severity Age Weight Percent.Body.Fat
2 Southwest Male Mild 34 148.5672 7
30 Southwest Male Mild 36 155.3823 8
49 Midwest Male Moderate 34 151.3767 9
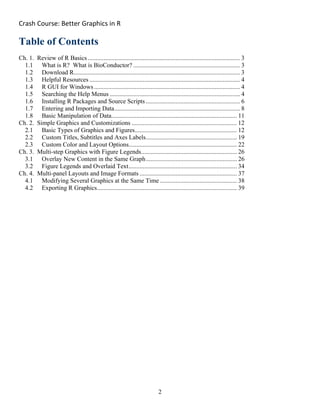
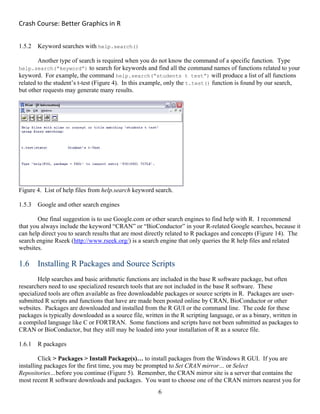
A sequence of row or column numbers can be entered into an index to view more than one row or
column from a data table. These sequences can be entered using colon symbol notation (e.g. 1:5) or the
combine function (e.g. c(1,4,7)) and other methods. The individual indexed values of a matrix, array or data
frame can be overwritten without affecting any other values in the matrix, array or data frame. Sequences of
row numbers or column numbers can be generated with an inequality or conditional statement to find special
subsets of data (e.g. all patients with Percent.Body.Fat <= 10%). Indexing is a very powerful tool within R.
Indexing will be using in many of these examples.
1.8.2 Column references and attach()
Indexing can be a great way to create, view or modify subsets of your data, but often it might be more
helpful to refer to specific columns, or variables, within a large data frame. We can also call a specific column
of a data frame using the reserved dollar sign symbol (e.g. AE$Gender yields the gender column of the AE data
set). Column references can be simplified using the attach() command to “attach” a specific data frame or list
to the current R workspace. Once the object has been attached to the workspace, individual variables or list
items can be called by name (e.g. After using attach(), Gender will be a new variable in your workspace).
Ch. 2. Simple Graphics and Customizations
2.1 Basic Types of Graphics and Figures
You can use R to produce dozens or hundreds of different kinds of graphics and figures. Many popular
types of graphs, like pie charts and histograms, have their own dedicated commands and procedures in the
graphics package library. Other types of graphs, like multifactor XY scatterplots, are most easily produced
using multiple commands from general graphing utilities, like plot() and legend(). Often, specialized
package libraries will include graphics commands that can help streamline the graphing process. Other graphs
can only be produced in the context of the appropriate statistical analysis. Several simple examples are
provided below.
2.1.1 Pie charts
Pie charts are used to quickly display the frequencies of each outcome of a single categorical variable.
The relative size of each slice of the pie chart represents the relative frequency of its respective outcome in the
sample. For example, we could use a pie chart to examine the proportion of samples from each iris species in](https://image.slidesharecdn.com/bettergraphicsinrmanual-170503184421/85/Better-graphics-in-R-12-320.jpg)
![Crash Course: Better Graphics in R
14
as.factor() command. Also notice, in the second pie chart, that the col parameter was left undefined and R
automatically generated the color choices for each of the 18 adverse event slices.
2.1.2 Histograms
Histograms are used to quickly display the distribution of a single continuous numeric variable. Often
researchers want to determine if a variable might be normally distributed or non-normally distributed. Other
researchers want to estimate descriptive statistics like means, medians, variances or ranges. A key issue in the
construction of a histogram is the choice of the histogram “bins” or groupings. If too many bins are used, the
true shape of the distribution will be lost because the histogram will be too sparse, but if too few bins are used,
the true shape of the distribution will be lost because the bins are too dense to remain informative. The location
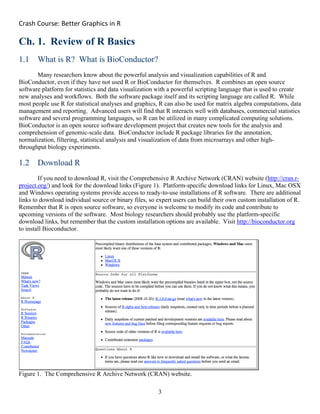
of the bin mid points and break points can also be important to the shape of the histogram. The importance of
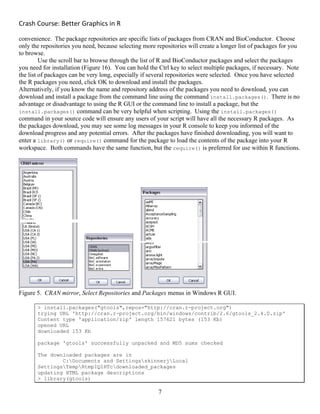
binning is shown in two histograms of the height measurements from the AFP dataset shown below (Figure 8
and Figure 9).
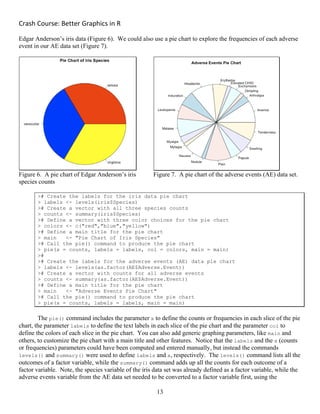
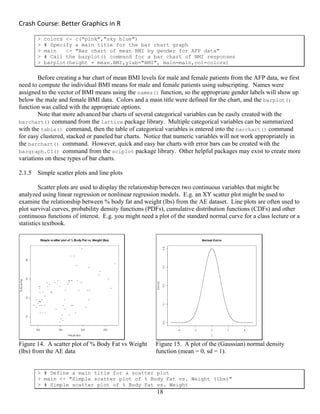
Figure 8. A histogram of height from the AFP data
set with default number of bins.
Figure 9. A histogram of BMI from the AFP data set
with a larger number of bins.
> # Define a vector of BMI data
> height <- as.numeric(afp.data[,3])
> # Define a main title for the histogram
> main <- "Histogram of height from AFP data"
> # Call the hist() command to produce the histogram
> hist(x=height,xlab="height (inches)",main=main,col="wheat")
> # Call hist() command with extra breaks for a second histogram
> hist(x=height,breaks=30,xlim=c(15,45),...)
The hist() command includes many parameter options. The parameter x must be specified, to identify
the sample of continuous data displayed in the histogram. The breaks parameter specifies the number of bins
used in the histogram. The number of histogram bins can be specified using one of three automated binning
algorithm choices (i.e. “Sturges”, “Scott” or “Freedman-Diaconis”), a single number (i.e. breaks = 30 will
produce 31 bins), a vector of specific break points or a formula. In the first histogram, the default “Sturges”
method produced a histogram with six bins, which appears to show a normal distribution. In the second
histogram, the command breaks = 30 specified that 31 bins should be used, and the resulting histogram was](https://image.slidesharecdn.com/bettergraphicsinrmanual-170503184421/85/Better-graphics-in-R-14-320.jpg)
![Crash Course: Better Graphics in R
15
sparse and uninformative. The command xlab specifies the label for the x-axis. As before, the commands
main and col specify the main title and the color of the plotted bars, respectively.
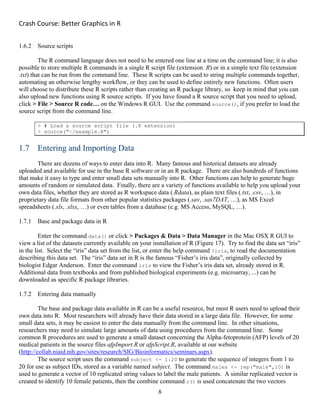
2.1.3 Box plots
Box plots are an alternative to the histogram for researchers who want to quickly summarize the
distribution of continuous numeric variables. Box plots were introduced by statistician John Tukey in his
historic book Exploratory Data Analysis (Tukey 1977). The box plot is a graphical representation of the five
number summary, where the central line in the box plot represents the median of a sample, the outer edges of
the box in the box plot represent the 25th
and 75th
percentiles of the sample and the whiskers of the box plot
represent the minimum and maximum of a sample. Alternate versions of the box plot often use dots or asterisks
to identify outliers beyond the whiskers, which might represent the 5th
and 95th
percentile of a distribution or the
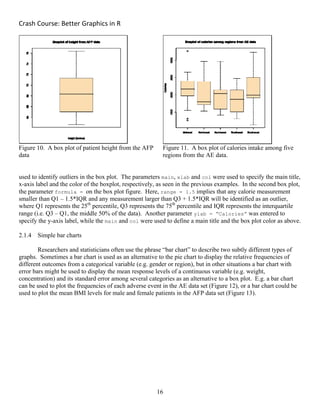
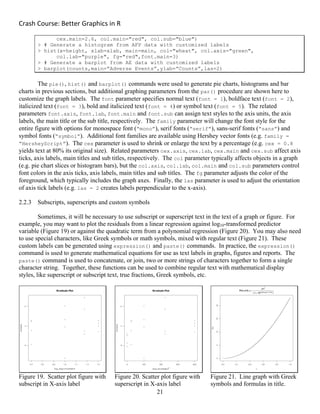
smallest and largest “non-outlier” values of a distribution. Generally, a single box plot (Figure 10) provides less
information about the shape of a distribution than an analogous histogram. For example, a box plot cannot be
used to identify a bimodal distribution of female and male heights, while a histogram can. However, box plots
are often more appropriate than histograms when researchers want to compare the distributions of several
samples in the same figure (Figure 11).
> # Define a vector of height data
> height <- as.numeric(afp.data[,3])
> # Define a main title for the boxplot
> main <- "Boxplot of height from AFP data"
> # Call boxplot() command for boxplot of height from AFP data
> boxplot(x=height,main=main,xlab=”height (inches)”,col=”wheat”)
> #
> # Call boxplot() command for boxplot of calories from AE data
> boxplot(formula=Calories~Region,data=AE,range=1.5,...)
The boxplot() function can be used in at least two different ways, with a single vector of continuous
data or with a formula to produce side-by-side box plots. A simple box plot of the height variable from the AFP
data set is produced using the boxplot() command with parameter x = height to specify a single vector of
numeric data for the Calories ~ Region was used to create a graph with side-by-side box plots of the calories
variable for each of the five regions of the categorical region variable. The parameter data = AE is used to
specify that we only want to use variables from the AE data set, which is why we could call the calories and
region variables with out defining them as vectors before the boxplot() command. The range parameter is](https://image.slidesharecdn.com/bettergraphicsinrmanual-170503184421/85/Better-graphics-in-R-15-320.jpg)
![Crash Course: Better Graphics in R
17
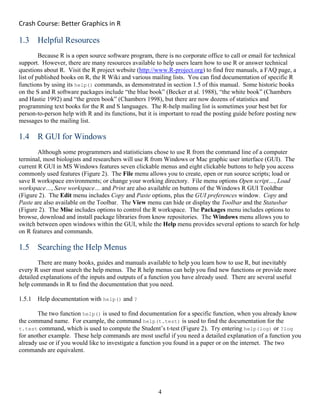
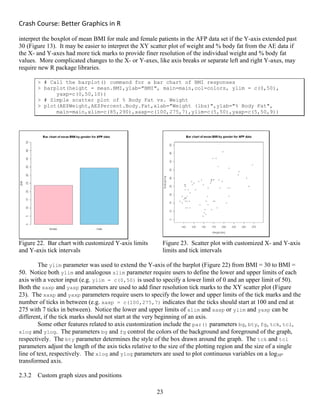
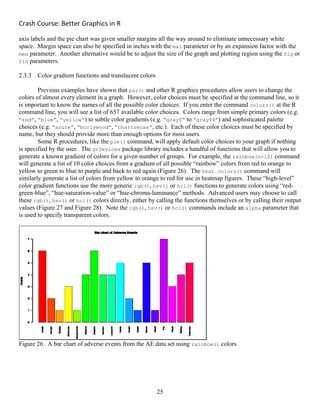
Figure 12. A bar chart of adverse events from the AE data set
Figure 13. A bar chart of female and male BMI from the AFP data set.
> # Create a vector of counts for the AE bar chart
> counts <- summary(AE$Adverse.Event)
> # Define a main title for the bar chart
> main <- "Bar chart of Adverse Events"
> # Call the barplot() command for a bar chart of adverse events
> barplot(height=counts,main=main,ylab=”Counts”)
> #
> # compute mean BMI for male and female patients from AFP data
> BMI.females <-mean(AFP[AFP$gender=="female",5])
> BMI.males <-mean(AFP[AFP$gender=="male",5])
> mean.BMI <- c(BMI.females,BMI.males)
> # define labels for female and male bars
> names(mean.BMI) <- levels(as.factor(AFP$gender))
> # Define colors for female and male bars](https://image.slidesharecdn.com/bettergraphicsinrmanual-170503184421/85/Better-graphics-in-R-17-320.jpg)
![Crash Course: Better Graphics in R
19
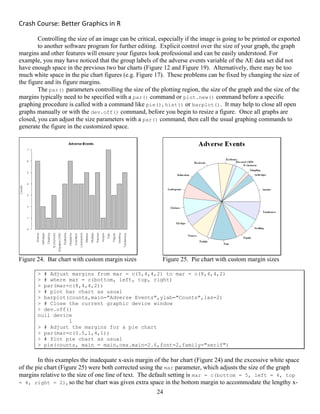
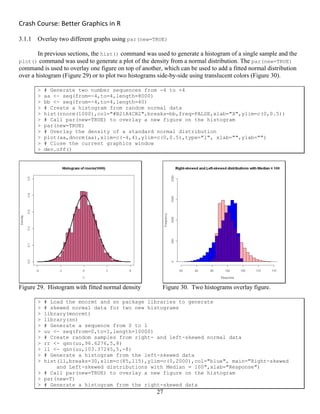
> plot(AE$Weight,AE$Percent.Body.Fat,xlab="Weight (lbs)",ylab="%
Body Fat",main=main)
> #
> # Define a continuous sequence Z ranging from -5 to +5
> Z <- seq(from=-5,to=5,length=8000)
> # Define a sequence representing the density of a normal curve
> fZ <- dnorm(Z)
> # Plot a normal curve
> plot(Z,fZ,type="l",ylab="Density",main="Normal Curve")
A main title was defined for the XY scatter plot of % body fat vs. weight (lbs) from the AE data, before
calling the plot() command with its xlab and ylab options to define the X- and Y-axis labels, respectively.
Since the probability density of a standard normal distribution is really a function f(x), two new variables Z and
fZ were defined to create a line plot of the standard normal density. First, the variable Z was defined as a
sequence of 8000 evenly spaced rational numbers from -5 to +5 using the sequence() command. Second, the
variable fZ was defined as a sequence of 8000 numbers resulting from the function f(x) using the dnorm()
command in R. Finally, a line plot was created from the plot() function by using the parameter type =”l”.
2.2 Custom Titles, Subtitles and Axes Labels
Most graphics procedures (e.g. pie(), hist(), plot(), ...) have some common parameters that allow
users to add specific text for the main titles, subtitles and axes labels. There are additional commands that allow
you to customize the look and feel of these labels for a more professional look. The following sections reveal
some helpful tips about customizing the labels on a graph.
2.2.1 Adding and removing groups from a factor variable
Take a close look at the pie chart (Figure 7) and bar chart (Figure 12) created from the adverse events of
the AE data. You may have noticed a possible typo in the data set, because the data contains two very similar
groups “myalgia” and “mylagia”. The “mylagia” group is a typo, but can it be removed from the plot?
> # Examine the 18 levels of the Adverse.Event variable
> AE$Adverse.Event
[1] Tenderness Arthralgia Mylagia Erythema Erythema Anemia
Anemia
...
[57] Nausea Headache Nodule Anemia Swelling
Leukopenia Elavated CH50
[64] Headache
18 Levels: Anemia Arthralgia Dimpling Ecchymosis Elavated CH50 Erythema Headache
Induration ... Tenderness
> # Store the list of variable names as a new variable
> new.labels <- levels(AE$Adverse.Event)
> # Verify the list still has 18 levels
> length(new.labels)
[1] 18
> # Use indexing to replace the “Mylagia” label with “Myalgia”
> new.labels[12] <- "Myalgia"
> # Assign these new labels to the levels of Adverse.Event
> levels(AE$Adverse.Event) <- new.labels
> # Verify Adverse.Event now has only 17 levels
> AE$Adverse.Event](https://image.slidesharecdn.com/bettergraphicsinrmanual-170503184421/85/Better-graphics-in-R-19-320.jpg)
![Crash Course: Better Graphics in R
20
[1] Tenderness Arthralgia Myalgia Erythema Erythema Anemia
Anemia
...
[57] Nausea Headache Nodule Anemia Swelling
Leukopenia Elavated CH50
[64] Headache
17 Levels: Anemia Arthralgia Dimpling Ecchymosis Elavated CH50 Erythema Headache
Induration ... Tenderness
> # Redefine the counts to create a pie chart
> counts <- summary(AE$Adverse.Event)
> # Generate a new pie chart of Adverse Events
> pie(x=counts,main=“Adverse Events”,sub=“Factor level typo ‘Mylagia’ has been
corrected”)
The first step of the process is to display the factor variable AE$Adverse.Event to view the number of
factor levels and their names. There are 18 levels, including both the levels “Myalgia” and “Mylagia”. Next,
the levels() command is used on the right-hand side of the assignment arrow to define a new variable
new.labels, which is a list of all 18 factor levels. Indexing is used to replace the 12th
element of the
new.labels variable, which contains the incorrect label “Mylagia”. After the incorrect label has been replaced,
the levels() command can be used on the left-hand side of the assignment arrow to re-define the factor level
definitions of the AE$Adverse.Event variable. After re-defining the factor levels, the AE$Adverse.Event
variable is displayed to reveal there are now only 17 factor levels. Finally, the summary() and pie()
commands are used to generate a corrected pie chart of the data (Figure 16).
2.2.2 Changing fonts, colors and label sizes
Later in this manual, the par() command will be used to create some multi-panel figures and make
other changes to multiple graphs. For now, you should read some of the help documentation for the par()
command, because many graphing parameters in par() can be called within other graphing procedures like
pie(), hist(), plot(), etc. Among other things, these graphing parameters can be used to change the fonts,
colors and label sizes of the main title, subtitle, X- and Y-axis labels in pie charts (Figure 16), histograms
(Figure 17) and other graphics (Figure 18).
Figure 16. A pie chart with custom
fonts and colors
Figure 17. Histogram with custom
fonts and colors
Figure 18. Bar chart with custom
fonts and colors
> # Generate a pie chart from AE data with customized labels
> pie(x=counts, main=main, sub=subtitle, font=2, family="serif", cex=0.8,](https://image.slidesharecdn.com/bettergraphicsinrmanual-170503184421/85/Better-graphics-in-R-20-320.jpg)
![Crash Course: Better Graphics in R
22
> # Generate a vector of simulated "residuals"
> residuals <- rnorm(20,0,3.5)
> # Generate log10 transform of drug variable
> log10drug <- log(AFP$drug,10)
> # Generate drug-squared quadratic term
> drugSq <- AFP$drug*AFP$drug
> # Residuals plot with subscript labels
> plot(log10drug, residuals, main="Residuals Plot",
xlab=expression(paste(log[10]," drug concentration")))
> # Residuals plot with superscript labels
> plot(drugSq, residuals, main="Residuals Plot",
xlab=expression(paste("drug concentration"^2)))
> # Generate sequence from 0 to 1
> x <- seq(from=0,to=1,length=8000)
> # Define a function f(x)
> f <- function(x) 23*x^2 / (1 + 10^((6*log10(x) - 15)*0.7))
> # Plot function with math formula in title
> plot(x,f(x),type="l",main=expression(paste("Plot of ",f(x) == frac(beta*x^2 ,
(1 + 10^((psi*log[10](x) - theta)*gamma))))))
In the first graph (Figure 19), square brackets are used to specify the subscripted text within the
expression() command and the paste() command is used inside the expression command to join the
mathematical expression “log10” with the rest of the text string. In the second graph (Figure 20), the carrot
symbol “^” identifies the superscripted text. The third graph (Figure 21) features a much more complicated
mathematical formula in the expression() command. Note how the double equal sign “==” is used to create a
regular equal sign within the mathematical expression and the function “frac(a,b)” is used to generate a large
fraction graphic in the main title. Greek symbols are generated within the expression() command using the
usual English phrases (e.g. = “theta”, = “pi”).
2.3 Custom Color and Layout Options
The previous sections of this chapter described how to produce basic graphs and customize their labels,
but often the graphic itself needs to be customized with new colors or a more informative layout. For example,
you have already seen that histogram graphs can provide very different interpretations of the same sample of
data just by changing the number of break points, or bins, in the histogram. A histogram with too few bins or
too many bins may not be very informative. Similarly, the layout of the X- and Y-axes of a boxplot, bar chart,
scatter plot or line plot figure can impact the effectiveness of a graph. For example, the Y-axis in the bar chart
of mean BMI from the AFP data (Figure 13) is too short, so it is difficult to estimate the mean BMI for the male
patients. You may have also noticed that the default layout can sometimes produce missing or incomplete axis
ticks and labels in figures. For example, the bar charts of adverse events from the AE data (Figure 12 and
Figure 18) either have missing horizontal labels or vertical labels that run off the page. Finally, the default
coloring options for the pie chart of adverse events (Figure 7 and Figure 16) are not particularly eye-catching,
but it seems difficult to specify 17 different colors by name for an effective layout. This section will describe
options to change the layout and coloring of these figures.
2.3.1 Custom X- and Y-axes
There are several features to customize in the X- or Y-variable of a graph, including the minimum and
maximum values of the axis and the scale of the numbered “major” ticks of an axis. Most of these features can
be directly modified using the parameters from the par() command. For example, it would be easier to](https://image.slidesharecdn.com/bettergraphicsinrmanual-170503184421/85/Better-graphics-in-R-22-320.jpg)
![Crash Course: Better Graphics in R
26
Figure 27. Histogram with rgb() color. Figure 28. Histogram with hsv() color
> # Use the rainbow() command to generate rainbow colors
> barplot(height=counts,col=rainbow(18),cex.names=0.7,las=2,...)
> # Use rgb() to generate a custom color for a histogram
> hist(rnorm(1000),col=rgb(red=0.7,green=0.1,blue=0.3,alpha=0.7,
maxColorValue=1))
> # View the value name of the custom rgb() color
> rgb(red=0.7,green=0.1,blue=0.3,alpha=0.7,maxColorValue=1)
[1] "#B21A4CB2"
> # Call the custom rgb() color by its value name
> hist(rnorm(1000),col="#B21A4CB2")
> # View the value name of a custom hsv() color
> hsv(h=0.3,s=0.7,v=0.8,gamma=1,alpha=0.5)
[1] "#5ACC3D80"
> # Call the custom hsv() color by its value name
> hist(rnorm(1000),col="#5ACC3D80")
Ch. 3. Multi-step Graphics with Figure Legends
Most graphs and figures can be produced with a single R command. However, some complicated
graphs may require multiple statements to overlap new points or lines, to add figure legends or to add features
like text labels. This section provides examples of complicated figures that require multiple commands.
3.1 Overlay New Content in the Same Graph
Often an R graphic will require the user to overlay different types of content on the same graph or
figure. Often users will need to overlay very similar types of content onto the same graph. For example, data
from several groups might be displayed on the same scatter plot figure using points with different colors or
shapes. Other figures may require users to overlay related types of information. E.g. Error bars representing
the standard error of the mean might be added to a bar chart displaying the mean BMI of male and female
patients. Sometimes, users may want to overlay entirely different types of content. E.g. A user might want to
display the fitted density of a standard normal curve over a histogram to show that the variable is normally
distributed. The next few examples will demonstrate some general principles for creating overlay figures.](https://image.slidesharecdn.com/bettergraphicsinrmanual-170503184421/85/Better-graphics-in-R-26-320.jpg)
![Crash Course: Better Graphics in R
29
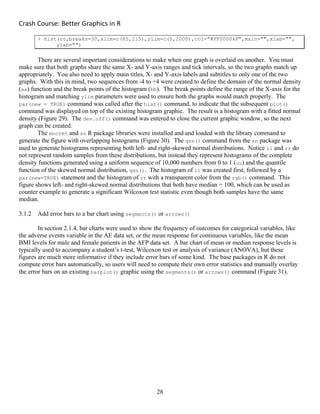
Figure 31. Bar chart with custom error bars
> # compute std dev of BMI for male and female patients
> sd.females <- sd(AFP[AFP$gender=="female",5])
> sd.males <- sd(AFP[AFP$gender=="male",5])
> sd.BMI <- c(sd.females,sd.males)
> # call the barplot() command for a bar chart of BMI
> mp <- barplot(height=mean.BMI,ylab="BMI",ylim=c(0,50),main=main,col=colors)
> # define the starting and ending points of each arrow
> X0 <- X1 <- mp
> Y0 <- mean.BMI - sd.BMI
> Y1 <- mean.BMI + sd.BMI
> # call the arrows command to overlay error bars over barplot
> arrows(X0,Y0,X1,Y1,code=3,angle=90)
Again, creating a overlay figure in R requires a little forethought. The variable mean.BMI was defined
earlier in section 2.1.4 to compute the mean BMI response for both male and female patients. Here, similar
methods are used to compute the standard deviations of BMI for both male and female patients and store them
as sd.BMI. Next, the barplot() command is used to generate the bar chart figure, but this time the figure is
also stored as the variable mp so the midpoints of each bar can be stored. Each error bar will need starting and
stopping locations on both the X- and Y-axis. Here the starting location (X0) and stopping location (X1) for the
X-axis are both defined as the midpoints (mp) from the barplot procedure, while the starting and stopping points
on the Y-axis (Y0 and Y1) are computed as one standard deviation above and one standard deviation below the
mean BMI for male and female patients, respectively. Finally, error bars are plotted using the starting and
stopping locations in the arrows() or segments() commands. The arrows() command is used to produce
capped whiskers, with the angle = 90 parameter set to produce square whisker caps. The default angle
parameter will produce arrowhead caps. The segments() command produces whiskers with no end caps.
3.1.3 Add regression lines using abline() or plot()
In section 2.1.5, the plot() command was used to produce a simple scatter plot of % Body Fat vs.
Weight from the AE data set. Researchers might want to analyze this kind of data using simple linear](https://image.slidesharecdn.com/bettergraphicsinrmanual-170503184421/85/Better-graphics-in-R-29-320.jpg)
![Crash Course: Better Graphics in R
31
> # Estimate a smoothed loess fit
> loess.line <- loess(Percent.Body.Fat~Weight,data=AE,span=0.85)
> # Create a simple scatter plot of % Body Fat vs Weight
> plot(AE$Weight,AE$Percent.Body.Fat,xlab="Weight (lbs)",ylim=c(5,50),
ylab="% Body Fat",main="Loess Fit")
> # Add the loess fit to the scatter plot
> par(new=TRUE)
> plot(sort(AE$Weight),predict(loess.line),ylim=c(5,50),type="l",lwd=2,col="blue",
xlab="",ylab="")
The linear model procedure lm() is used to fit a simple linear regression to the continuous response
variable % Body Fat and the continuous predictor variable Weight from the AE data set (Figure 32) and the
results of the analysis are stored as reg.line. A scatter plot of % Body Fat vs. Weight is created using plot()
and a regression line is added using the abline() command. There was no need to use a par(new=TRUE)
command, since abline() was called immediately after the plot() command. The abline() function is
specially designed to add straight lines to the most recent plot, using only the slope and Y-intercept of the line
as its inputs. Using the par(new=TRUE) and plot() commands would have been much more difficult for this
simple regression line.
Fitting a curved trend to the scatter plot is a little more difficult (Figure 33). The loess() command is
used to fit a local polynomial regression to the data and the results are stored as loess.line. The statistical
details of this procedure are not particularly important, except that it produces a curved fit to the data. The
plot() procedure is used to produce the initial scatterplot, then par(new=TRUE) is called to add the regression
line over the current graphic. Finally, a second plot() command is called to print the loess line, using the
sorted Weight variable as the X-values for the curve and the predicted values from the stored loess.line variable
as the Y-values for the curve.
3.1.4 Plot multiple groups using points() or lines()
Looking at the simple scatter plot of % Body Fat vs. Weight, it might be fair to ask whether additional
variables like Gender or Region could affect the relationship between % Body Fat and Weight. It may be useful
to separate the Gender or Region groups on the scatter plot to look for differences in the relationship between %
Body Fat and Weight among these groups. Multiple groups can be added to a scatter plot graph one-at-a-time
using the points() command. Groups can be separated by using multiple colors, multiple symbol types,
multiple symbol sizes or all of the above.
> # Create main title and other features
> main.gender = "Percent Body Fat versus Weight by Gender"
> main.region = "Percent Body Fat versus Weight by Region"
> xlab = "Weight"
> ylab = "% Body Fat"
> # Create a scatter plot of the female data in pink
> plot(AE[AE$Gender=="Female",5],AE[AE$Gender=="Female",6],xlim=c(90,350),
ylim=c(0,50),main=main.gender,xlab=xlab,ylab=ylab,col="pink")
> # Overlay the male data points in sky blue with points()
> points(AE[AE$Gender=="Male",5],AE[AE$Gender=="Male",6],col="sky blue")](https://image.slidesharecdn.com/bettergraphicsinrmanual-170503184421/85/Better-graphics-in-R-31-320.jpg)
![Crash Course: Better Graphics in R
32
Figure 34. Gender groups distinguished by colors Figure 35. Region groups distinguished by symbols
> # Create a scatter plot of the Southwest region data
> plot(AE[AE$Region=="Southwest",5],AE[AE$Region=="Southwest",6],xlim=c(90,350),
ylim=c(0,50),main=main.region,xlab=xlab,ylab=ylab)
> # Overlay data from other regions using new symbol types: pch
> points(AE[AE$Region=="Northwest",5],AE[AE$Region=="Northwest",6],pch=2)
> points(AE[AE$Region=="Midwest",5],AE[AE$Region=="Midwest",6],pch=3)
> points(AE[AE$Region=="Northeast",5],AE[AE$Region=="Northeast",6],pch=4)
> points(AE[AE$Region=="Southeast",5],AE[AE$Region=="Southeast",6],pch=5)
Just like the abline() command in section 3.1.3, the points() command can be used to add new data
points to the existing graphic. To separate data by gender, plot the female data in pink using the col parameter
in the plot() command and add the male data in sky blue using the col parameter in the points() command
(Figure 34). To separate the data by region, first plot the data from the Southwest region using the default
symbol and then plot the remaining regions with new symbol types using the pch parameter (Figure 35). The
symbol size can also be adjusted with the cex parameter, but it should be used carefully because it also adjusts
the size of all characters added to the plot.
Groups can also be separated on a line graph using multiple colors or multiple line types using the
lines() or ablines() commands. Similar to the points() command, the lines() command can be used
wherever plot(type=”l”) would be used. E.g. to plot probability density functions (Figure 36), nonlinear
regressions, etc. Similarly, abline() can be used multiple times to plot several regression lines (Figure 37).](https://image.slidesharecdn.com/bettergraphicsinrmanual-170503184421/85/Better-graphics-in-R-32-320.jpg)
![Crash Course: Better Graphics in R
33
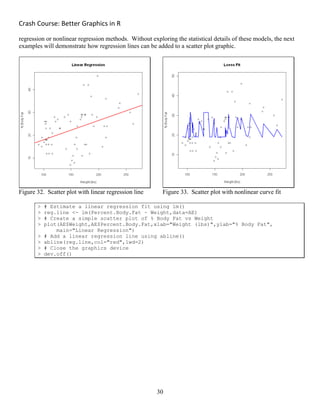
Figure 36. Seven inverse gamma density curves Figure 37. Two-color scatter plot with two line fits
> # Upload required libraries
> library(MCMCpack)
> # Create a sequence of numbers from 0 to 4
> x <- seq(from = 0, to = 4, length = 8000)
> # Plot the first probability density function
> plot(x,dinvgamma(x,1.0,0.1),type="l",col="red",xlab="Gene Expression Variance",
ylab="Density",main="Probability Density Functions of n Inverse Gamma
Distributions")
> # Plot additional probability density functions
> lines(x,dinvgamma(x,1.5,0.3),col="dark orange")
> lines(x,dinvgamma(x,3.0,1.0),col="yellow")
> lines(x,dinvgamma(x,8.0,5.0),col="light green")
> lines(x,dinvgamma(x,10.0,10.0),col="dark green")
> lines(x,dinvgamma(x,12.0,18.0),col="blue")
> lines(x,dinvgamma(x,14.0,30.0),col="purple")
>
> # Fit two linear regression models
> AE.female <- AE[AE$Gender == "Female",]
> AE.male <- AE[AE$Gender == "Male",]
> reg.female <- lm(Percent.Body.Fat ~ Weight,data=AE.female)
> reg.male <- lm(Percent.Body.Fat ~ Weight,data=AE.male)
> # Create a scatter plot of the female data in pink
> plot(AE[AE$Gender=="Female",5],AE[AE$Gender=="Female",6],xlim=c(90,350),
ylim=c(0,50),main=main,xlab=xlab,ylab=ylab,col="pink")
> # Overlay the male data points in sky blue with points()
> points(AE[AE$Gender=="Male",5],AE[AE$Gender=="Male",6],col="sky blue")
> # Overlay two linear regression lines
> abline(reg.female,col="red")
> abline(reg.male, col="blue")](https://image.slidesharecdn.com/bettergraphicsinrmanual-170503184421/85/Better-graphics-in-R-33-320.jpg)
![Crash Course: Better Graphics in R
35
> # Create indices for each plotted symbol
> indx.FSW <- AE$Gender == "Female" & AE$Region == "Southwest"
> indx.MSW <- AE$Gender == "Male" & AE$Region == "Southwest"
> indx.FNW <- AE$Gender == "Female" & AE$Region == "Northwest"
> indx.MNW <- AE$Gender == "Male" & AE$Region == "Northwest"
> indx.FMW <- AE$Gender == "Female" & AE$Region == "Midwest"
> indx.MMW <- AE$Gender == "Male" & AE$Region == "Midwest"
> indx.FNE <- AE$Gender == "Female" & AE$Region == "Northeast"
> indx.MNE <- AE$Gender == "Male" & AE$Region == "Northeast"
> indx.FSE <- AE$Gender == "Female" & AE$Region == "Southeast"
> indx.MSE <- AE$Gender == "Male" & AE$Region == "Southeast"
> # Call the plot() and points() functions to generate figure
> plot(AE[indx.FSW,5],AE[indx.FSW,6],xlim=c(90,350), ylim=c(0,50),main=main,
xlab=xlab,ylab=ylab,col="pink")
> points(AE[indx.MSW,5],AE[indx.MSW,6],col="sky blue")
> points(AE[indx.FNW,5],AE[indx.FNW,6],col="pink",pch=2)
> points(AE[indx.MNW,5],AE[indx.MNW,6],col="sky blue",pch=2)
> points(AE[indx.FMW,5],AE[indx.FMW,6],col="pink",pch=3)
> points(AE[indx.MMW,5],AE[indx.MMW,6],col="sky blue",pch=3)
> points(AE[indx.FNE,5],AE[indx.FNE,6],col="pink",pch=4)
> points(AE[indx.MNE,5],AE[indx.MNE,6],col="sky blue",pch=4)
> points(AE[indx.FSE,5],AE[indx.FSE,6],col="pink",pch=5)
> points(AE[indx.MSE,5],AE[indx.MSE,6],col="sky blue",pch=5)
> legend(x="topleft",legend=c("female","male"),fill=c("pink","sky blue"),
title="Gender")
> legend(x="topright",legend=c("SW","NW","MW","NE","SE"),pch=1:5,title="Region")
> legend(x="bottomright",legend=c("Female","Male","SW","NW","MW","NE","SE"),
col=c("pink","sky blue",rep("black",5)),pch=c(15,15,1:5),title="Legend")
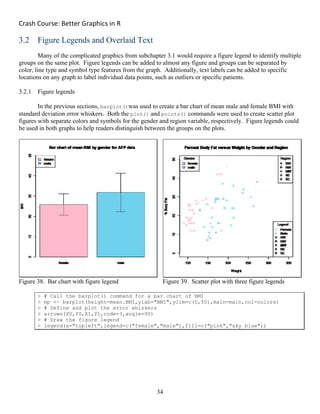
The figure legend for the bar chart is easy to create using the legend() command (Figure 38). The
legend() command has parameters x and y that are used to specify the exact location of the legend within the
plotting region (e.g. x = 15 and y = 200 would place the figure legend at (x,y) = (15,200) in the graph, if it
exists). While this precise level of control can be useful, many user will prefer to use shortcut locations like x =
“topleft” or x = “bottomright” to place the legend in one of nine standard locations. See the Details
section of help(legend) in R for more information. The legend parameter of the legend() command is used
to specify the group labels in the legend. Note that you can choose to leave certain groups off the legend, or
you can add notations for groups that are not present in the figure, if needed. Finally, the fill parameter is
used to create filled boxes representing the colors of the male and female groups in this graph.
Note this new scatter plot graph is a little more complicated than the example in section 3.1.4 above
(Figure 39). The first step was to create a series of ten index variables to identify individuals from each region
and each gender, so these groups can be separated by symbol types and colors on the final plot. Each index was
created using two inequalities evaluated simultaneously using the ampersand symbol &. The initial plot()
command was only called for the female patients from the Southwest region, plotting with the default symbol
and pink coloring. Remember, it is important to set reasonable x-axis and y-axis limits for this first plot with
the xlim and ylim parameters, because all of the remaining groups will be plotted over this first figure. If xlim
and ylim are chosen poorly, the remaining groups might not be visible. The next nine points() commands are
used to add the remaining data to the plot, one-group-at-a-time. Male and female patients are plotted in sky
blue and pink colors, respectively, and each region is plotted with its own symbol type using the pch parameter.
Three separate figure legends were added to this complicated scatter plot figure to show multiple
concepts. The first legend() command is identical to the command used for the bar chart in the previous
example, except a title parameter was added to show the top right legend identifies points by gender. The
second legend() command uses a pch parameter instead of the fill parameter, so each group can be identified
by its symbol type. A researcher might choose to display both of these two figure legends, so readers could](https://image.slidesharecdn.com/bettergraphicsinrmanual-170503184421/85/Better-graphics-in-R-35-320.jpg)
![Crash Course: Better Graphics in R
36
properly distinguish between the genders separated by color and the regions separated by symbol type. It is
important to note that two or more legends can be applied to the same figure. But what if you want all of the
information in a single legend? The third legend() command is redundant with the first two legends, but it
demonstrates one creative way to combine both the gender and region elements into a single legend. The fill
parameter is not used in the third legend, but a careful choice of pch = 15 and for the “Female” and “Male”
yields a filled square symbol that can be colored with the col parameter. The remaining region symbols are
colored black for simplicity.
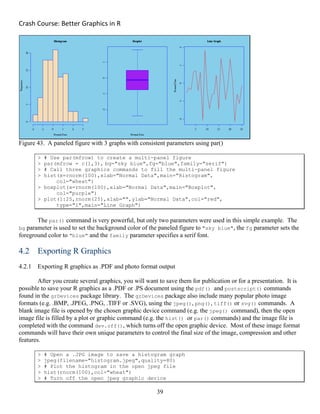
3.2.2 Adding text labels inside a graph
Just like the abline(), points(), lines() and legend() commands can all be used to add new
features to an existing graph, there is also a text() command that can be used to add new text labels to specific
locations within a graph. This can be useful to identify outliers on a bar chart or regression plot, to identify
specific patients of interest in a medical study or just to add general comments for your readers.
Figure 40. General comments added to a scatter plot Figure 41. Outlier identified in a bar chart
> # Create multicolor, multisymbol scatter plot as above
> plot(AE[indx.FSW,5],AE[indx.FSW,6],xlim=c(90,350),ylim=c(0,50),main=main,
xlab=xlab,ylab=ylab,col="pink")
> points(AE[indx.MSW,5],AE[indx.MSW,6],col="sky blue")
> points(AE[indx.FNW,5],AE[indx.FNW,6],col="pink",pch=2)
> points(AE[indx.MNW,5],AE[indx.MNW,6],col="sky blue",pch=2)
> points(AE[indx.FMW,5],AE[indx.FMW,6],col="pink",pch=3)
> points(AE[indx.MMW,5],AE[indx.MMW,6],col="sky blue",pch=3)
> points(AE[indx.FNE,5],AE[indx.FNE,6],col="pink",pch=4)
> points(AE[indx.MNE,5],AE[indx.MNE,6],col="sky blue",pch=4)
> points(AE[indx.FSE,5],AE[indx.FSE,6],col="pink",pch=5)
> points(AE[indx.MSE,5],AE[indx.MSE,6],col="sky blue",pch=5)
> legend(x="topleft",legend=c("female","male"),fill=c("pink","sky blue"),
title="Gender")
> legend(x="topright",legend=c("SW","NW","MW","NE","SE"),
pch=1:5,title="Region")](https://image.slidesharecdn.com/bettergraphicsinrmanual-170503184421/85/Better-graphics-in-R-36-320.jpg)
![Crash Course: Better Graphics in R
37
> # Add large gray cross symbols to demonstrate centering of text
> points(c(300,280),c(18,6),pch=3,cex=4,col="light gray")
> # Add default text annotations to graph
> text(300, 18, "the text is CENTERED around n (x,y) = (300,18)
by default",cex=0.8)
> # Add justification adjustments to text annotation
> text(280, 6, "or Right/Bottom JUSTIFIED n at (x,y) = (280,6)
by 'adj = c(1,0)'",adj=c(1,0),cex=0.8)
>
> # call the barplot() command for a bar chart of BMI
> mp <- barplot(height=mean.BMI,ylab="BMI",ylim=c(0,50),
main=main,col=colors)
> # call the arrows command to overlay error bars over barplot
> arrows(X0,Y0,X1,Y1,code=3,angle=90)
> legend(x="topright",legend=c("female","male"),
fill=c("pink","sky blue"))
> # Add outliers to bar chart graph with points() command
> points(mp[1],41,col="black",pch=16)
> # Add text label to identify outlier point on graph
> text(mp[1],42,"Outlier!",adj=c(0,0),cex=1.5)
The first example uses the multi-color, multi-symbol scatter plot to show how general comments can be
added to any plot (Figure 40). In this special example, two large gray “cross” symbols were added in the same
location as the text comments to demonstrate how the text command uses justification. Obviously, you would
want to remove these points from the final figure, but this can be a helpful trick for lining up your text. The
second example shows how you might use the points() and text() commands to add annotations to outlier
points on a bar chart or other graphic (Figure 41). While outliers may be plotted automatically in a box plot
figure, it may be necessary to plot the outliers manually in a bar chart or other graphics.
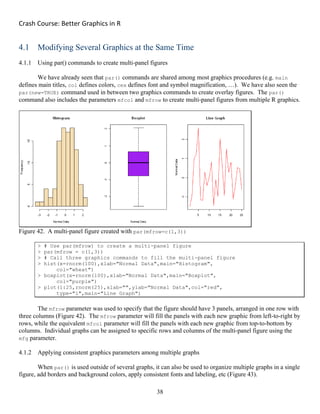
Ch. 4. Multi-panel Layouts and Image Formats
Now that you have created some individual graphs in R, it may be necessary to organize the graphs into
consistently formatted multi-panel figures and export the results for publication. You can usually copy-and-
paste R graphics directly from the graphics window into popular software applications like MS PowerPoint or
other software, which could be used to organize and customize the graphs. You can also save graphic images to
your computer in a handful of image formats (e.g. PDF, PNG, JPG, ...) from the graphics window by clicking >
File > Save As... in the MS Windows or Mac OSX R GUI. These images can also be opened in PowerPoint
and other software. However, it may produce better results if you edit these figures within R. The par()
command can be used to help organize multiple graphs into paneled figures. Additionally, R includes a variety
of different graphics commands to save your graphs in popular photo, drawing and document formats (e.g.
.JPG, .PDF, …). These commands can provide better control over the final look of your published figures.](https://image.slidesharecdn.com/bettergraphicsinrmanual-170503184421/85/Better-graphics-in-R-37-320.jpg)
This document provides a training manual on better graphics in R. It begins with an overview of R and BioConductor and reviews basic R functions. It then covers creating simple and customized graphics, multi-step graphics with legends, and multi-panel layouts. The manual aims to help researchers learn visualization techniques to improve the communication of their data and results.


![[DSC Europe 25] Milos Belcevic - Product Professional's Journey to Full-Stack...](https://cdn.slidesharecdn.com/ss_thumbnails/1zovd6fgsycdg4wvgvls-milos-belcevic-product-professionals-journey-to-full-stack-product-developer-260123083019-d993120d-thumbnail.jpg?width=640&height=640&fit=bounds)

![[DSC Europe 25] Borko Kozomora - Optimizing business workflows with advances ...](https://cdn.slidesharecdn.com/ss_thumbnails/hbgekyb0txw0xpo4yfml-borko-kozomora-leading-ai-transformation-260122103838-cc29ee38-thumbnail.jpg?width=640&height=640&fit=bounds)
![[DSC Europe 25] Bojan Banjac - AI is always right when it comes to the matter...](https://cdn.slidesharecdn.com/ss_thumbnails/syoxtqierpydwxm5srcb-4-bojan-banjac-ai-is-always-right-when-it-comes-to-the-matters-of-taste-260119101519-694ee7d7-thumbnail.jpg?width=640&height=640&fit=bounds)


![[DSC Europe 25] Gordana Milutinovic Dumbelovic - From Insight to Oversight: A...](https://cdn.slidesharecdn.com/ss_thumbnails/t7dkjsfxqwwzceropjv4-gordana-milutinovicdumbelovic-from-insight-to-oversight-ai-driven-power-bi-moni-260119121559-9e0bf11b-thumbnail.jpg?width=640&height=640&fit=bounds)

![[DSC Europe 25] Josip Saban - Career building for data professionals.pptx](https://cdn.slidesharecdn.com/ss_thumbnails/zroflcttkm1vmli0txea-josip-saban-career-building-for-data-professionals-260123083019-587cdb8c-thumbnail.jpg?width=640&height=640&fit=bounds)