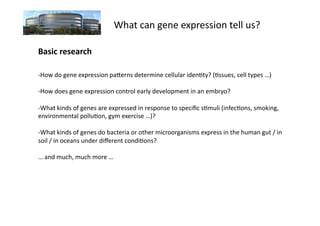
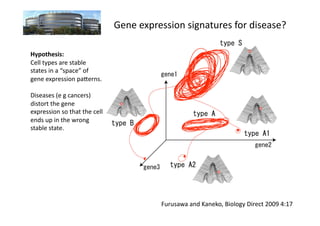
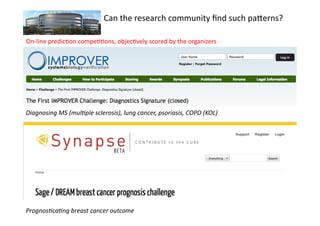
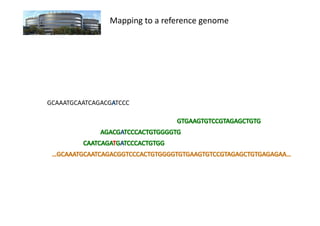
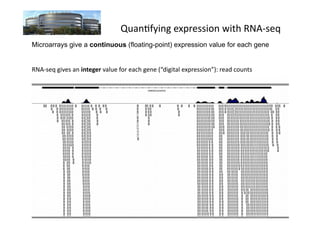
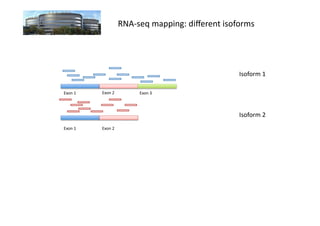
The document discusses RNA-seq analysis. It begins with an introduction to Mikael Huss, a bioinformatics scientist, and provides an overview of how genomics, RNA profiles, protein profiles, and interactomics relate within systems biology. The document then discusses how gene expression analysis can provide insights into basic research questions regarding tissue and cell identity, as well as insights into diseases by identifying genes that are over- or under-expressed in patients. Finally, it provides a brief overview of the typical workflow for RNA-seq analysis, which involves mapping RNA sequencing reads to a reference genome or transcriptome.
Course: Bioinformatics for Biomedical Research (2014).
Session: 4.1- Introduction to RNA-seq and RNA-seq Data Analysis.
Statistics and Bioinformatisc Unit (UEB) & High Technology Unit (UAT) from Vall d'Hebron Research Institute (www.vhir.org), Barcelona.
AGRF in conjunction with EMBL Australia recently organised a workshop at Monash University Clayton. This workshop was targeted at beginners and biologists who are new to analysing Next-Gen Sequencing data. The workshop also aimed to provide users with a snapshot of bioinformatics and data analysis tips on how to begin to analyse project data. An introduction to RNA-seq data analysis was presented by AGRF Senior Bioinformatician Dr. Sonika Tyagi.
Presented: 1st August 2012
A workshop is intended for those who are interested in and are in the planning stages of conducting an RNA-Seq experiment. Topics to be discussed will include:
* Experimental Design of RNA-Seq experiment
* Sample preparation, best practices
* High throughput sequencing basics and choices
* Cost estimation
* Differential Gene Expression Analysis
* Data cleanup and quality assurance
* Mapping your data
* Assigning reads to genes and counting
* Analysis of differentially expressed genes
* Downstream analysis/visualizations and tables
Transcriptomics is the study of RNA, single-stranded nucleic acid, which was not separated from the DNA world until the central dogma was formulated by Francis Crick in 1958, i.e., the idea that genetic information is transcribed from DNA to RNA and then translated from RNA into protein.
complete Single Nucleotide Polymorphiitsm Detection methods with Advance techniques with its applications
Single nucleotide polymorphisms are single base variations between genomes within a species.
There are at least 10 million polymorphic sites in the human genome.
SNPs can distinguish individuals from one another
Denaturing Gradient Gel Electrophoresis
Chemical Cleavage Of Mismatch
Single-stranded Conformation Polymorphism (SSCP)
MutS Protein-binding Assays
Mismatch Repair Detection (MRD)
Heteroduplex Analysis (HA)
Denaturing High Performance Liquid Chromatography (DHPLC)
UNG-Mediated T-Sequencing
RNA-Mediated Finger printing with MALDI MS Detection
Sequencing by Hybridization
Direct DNA Sequencing
Single-feature polymorphism (SFP)
Invader probe
Allele-specific oligonucleotide probes
PCR-based methods
Allele specific primers
Sequence Polymorphism-Derived (SPD) markers
Targeting induced local lesions in genomes (TILLinG)
Minisequencing primers
Allele-specific ligation probes
Next Generation Sequencing (NGS) Is A Modern And Cost Effective Sequencing Technology Which Enables Scientists To Sequence Nucleic Acids At Much Faster Rate. In This Presentation, You Will Learn About What is NGS, Idea Behind NGS, Methodology And Protocol, Widely Adapted NGS Protocols, Applications And References For Further Study.
RNA Sequence data analysis,Transcriptome sequencing, Sequencing steady state RNA in a sample is known as RNA-Seq. It is free of limitations such as prior knowledge about the organism is not required.
RNA-Seq is useful to unravel inaccessible complexities of transcriptomics such as finding novel transcripts and isoforms.
Data set produced is large and complex; interpretation is not straight forward.
Today it is possible to obtain genome-wide transcriptome data from single cells using high-throughput sequencing (scRNA-seq). The main advantage of scRNA-seq is that the cellular resolution and the genome wide scope makes it possible to address issues that are intractable using other methods, e.g. bulk RNA-seq or single-cell RT-qPCR. However, to analyze scRNA-seq data, novel methods are required and some of the underlying assumptions for the methods developed for bulk RNA-seq experiments are no longer valid.
The study of the complete set of RNAs (transcriptome) encoded by the genome of a specific cell or organism at a specific time or under a specific set of conditions is called Transcriptomics.
Transcriptomics aims:
I. To catalogue all species of transcripts, including mRNAs, noncoding RNAs and small RNAs.
II. To determine the transcriptional structure of genes, in terms of their start sites, 5′ and 3′ ends, splicing patterns and other post-transcriptional modifications.
III. To quantify the changing expression levels of each transcript during development and under different conditions.
Apollo is a web-based application that supports and enables collaborative genome curation in real time, allowing teams of curators to improve on existing automated gene models through an intuitive interface. Apollo allows researchers to break down large amounts of data into manageable portions to mobilize groups of researchers with shared interests.
The i5K, an initiative to sequence the genomes of 5,000 insect and related arthropod species, is a broad and inclusive effort that seeks to involve scientists from around the world in their genome curation process, and Apollo is serving as the platform to empower this community.
This presentation is an introduction to Apollo for the members of the i5K Pilot Project working on species of the order Hemiptera.
Ernesto Picardi – Bioinformatica e genomica comparata: nuove strategie sperim...eventi-ITBbari
Bioinformatica e genomica comparata: nuove strategie sperimentali e computazionali per la produzione e analisi di dati NGS finalizzati a sviluppare processi e prodotti innovativi per la salute dell’uomo, l’ambiente e l’agroalimentare.
Knowing Your NGS Upstream: Alignment and VariantsGolden Helix Inc
Alignment algorithms are not just about placing reads in best-matching locations to a reference genome. They are now being expected to handle small insertions, deletions, gapped alignment of reads across intron boundaries and even span breakpoints of structural variations, fusions and copy number changes. At the same time, variant-calling algorithms can only reach their full potential by being intimately matched to the aligner's output or by doing local assemblies themselves. Knowing when these tools can be expected to perform well and when they will produce technical artifacts or be incapable of detecting features is critical when interpreting any analysis based on their output.
This presentation will compare the performance of the alignment and variant calling tools used by sequencing service providers including Illumina Genome Network, Complete Genomics and The Broad Institute. Using public samples analyzed by each pipeline, we will look at the level of concordance and dive into investigating problematic variants and regions of the genome.
Alzheimer’s disease (AD) is a devastating neurodegenerative disease that is genetically complex. Although great progress has been made in identifying fully penetrant mutations in genes that cause early-onset AD, these still represent a very small percentage of AD cases. Large-scale, genome-wide association studies (GWAS) have identified at least 20 additional genetic risk loci for the more common form: late-onset AD. However, the identified SNPs are typically not the actual risk variants, but are in linkage disequilibrium with the presumed causative variants [1].
To help identify causative genetic variants, we have combined highly accurate, long-read sequencing with hybrid-capture technology. In this collaborative webinar*, we present this method and show how combining IDT xGen® Lockdown® Probes with PacBio SMRT® Sequencing allows targeting and sequencing of candidate genes from genomic DNA and corresponding transcripts from cDNA. Using a panel of target capture probes for 35 AD candidate genes, we demonstrate the power of this approach by looking at data for two individuals with AD. Some additional benefits of this method include the ability to leverage long reads, phase heterozygous variants, and link corresponding transcript isoforms to their respective alleles.
Reference: 1. Van Cauwenberghe C, Van Broeckhoven C, Sleegers K. (2016) The genetic landscape of Alzheimer disease: clinical implications and perspectives. Genet Med, 18(5):421–430.
* This presentation represents a collaboration between Pacific Biosciences and Integrated DNA Technologies. The individual opinions expressed may not reflect shared opinions of Pacific Biosciences and Integrated DNA Technologies.
Apollo is a web-based application that supports and enables collaborative genome curation in real time, allowing teams of curators to improve on existing automated gene models through an intuitive interface. Apollo allows researchers to break down large amounts of data into manageable portions to mobilize groups of researchers with shared interests.
The i5K, an initiative to sequence the genomes of 5,000 insect and related arthropod species, is a broad and inclusive effort that seeks to involve scientists from around the world in their genome curation process, and Apollo is serving as the platform to empower this community.
This presentation is an introduction to Apollo for the members of the i5K Pilot Project on Eurytemora affinis
NCBI has developed a powerful suite of online biomedical and bioinformatics resources, including old friends like PubMed and OMIM and newer resources such as Genome. This collection of databases and tools are widely used by scientists and medical professionals across the world. With such a wealth of information, it is easy to get overwhelmed. Join us for an overview to NCBI resources for the information professional with an emphasis on biodata connectivity. No science degree required!
A DNA microarray (also commonly known as DNA chip or biochip) is a collection of microscopic DNA spots attached to a solid surface.
The core principle behind microarrays is hybridization between two DNA strands, the property of complementary nucleic acid sequences to specifically pair with each other by forming hydrogen bonds between complementary nucleotide base pairs.
Introduction to Apollo: A webinar for the i5K Research CommunityMonica Munoz-Torres
Apollo is a web-based application that supports and enables collaborative genome curation in real time, allowing teams of curators to improve on existing automated gene models through an intuitive interface. Apollo allows researchers to break down large amounts of data into manageable portions to mobilize groups of researchers with shared interests.
The i5K, an initiative to sequence the genomes of 5,000 insect and related arthropod species, is a broad and inclusive effort that seeks to involve scientists from around the world in their genome curation process, and Apollo is serving as the platform to empower this community.
This presentation is an introduction to Apollo for the members of the i5K Pilot Project Species.
This is an introduction to conducting manual annotation efforts using Apollo. This webinar was offered to members of the i5K Research community on 2015-10-07.
New Directions in Targeted Therapeutic Approaches for Older Adults With Mantl...i3 Health
i3 Health is pleased to make the speaker slides from this activity available for use as a non-accredited self-study or teaching resource.
This slide deck presented by Dr. Kami Maddocks, Professor-Clinical in the Division of Hematology and
Associate Division Director for Ambulatory Operations
The Ohio State University Comprehensive Cancer Center, will provide insight into new directions in targeted therapeutic approaches for older adults with mantle cell lymphoma.
STATEMENT OF NEED
Mantle cell lymphoma (MCL) is a rare, aggressive B-cell non-Hodgkin lymphoma (NHL) accounting for 5% to 7% of all lymphomas. Its prognosis ranges from indolent disease that does not require treatment for years to very aggressive disease, which is associated with poor survival (Silkenstedt et al, 2021). Typically, MCL is diagnosed at advanced stage and in older patients who cannot tolerate intensive therapy (NCCN, 2022). Although recent advances have slightly increased remission rates, recurrence and relapse remain very common, leading to a median overall survival between 3 and 6 years (LLS, 2021). Though there are several effective options, progress is still needed towards establishing an accepted frontline approach for MCL (Castellino et al, 2022). Treatment selection and management of MCL are complicated by the heterogeneity of prognosis, advanced age and comorbidities of patients, and lack of an established standard approach for treatment, making it vital that clinicians be familiar with the latest research and advances in this area. In this activity chaired by Michael Wang, MD, Professor in the Department of Lymphoma & Myeloma at MD Anderson Cancer Center, expert faculty will discuss prognostic factors informing treatment, the promising results of recent trials in new therapeutic approaches, and the implications of treatment resistance in therapeutic selection for MCL.
Target Audience
Hematology/oncology fellows, attending faculty, and other health care professionals involved in the treatment of patients with mantle cell lymphoma (MCL).
Learning Objectives
1.) Identify clinical and biological prognostic factors that can guide treatment decision making for older adults with MCL
2.) Evaluate emerging data on targeted therapeutic approaches for treatment-naive and relapsed/refractory MCL and their applicability to older adults
3.) Assess mechanisms of resistance to targeted therapies for MCL and their implications for treatment selection
Explore natural remedies for syphilis treatment in Singapore. Discover alternative therapies, herbal remedies, and lifestyle changes that may complement conventional treatments. Learn about holistic approaches to managing syphilis symptoms and supporting overall health.
Pulmonary Thromboembolism - etilogy, types, medical- Surgical and nursing man...VarunMahajani
Disruption of blood supply to lung alveoli due to blockage of one or more pulmonary blood vessels is called as Pulmonary thromboembolism. In this presentation we will discuss its causes, types and its management in depth.
micro teaching on communication m.sc nursing.pdfAnurag Sharma
Microteaching is a unique model of practice teaching. It is a viable instrument for the. desired change in the teaching behavior or the behavior potential which, in specified types of real. classroom situations, tends to facilitate the achievement of specified types of objectives.
Ozempic: Preoperative Management of Patients on GLP-1 Receptor Agonists Saeid Safari
Preoperative Management of Patients on GLP-1 Receptor Agonists like Ozempic and Semiglutide
ASA GUIDELINE
NYSORA Guideline
2 Case Reports of Gastric Ultrasound
Prix Galien International 2024 Forum ProgramLevi Shapiro
June 20, 2024, Prix Galien International and Jerusalem Ethics Forum in ROME. Detailed agenda including panels:
- ADVANCES IN CARDIOLOGY: A NEW PARADIGM IS COMING
- WOMEN’S HEALTH: FERTILITY PRESERVATION
- WHAT’S NEW IN THE TREATMENT OF INFECTIOUS,
ONCOLOGICAL AND INFLAMMATORY SKIN DISEASES?
- ARTIFICIAL INTELLIGENCE AND ETHICS
- GENE THERAPY
- BEYOND BORDERS: GLOBAL INITIATIVES FOR DEMOCRATIZING LIFE SCIENCE TECHNOLOGIES AND PROMOTING ACCESS TO HEALTHCARE
- ETHICAL CHALLENGES IN LIFE SCIENCES
- Prix Galien International Awards Ceremony
TEST BANK for Operations Management, 14th Edition by William J. Stevenson, Ve...kevinkariuki227
TEST BANK for Operations Management, 14th Edition by William J. Stevenson, Verified Chapters 1 - 19, Complete Newest Version.pdf
HOT NEW PRODUCT! BIG SALES FAST SHIPPING NOW FROM CHINA!! EU KU DB BK substit...GL Anaacs
Contact us if you are interested:
Email / Skype : kefaya1771@gmail.com
Threema: PXHY5PDH
New BATCH Ku !!! MUCH IN DEMAND FAST SALE EVERY BATCH HAPPY GOOD EFFECT BIG BATCH !
Contact me on Threema or skype to start big business!!
Hot-sale products:
NEW HOT EUTYLONE WHITE CRYSTAL!!
5cl-adba precursor (semi finished )
5cl-adba raw materials
ADBB precursor (semi finished )
ADBB raw materials
APVP powder
5fadb/4f-adb
Jwh018 / Jwh210
Eutylone crystal
Protonitazene (hydrochloride) CAS: 119276-01-6
Flubrotizolam CAS: 57801-95-3
Metonitazene CAS: 14680-51-4
Payment terms: Western Union,MoneyGram,Bitcoin or USDT.
Deliver Time: Usually 7-15days
Shipping method: FedEx, TNT, DHL,UPS etc.Our deliveries are 100% safe, fast, reliable and discreet.
Samples will be sent for your evaluation!If you are interested in, please contact me, let's talk details.
We specializes in exporting high quality Research chemical, medical intermediate, Pharmaceutical chemicals and so on. Products are exported to USA, Canada, France, Korea, Japan,Russia, Southeast Asia and other countries.
Ethanol (CH3CH2OH), or beverage alcohol, is a two-carbon alcohol
that is rapidly distributed in the body and brain. Ethanol alters many
neurochemical systems and has rewarding and addictive properties. It
is the oldest recreational drug and likely contributes to more morbidity,
mortality, and public health costs than all illicit drugs combined. The
5th edition of the Diagnostic and Statistical Manual of Mental Disorders
(DSM-5) integrates alcohol abuse and alcohol dependence into a single
disorder called alcohol use disorder (AUD), with mild, moderate,
and severe subclassifications (American Psychiatric Association, 2013).
In the DSM-5, all types of substance abuse and dependence have been
combined into a single substance use disorder (SUD) on a continuum
from mild to severe. A diagnosis of AUD requires that at least two of
the 11 DSM-5 behaviors be present within a 12-month period (mild
AUD: 2–3 criteria; moderate AUD: 4–5 criteria; severe AUD: 6–11 criteria).
The four main behavioral effects of AUD are impaired control over
drinking, negative social consequences, risky use, and altered physiological
effects (tolerance, withdrawal). This chapter presents an overview
of the prevalence and harmful consequences of AUD in the U.S.,
the systemic nature of the disease, neurocircuitry and stages of AUD,
comorbidities, fetal alcohol spectrum disorders, genetic risk factors, and
pharmacotherapies for AUD.
Title: Sense of Taste
Presenter: Dr. Faiza, Assistant Professor of Physiology
Qualifications:
MBBS (Best Graduate, AIMC Lahore)
FCPS Physiology
ICMT, CHPE, DHPE (STMU)
MPH (GC University, Faisalabad)
MBA (Virtual University of Pakistan)
Learning Objectives:
Describe the structure and function of taste buds.
Describe the relationship between the taste threshold and taste index of common substances.
Explain the chemical basis and signal transduction of taste perception for each type of primary taste sensation.
Recognize different abnormalities of taste perception and their causes.
Key Topics:
Significance of Taste Sensation:
Differentiation between pleasant and harmful food
Influence on behavior
Selection of food based on metabolic needs
Receptors of Taste:
Taste buds on the tongue
Influence of sense of smell, texture of food, and pain stimulation (e.g., by pepper)
Primary and Secondary Taste Sensations:
Primary taste sensations: Sweet, Sour, Salty, Bitter, Umami
Chemical basis and signal transduction mechanisms for each taste
Taste Threshold and Index:
Taste threshold values for Sweet (sucrose), Salty (NaCl), Sour (HCl), and Bitter (Quinine)
Taste index relationship: Inversely proportional to taste threshold
Taste Blindness:
Inability to taste certain substances, particularly thiourea compounds
Example: Phenylthiocarbamide
Structure and Function of Taste Buds:
Composition: Epithelial cells, Sustentacular/Supporting cells, Taste cells, Basal cells
Features: Taste pores, Taste hairs/microvilli, and Taste nerve fibers
Location of Taste Buds:
Found in papillae of the tongue (Fungiform, Circumvallate, Foliate)
Also present on the palate, tonsillar pillars, epiglottis, and proximal esophagus
Mechanism of Taste Stimulation:
Interaction of taste substances with receptors on microvilli
Signal transduction pathways for Umami, Sweet, Bitter, Sour, and Salty tastes
Taste Sensitivity and Adaptation:
Decrease in sensitivity with age
Rapid adaptation of taste sensation
Role of Saliva in Taste:
Dissolution of tastants to reach receptors
Washing away the stimulus
Taste Preferences and Aversions:
Mechanisms behind taste preference and aversion
Influence of receptors and neural pathways
Impact of Sensory Nerve Damage:
Degeneration of taste buds if the sensory nerve fiber is cut
Abnormalities of Taste Detection:
Conditions: Ageusia, Hypogeusia, Dysgeusia (parageusia)
Causes: Nerve damage, neurological disorders, infections, poor oral hygiene, adverse drug effects, deficiencies, aging, tobacco use, altered neurotransmitter levels
Neurotransmitters and Taste Threshold:
Effects of serotonin (5-HT) and norepinephrine (NE) on taste sensitivity
Supertasters:
25% of the population with heightened sensitivity to taste, especially bitterness
Increased number of fungiform papillae
Anti ulcer drugs and their Advance pharmacology ||
Anti-ulcer drugs are medications used to prevent and treat ulcers in the stomach and upper part of the small intestine (duodenal ulcers). These ulcers are often caused by an imbalance between stomach acid and the mucosal lining, which protects the stomach lining.
||Scope: Overview of various classes of anti-ulcer drugs, their mechanisms of action, indications, side effects, and clinical considerations.
These simplified slides by Dr. Sidra Arshad present an overview of the non-respiratory functions of the respiratory tract.
Learning objectives:
1. Enlist the non-respiratory functions of the respiratory tract
2. Briefly explain how these functions are carried out
3. Discuss the significance of dead space
4. Differentiate between minute ventilation and alveolar ventilation
5. Describe the cough and sneeze reflexes
Study Resources:
1. Chapter 39, Guyton and Hall Textbook of Medical Physiology, 14th edition
2. Chapter 34, Ganong’s Review of Medical Physiology, 26th edition
3. Chapter 17, Human Physiology by Lauralee Sherwood, 9th edition
4. Non-respiratory functions of the lungs https://academic.oup.com/bjaed/article/13/3/98/278874
Ocular injury ppt Upendra pal optometrist upums saifai etawah
RNA-seq Analysis
1. RNA-‐seq
analysis
Mikael
Huss
Bioinforma7cs
scien7st
at
WABI
(Wallenberg
Advanced
Infrastructure
for
Bioinforma7cs),
Science
for
Life
Laboratory
/
DBB,
Stockholm
university
February
13,
2013
2. Omics,
biology
and
diseases
+ + + +
Protein “parts Protein
Genomics RNA profiles Interactomics
list” profiles
Systems
biology
Pathways,
molecular
targets,
diagnos5cs
3. Approximate contents of talk
- Gene expression analysis in general; differences between RNA-seq and microarrays
- Typical workflow(s) for RNA-seq analysis
- Normalization issues
- Visualization
- Differential expression analysis
I have tried to include many references so you can go back to these slides for
reference afterwards
4. How
DNA
get
transcribed
to
RNA
(and
then
translated
to
proteins)
varies
between
e.
g.
-‐Tissues
-‐ Cell
types
-‐ Cell
states
-‐Individuals
5. What
can
gene
expression
tell
us?
Basic
research
-‐ How
do
gene
expression
paUerns
determine
cellular
iden7ty?
(7ssues,
cell
types
…)
-‐ How
does
gene
expression
control
early
development
in
an
embryo?
-‐ What
kinds
of
genes
are
expressed
in
response
to
specific
s7muli
(infec7ons,
smoking,
environmental
pollu7on,
gym
exercise
…)?
-‐ What
kinds
of
genes
do
bacteria
or
other
microorganisms
express
in
the
human
gut
/
in
soil
/
in
oceans
under
different
condi7ons?
…
and
much,
much
more
…
6. What
can
gene
expression
tell
us?
Diseases
-‐ Which
genes
are
over-‐
(or
under-‐)expressed
in
pa7ents
vs.
healthy
controls?
-‐ Which
genes
are
correlated
to
disease
progression?
-‐ Can
markers
of
hidden
disease
be
found
by
sequencing
blood
plasma?
7. Gene
expression
signatures
for
disease?
Hypothesis:
Cell
types
are
stable
states
in
a
“space”
of
gene
expression
paUerns.
Diseases
(e
g
cancers)
distort
the
gene
expression
so
that
the
cell
ends
up
in
the
wrong
stable
state.
Furusawa
and
Kaneko,
Biology
Direct
2009
4:17
8. Can
the
research
community
find
such
paUerns?
On-‐line
predic7on
compe77ons,
objec7vely
scored
by
the
organizers
Diagnosing
MS
(mul/ple
sclerosis),
lung
cancer,
psoriasis,
COPD
(KOL)
Prognos/ca/ng
breast
cancer
outcome
9. Human
7ssue
RNA-‐seq
data
sets
Genotype-Tissue Expression project
http://commonfund.nih.gov/GTEx/
Illumina Human Body Map
accessed via ReCount database, bowtie-bio.sourceforge.net/recount/
Wang 2008 data set of ~15 human tissues
accessed via ReCount
RNA-seq Atlas
http://medicalgenomics.org/rna_seq_atlas
Human Protein Atlas
http://www.proteinatlas.org (tissue RNA-seq data not yet publicly released)
10. Tools
for
genome-‐scale
gene
expression
measurements
Microarrays
(c:a
1995)
Some7mes
called
“gene
chips”
Based
on
hybridiza7on
RNA
sequencing
(c:a
2008
in
current
form)
Based
on
sampling
12. Alterna7ve:
rRNA
deple7on
There are various kits for depleting rRNA instead
Pluses:
- Can use for microorganisms that don’t have poly-A tails
- Thus, can use for simultaneous host/pathogen expression profiling
- Can find non-coding RNA
Minuses:
-Usually leaves in quite a lot of rRNA
-In practice, often variable efficiency between samples -> hard to compare results
13. Sequencing
plagorms
ABI
3730xl
454
Life
Sciences
SOLiD
+
Pacific
Biosciences,
Sanger
Sequencing
pyrosequencing
Illumina
Oxford
Nanopore
etc
Single-‐molecule
sequencing
Length/read
800
bp
400
bp
100
bp
20
000+
bp
Reads/run
96
1
million
2
billion
5
million
Bases/run
60
kbp
400
Mbp
500
Gbp
100
Gbp
Speed
10
years/HG
1
month/HG
1
day/HG
10
min/HG
“old
school”
“2nd
gen”
“3rd
gen”
14. Microarray:
Hybridiza7on
Source:
Wikipedia
The
design
of
the
microarray
determines
what
you
can
detect
in
a
sample
15. RNA
sequencing:
Sampling
It
is
possible
to
detect
transcripts
that
are
not
known
a
priori
(in
advance)
16. RNA-‐seq
advantages
The
non-‐dependence
on
reference
makes
possible:
-‐ meta-‐transcriptomics
-‐ detec7ng
novel
splice
variants
-‐ detec7ng
novel
transcripts
-‐ Fusion
transcripts
-‐ Non-‐coding
transcripts
20. What
does
one
do
with
RNA-‐seq
reads?
• Mapping
(also
called
alignment)
• (de
novo)
Assembly
21. Mapping
(alignment)
vs.
assembly
Imagine
a
book
being
ripped
to
pieces
with
word
or
sentence
fragments
ending
up
on
each
piece
of
paper.
If
you
have
a
copy
of
the
book
that
you
can
compare
the
pieces
to,
you
have
a
mapping
(alignment)
problem.
If
you
have
no
copy
of
the
book,
you
have
a
de
novo
assembly
problem.
22. Mapping
to
a
reference
genome
Reads
from
the
sequencer
Sequencing
error
Gene7c
varia7on
CAATCAGA G TCCCACTGTGG
AGACG TCCCACTGTGGGGTG
GTGAAGTGTCCGTAGATGTGTG
GCAAATGCAATCAGACG TCCC
Gene(or
transcript)
sequence
23. Mapping
to
a
reference
genome
AGACG TCCCACTGTGGGGTG
GTGAAGTGTCCGTAGATGTGTG
GCAAATGCAATCAGACG TCCC
24. Mapping
to
a
reference
genome
GTGAAGTGTCCGTAGATGTGTG
GCAAATGCAATCAGACG TCCC
25. Mapping
to
a
reference
genome
GCAAATGCAATCAGACG TCCC
27. Mapping
to
the
genome
vs.
the
transcriptome
Vs. the genome:
-Can (in principle) detect new transcripts, splice variants
- Less sensitive, need a lot of coverage to discover new things
- Need a “splice-aware” aligned such as TopHat, MapSplice, RUM etc.
Vs. the transcriptome:
-Not unbiased anymore, tied to existing annotation
-Faster, more sensitive, need less coverage
The best of both worlds?
- Tools like TopHat (v1.4 and up) now do both
28. If
it
had
been
de
novo
assembly
CAATCAGA G TCCCACTGTGG
AGACG TCCCACTGTGGGGTG
GTGAAGTGTCCGTAGATGTGTG
GCAAATGCAATCAGACG TCCC
Assembly
CAATCAGA G TCCCACTGTGG
AGACG TCCCACTGTGGGGTG
GCAAATGCAATCAGACG TCCC
“singleton”
GTGAAGTGTCCGTAGATGTGTG
Consensus
sequence(s)
29. Assembly
of
RNA-‐seq
reads
Will not be discussed much further here.
Most popular de novo assemblers build de Bruijn graphs where overlapping k-mers
are connected to each other. The programs then try to find paths through the graph
Typically needs a LOT of RAM. Can try to pre-process using “digital normalization”
Tools:
- Trinity
- Velvet/Oases
- CLC Bio (commercial)
30. Assembly
of
RNA-‐seq
reads
Typical workflow could be:
- Clean the reads properly (remove adapters, low-quality reads)
- Useful tools: FastQC, PRINSEQ, FASTX toolkit etc.
- Run assembly tool of choice, resulting in a set of contigs
- BLAST the contigs against nt database, check for % overlap by transcript in
related organisms
- Map your original reads back to the contigs and count the reads overlapping
each
<- comparison of
assembly &
mapping
31. Quan7fying
expression
with
RNA-‐seq
Microarrays give a continuous (floating-point) expression value for each gene
RNA-‐seq
gives
an
integer
value
for
each
gene
(“digital
expression”):
read
counts
32. Example
(SciLifeLab)
mapping
workflow
FASTQ file(s)
TopHat 2.0
BAM file
Picard tools (SortSam, MarkDuplicates)
Sorted BAM file with duplicate reads removed
HTSeq 0.5 Cufflinks 2.0
Gene-level count files Gene- and isoform-level expression
(for DE analysis) estimates (FPKM, for reporting)
34. (what
it
would
look
like
mapped
to
the
genome)
Exon
1
Exon
2
Exon
3
Need
a
special
mapping
algorithm
which
allows
large
gaps,
a
“split-‐read
aligner”
35. (what
we
would
actually
observe
–
of
course
we
don’t
know
which
reads
come
from
which
isoform)
Sta7s7cal
algorithms
needed
to
es7mate
what
propor7on
of
reads
comes
from
which
isoform.
(For
example,
maximum
likelihood
/
expecta7on
maximiza7on)
36. Name
Free/Commercial/ Type
of
approach
Descrip5on
only
Xing
et
al.
2006
D
Maximum
likelihood
Partek
C
“
Li
et
al.
2010
D
“
Avadis
C
“
IsoEM
F
“
MISO
F
“
(MCMC)
Cufflinks
F
“
rQuant
F
Least
squares
(quadra7c
programming)
Rpkmforgenes.py
F
Least
squares
Howard
and
Heber
2010
D
Least
squares
FluxCapacitor
F
Linear
programming
CLC
Bio
C
?
NSMAP
F
Nonnega7ve
Sparse
Maximum
A
Posteriori
ALEXA-‐SEQ
F
Use
only
reads
that
are
compa7ble
with
a
single
isoform
NEUMA
D
Normaliza7on
by
Expected
Uniquely
Mappable
Area
37. Some remarks on isoform quantification
- It is necessary for correct gene-level quantification as well because straight read
counting methods can never be fully correct (from 2012 CuffDiff2 paper)
- Xing et al. (2006) gave the basic idea for EM-
based isoform quantification which other
programs (Cufflinks, MISO, IsoEM, …) have
added various “bells and whistles” to
- It is actually pretty hard to do isoform
quantification well because there can be a lot
of possible isoforms not enough sequence
coverage to estimate
38. Basic idea of the EM approach
We have a set of reads mapping to some locus
- Some fit one specific isoform
- Some fit several isoforms
If we knew the isoforms’ expression levels, we could distribute the reads proportionally
to those. But we don’t!
On the other hand, if we knew the probability of each read to match each isoform, we
could estimate the isoforms’ expression pretty well. But we don’t know that either.
So … start with a guess and iterate!
- Assign reads to isoforms according to some initial guess
- Re-estimate isoform expression levels
- Repeat until convergence!
39. Gene
fusion
detec7on
with
RNA-‐seq
Beyond
isoforms:
Detect
pieces
of
different
genes
that
have
been
fused
Look
for
reads
that
map
in
“wrong”
ways
Wang
et
al.
Briefings
in
Bioinforma7cs
doi:10.1093/
bib/bbs044
40. Some
further
comments
on
microarrays
and
RNA-‐seq
-‐ Microarrays
are
s7ll
cheaper
and
faster.
-‐ You
may
be
able
to
run
more
replicates,
which
is
important
for
sta7s7cal
power.
-‐ RNA-‐seq
has
a
wider
measurement
range.
-‐ Low
expressed
transcripts:
-‐ Microarrays
have
high
background
signal
-‐>
poor
measurement
-‐ RNA-‐seq
can
measure
well
if
you
sequence
very
deeply
-‐ Medium
expressed
transcripts:
-‐ Microarrays
measure
well
-‐ RNA-‐seq
measures
well
if
sequenced
rela7vely
deeply
-‐ High
expressed
transcripts:
-‐ Microarrays
measure
poorly
because
of
satura7on
-‐ RNA-‐seq
measures
well
-‐ Less
is
understood
about
how
to
pre-‐process
and
normalize
RNA-‐seq
data.
-‐ One
interes7ng
aspect
of
RNA-‐seq:
You
can
con7nue
to
sequence
a
sample
more
to
obtain
beUer
gene
expression
es7mates.
41. Analysis
-‐ Pre-‐processing
and
normaliza7on
-‐ Visualiza7on
-‐ Differen7al
gene
expression
analysis
-‐ ( Gene
set
analysis,
pathway
analysis,
gene
expression
signatures
…
-‐>
try
to
find
the
biological
significance)
42. Pre-‐processing
Why
do
we
do
pre-‐processing
and
normaliza7on
of
RNA-‐seq
(or
microarray)
data?
43. Pre-‐processing
Why
do
we
do
pre-‐processing
and
normaliza7on
of
RNA-‐seq
(or
microarray)
data?
-‐ To
correct
for
batch
effects
-‐ Different
labs
-‐ Different
prepara7on
7mes
-‐ Etc.
44. Pre-‐processing
Why
do
we
do
pre-‐processing
and
normaliza7on
of
RNA-‐seq
(or
microarray)
data?
-‐ To
correct
for
batch
effects
-‐ Different
labs
-‐ Different
prepara7on
7mes
-‐ Etc.
-‐ To
correct
for
intrinsic
technical
biases
in
the
technologies
45. Pre-‐processing
Why
do
we
do
pre-‐processing
and
normaliza7on
of
RNA-‐
seq
(or
microarray)
data?
-‐ To
correct
for
batch
effects
-‐ Different
labs
-‐ Different
prepara7on
7mes
-‐ Etc.
-‐ To
correct
for
intrinsic
technical
biases
in
the
technologies
-‐ To
make
the
expression
value
distribu7ons
conform
to
some
assump7ons
in
order
to
perform
sta7s7cal
tests
46. RNA-‐seq
pre-‐processing
For
RNA-‐seq
data,
it
is
s7ll
less
understood
than
for
microarrays
how
one
should
pre-‐process
and
normalize
the
data.
Let’s
look
at
some
aspects
(that
some7mes
apply
to
both
RNA-‐seq
and
microarray
data)
47. R
and
Bioconductor
Very helpful for (e.g.) microarray and RNA-seq
differential expression analysis
Microarray: RNA-seq:
affy, lumi (read raw microarray signal files DESeq, edgeR, baySeq,
& preprocess) (differential expression analysis
limma (differential expression analysis based on count data)
with complex designs) SAMSeq (nonparametric
differential expression analysis)
48. Variance
stabiliza5on
Raw data
(could be microarray signal or RNA-seq counts)
Higher value -> higher variability (noise)
Log transform
Lower value -> higher variability. Too aggressive
Variance stabilizing transform
e.g. voom() in limma package
http://bridgecrest.blogspot.se/2011_09_01_archive.html
49. Quan5fying
expression
with
RNA-‐seq
If
you
want
to
compare
RNA-‐seq
counts
between
different
genes
and/or
samples,
consider:
-‐ Longer
genes/transcripts
are
expected
to
generate
more
reads
-‐ The
more
you
sequence,
the
more
reads
you
get
from
each
gene
Therefore,
the
standard
measure
has
been
RPKM
(
),
which
corrects
for
transcript
length
and
sequencing
depth:
⎛ X t ⎞
⎜ l ⎟
10 9 ⋅ X t (Xt:
no
of
reads
mapped
to
transcript/gene/…
t
⎜ eff ,t ⎟
Nlib:
no
of
mapped
reads
in
library
RPKM
=
⎜ 10 3 ⎟
⎜ ⎟
=
N lib ⋅ leff ,t Leff,
t:
effec/ve
length
of
transcript/gene/…
t)
⎝ ⎠
⎛ N lib ⎞
⎜ 6 ⎟
⎝ 10 ⎠
€ €
FPKM is a paired-end version of this
50. Alterna5ves
TPM – “transcripts per million”
A slightly modified RPKM measure that
accounts for differences in gene length
distribution in the transcript population
51. Alterna5ves
TMM – “trimmed mean of M values”
Attempts to correct for differences in RNA composition between samples
E g if certain genes are very highly expressed in one tissue but not another, there will be less
“sequencing real estate” left for the less expressed genes in that tissue and RPKM normalization (or
similar) will give biased expression values for them compared to the other sample
RNA population 1 RNA population 2
Equal sequencing depth -> orange and red will get lower RPKM in RNA population 1 although the
expression levels are actually the same in populations 1 and 2
Robinson and Oshlack Genome Biology 2010, 11:R25, http://genomebiology.com/2010/11/3/R25
55. Prac5cal
issues
with
normaliza5on
methods
Limma / voom can give negative values
TMM cannot be done on a single sample
56. RNA-‐seq
pre-‐processing
In
RNA-‐seq,
normaliza7on
of
counts
is
oven
interwoven
with
differen7al
expression
analysis
and
done
implicitly
in
DE
packages
such
as
DESeq,
edgeR
etc.
Normalized
values
like
RPKM
are
usually
only
used
for
repor7ng
expression
values,
not
tes7ng
for
differen7al
expression.
Why?
57. Count
nature
of
RNA-‐seq
data
These
methods
want
to
use
the
added
sta7s7cal
power
provided
by
the
count
nature
of
RNA-‐seq
data.
Simplified
toy
example:
Scenario 1: A 30000-bp transcript has 1000 counts in sample A and 700 counts
in sample B.
Scenario 2: A 300-bp transcript has 10 counts in sample A and 7 counts in
sample B.
Assume that the sequencing depths are the same in both samples and both
scenarios. Then the RPKM is the same in sample A in both scenarios, and in
sample B and both scenarios.
In scenario A, we can be more confident that there is a true difference in the
expression level than in scenario B (although we would want more replicates of
course!) by analogy to a coin flip – 700 heads out of 1000 trials gives much more
confidence that a coin is biased than 7 heads out of 10 trials
58. Visualiza5on
Can
be
useful
for
“sanity
checking”,
outlier
detec7on
and
exploratory
analysis
in
general
Examples
of
useful
visualiza7ons
-‐ Heat
maps
-‐ PCA/MDS/NMF
-‐ Box
plots,
violin
plots
etc.
59. Box
plots
Useful for comparing groups
Adding the actual data points is optional but can be interesting
60. Sample
correla5on
heat
maps
Heat maps are ubiquitous in transcriptomics
Correlations between samples, hierarchical clustering
Used for “sanity checks”, outlier detection
Two tissues Batch effects
61. Gene
/
sample
heat
maps
With a smaller
collection of genes,
one sometimes looks
at gene/sample heat
maps
63. PCA
plots
Nice thing with PCA: you can also see how much each gene contributes to each
principal component -> a kind of feature selection
64. Alterna5ves
to
PCA
NMF: non-negative matrix factorization. Also a matrix decomposition technique (like
PCA)
“A bioinformatic assay for pluripotency in human cells”, Nature Methods: doi.10.1038/nmeth.1580
65. PCA
plot
of
human
5ssue
RNA-‐seq
Red – GTex
Green – Body Map
Black – Human Protein Atlas
66. #
of
genes
taking
up
X%
of
sequences
GTex RPKM
HBA1
HBB
HBA2
68. #
of
genes
taking
up
X%
of
sequences
Wang/Sandberg
69. Differen5al
expression
analysis
Many tools available!
Easily the most common type of analysis, even though it is understood that
gene expression levels are not independent of each other, and should in
principle be considered together.
However, since the number of samples is typically << the number of
measured genes, a full model is usually not feasible to construct in practice.
Some sort of feature selection is needed.
71. Differen5al
expression
analysis
One would simply like to do a t-test or something like that for each gene, but
…
- Assumes normal distribution & no mean-variance dependence
72. Differen5al
expression
analysis
One would simply like to do a t-test or something like that for each gene, but
…
- Assumes normal distribution & no mean-variance dependence
- Hard to estimate variance from few samples
73. Differen5al
expression
analysis
One would simply like to do a t-test or something like that for each gene, but
…
- Assumes normal distribution & no mean-variance dependence
- Hard to estimate variance from few samples
- Multiple testing issue
74. Parametric
vs.
non-‐parametric
methods
It would be nice to not have to assume anything about the expression value
distributions but only use rank-order statistics. -> methods like SAM
(Significance Analysis of Microarrays) or SAM-seq (equivalent for RNA-seq data)
However, it is (typically) harder to show statistical significance with non-
parametric methods with few replicates.
My rule of thumb:
- Many replicates (~ >10) in each group -> use SAM(Seq)
- Otherwise use DESeq or other parametric method
Note that according to Simon Anders (creator of DESeq) says that non-
parametric methods are definitely better with 12 replicates and maybe already at
five
http://seqanswers.com/forums/showpost.php?p=74264&postcount=3
76. Standard
DE
methods
Limma (microarrays, RNA-seq)
edgeR, DESeq (RNA-seq)
Distributional issue: Solved by variance stabilizing transform in limma
edgeR and DESeq model the count data using a negative binomial distribution and
use their own modified statistical tests based on that.
77. Standard
DE
methods
Limma (microarrays, RNA-seq)
edgeR, DESeq (RNA-seq)
Distributional issue: Solved by variance stabilizing transform in limma
edgeR and DESeq model the count data using a negative binomial distribution and
use their own modified statistical tests based on that.
Multiple testing issue: All of these packages report false discovery rate (corrected
p values).
78. Standard
DE
methods
Limma (microarrays, RNA-seq)
edgeR, DESeq (RNA-seq)
Distributional issue: Solved by variance stabilizing transform in limma
edgeR and DESeq model the count data using a negative binomial distribution and
use their own modified statistical tests based on that.
Multiple testing issue: All of these packages report false discovery rate (corrected
p values).
Variance estimation issue: These packages (in slightly different ways) “borrow”
information across genes to get a better variance estimate. One says that the
estimates “shrink” from gene-specific estimates towards a common mean value.
79. Standard
DE
methods
Limma (microarrays, RNA-seq)
edgeR, DESeq (RNA-seq)
Distributional issue: Solved by variance stabilizing transform in limma
edgeR and DESeq model the count data using a negative binomial distribution and
use their own modified statistical tests based on that.
Multiple testing issue: All of these packages report false discovery rate (corrected
p values).
Variance estimation issue: These packages (in slightly different ways) “borrow”
information across genes to get a better variance estimate. One says that the
estimates “shrink” from gene-specific estimates towards a common mean value.
81. Complex
designs
The simplest case is when you just want to compare two groups against each other.
But what if you have several factors that you want to control for?
E.g. you have taken tumor samples at two different time points from six patients,
cultured the samples and treated them with two different anticancer drugs and a mock
control treatment. -> 2x6x3 = 36 samples.
Now you want to assess the differential expression in response to one of the
anticancer drugs, drug X. You could just compare all “drug X” samples to all control
samples but the inter-subject variability might be larger than the specific drug effect.
Enter limma / DESeq / edgeR which can work with factorial designs
(SAMSeq cannot, which is another reason one might not want to use it)
82. Limma
and
factorial
designs
limma stands for “linear models for microarray analysis”
Essentially, the expression of each gene is modeled with a linear relation
http://www.math.ku.dk/~richard/courses/bioconductor2009/handout/19_08_Wednesday/KU-August2009-LIMMA/PPT-PDF/Robinson-limma-linear-models-ku-2009.6up.pdf
The design matrix describes all the conditions, e g treatment, patient, time etc
y = a + b*treatment + c*time + d*patient + e
Baseline/average Error term/noise
84. Take-‐away
messages
from
DE
tool
comparison
- CuffDiff2, which should theoretically be better, seems to work worse, probably
due to the increased “statistical burden” from isoform expression estimation
- The HTSeq quantification which is theoretically “wrong” seems to give good
results with downstream software
- It is practically always better to sequence more biological replicates than to
sequence the same samples deeper
Omitted from this comparison
- gains from ability to do complex designs
- non-parametric methods
85. The
end
Contact me at mikael.huss@scilifelab.se if you have any questions