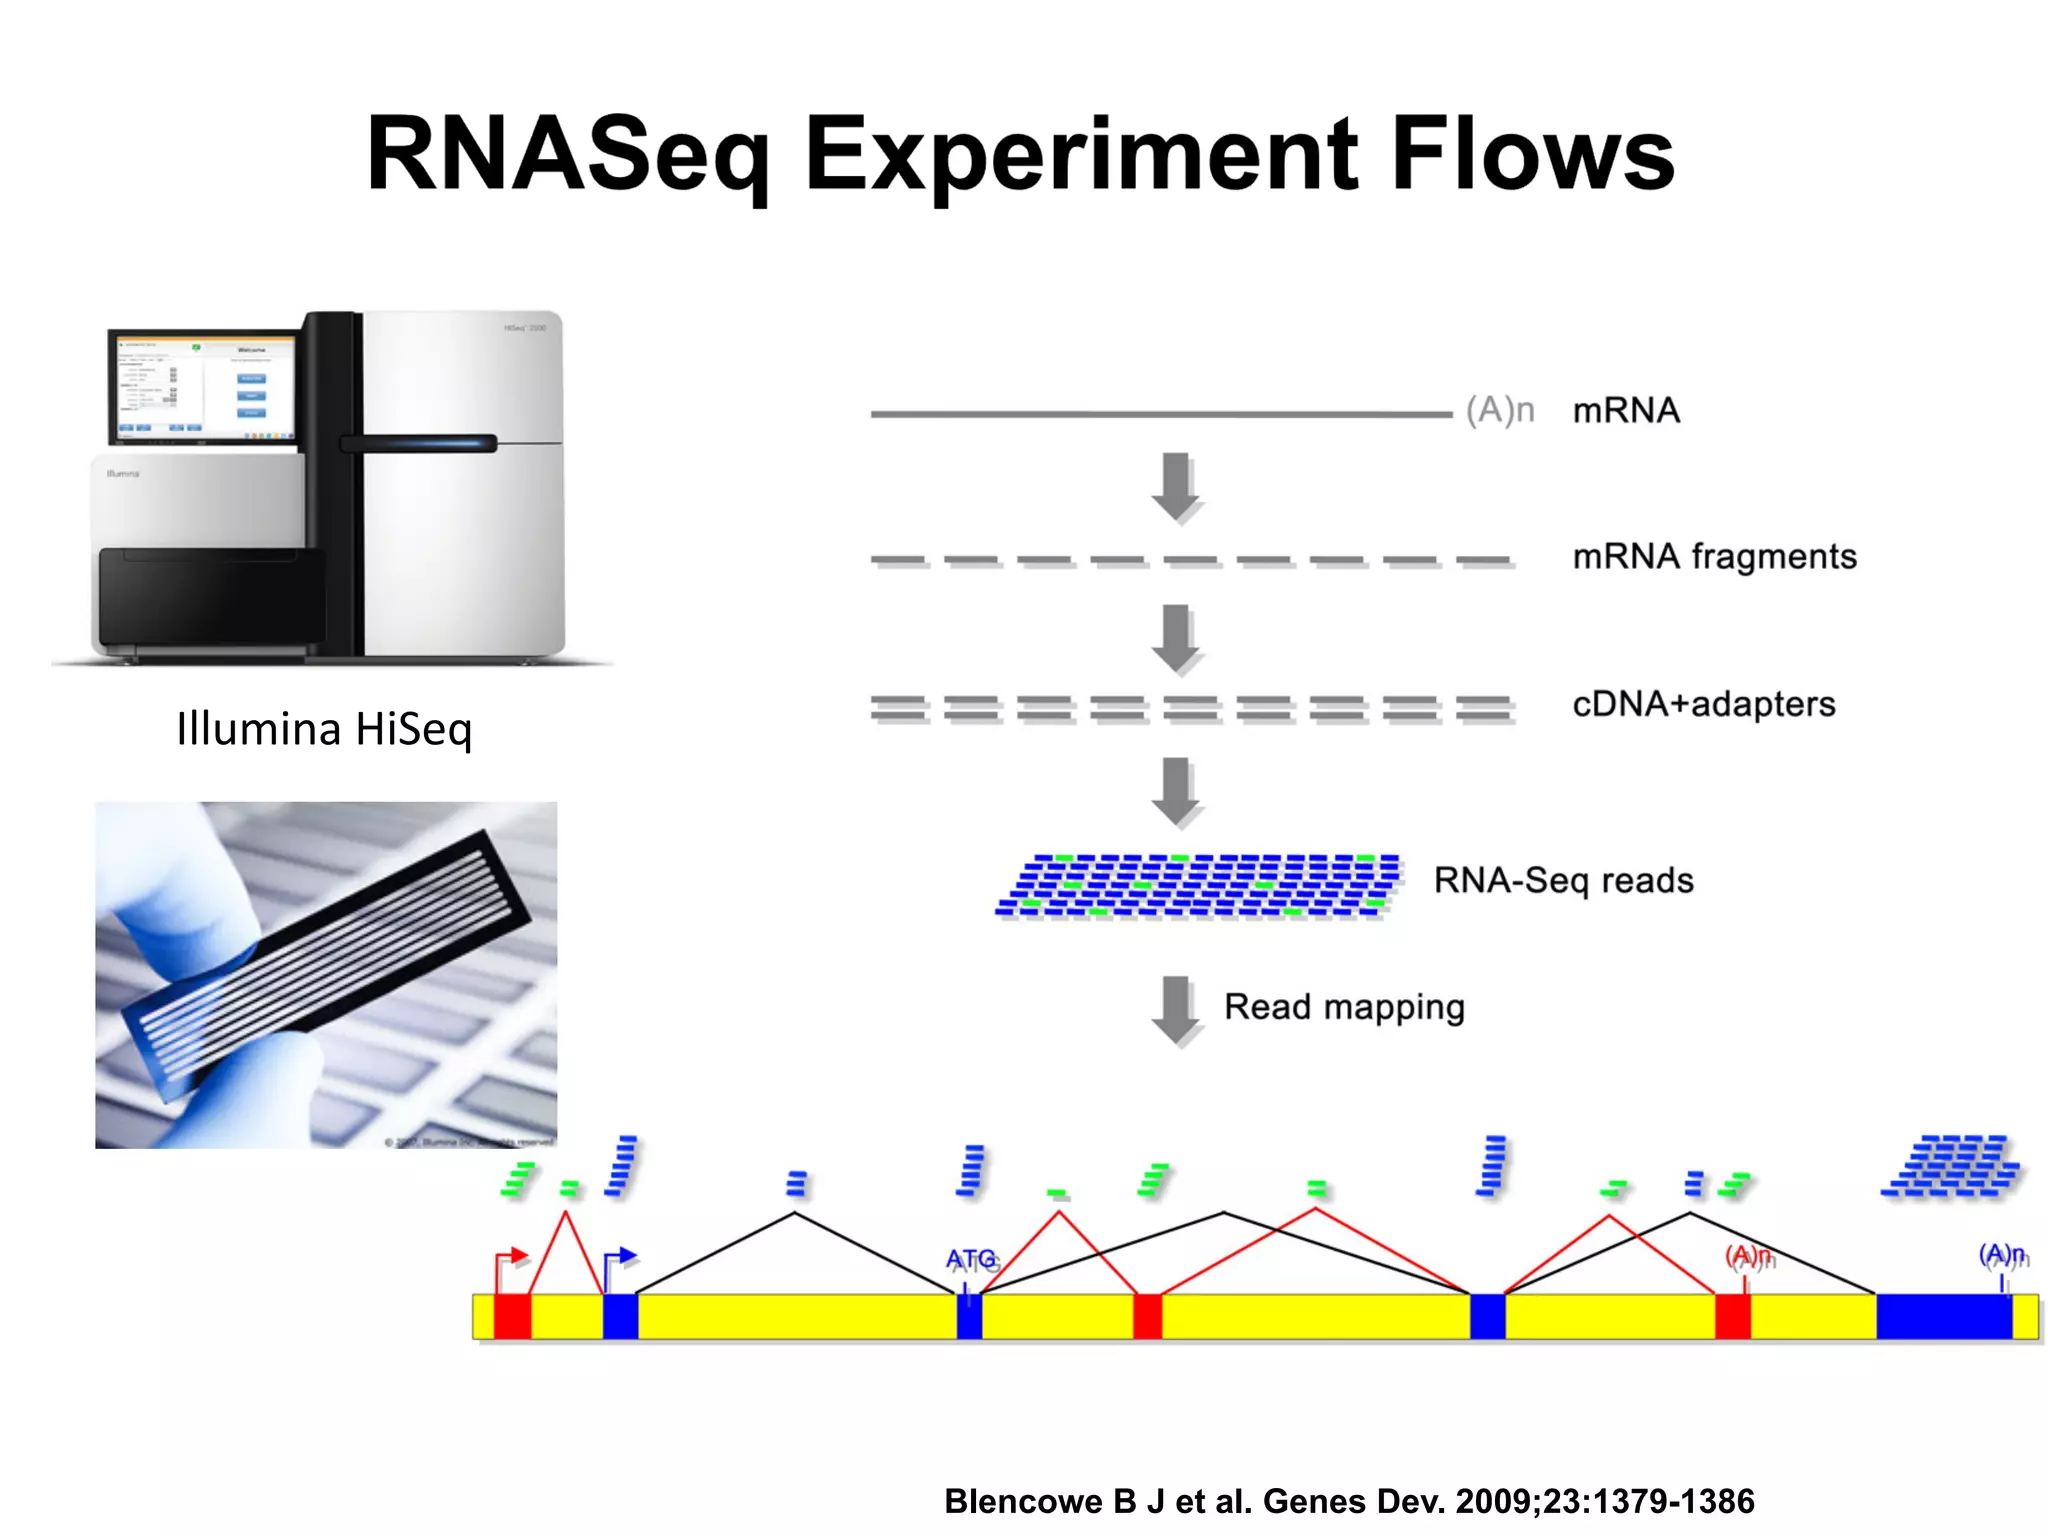
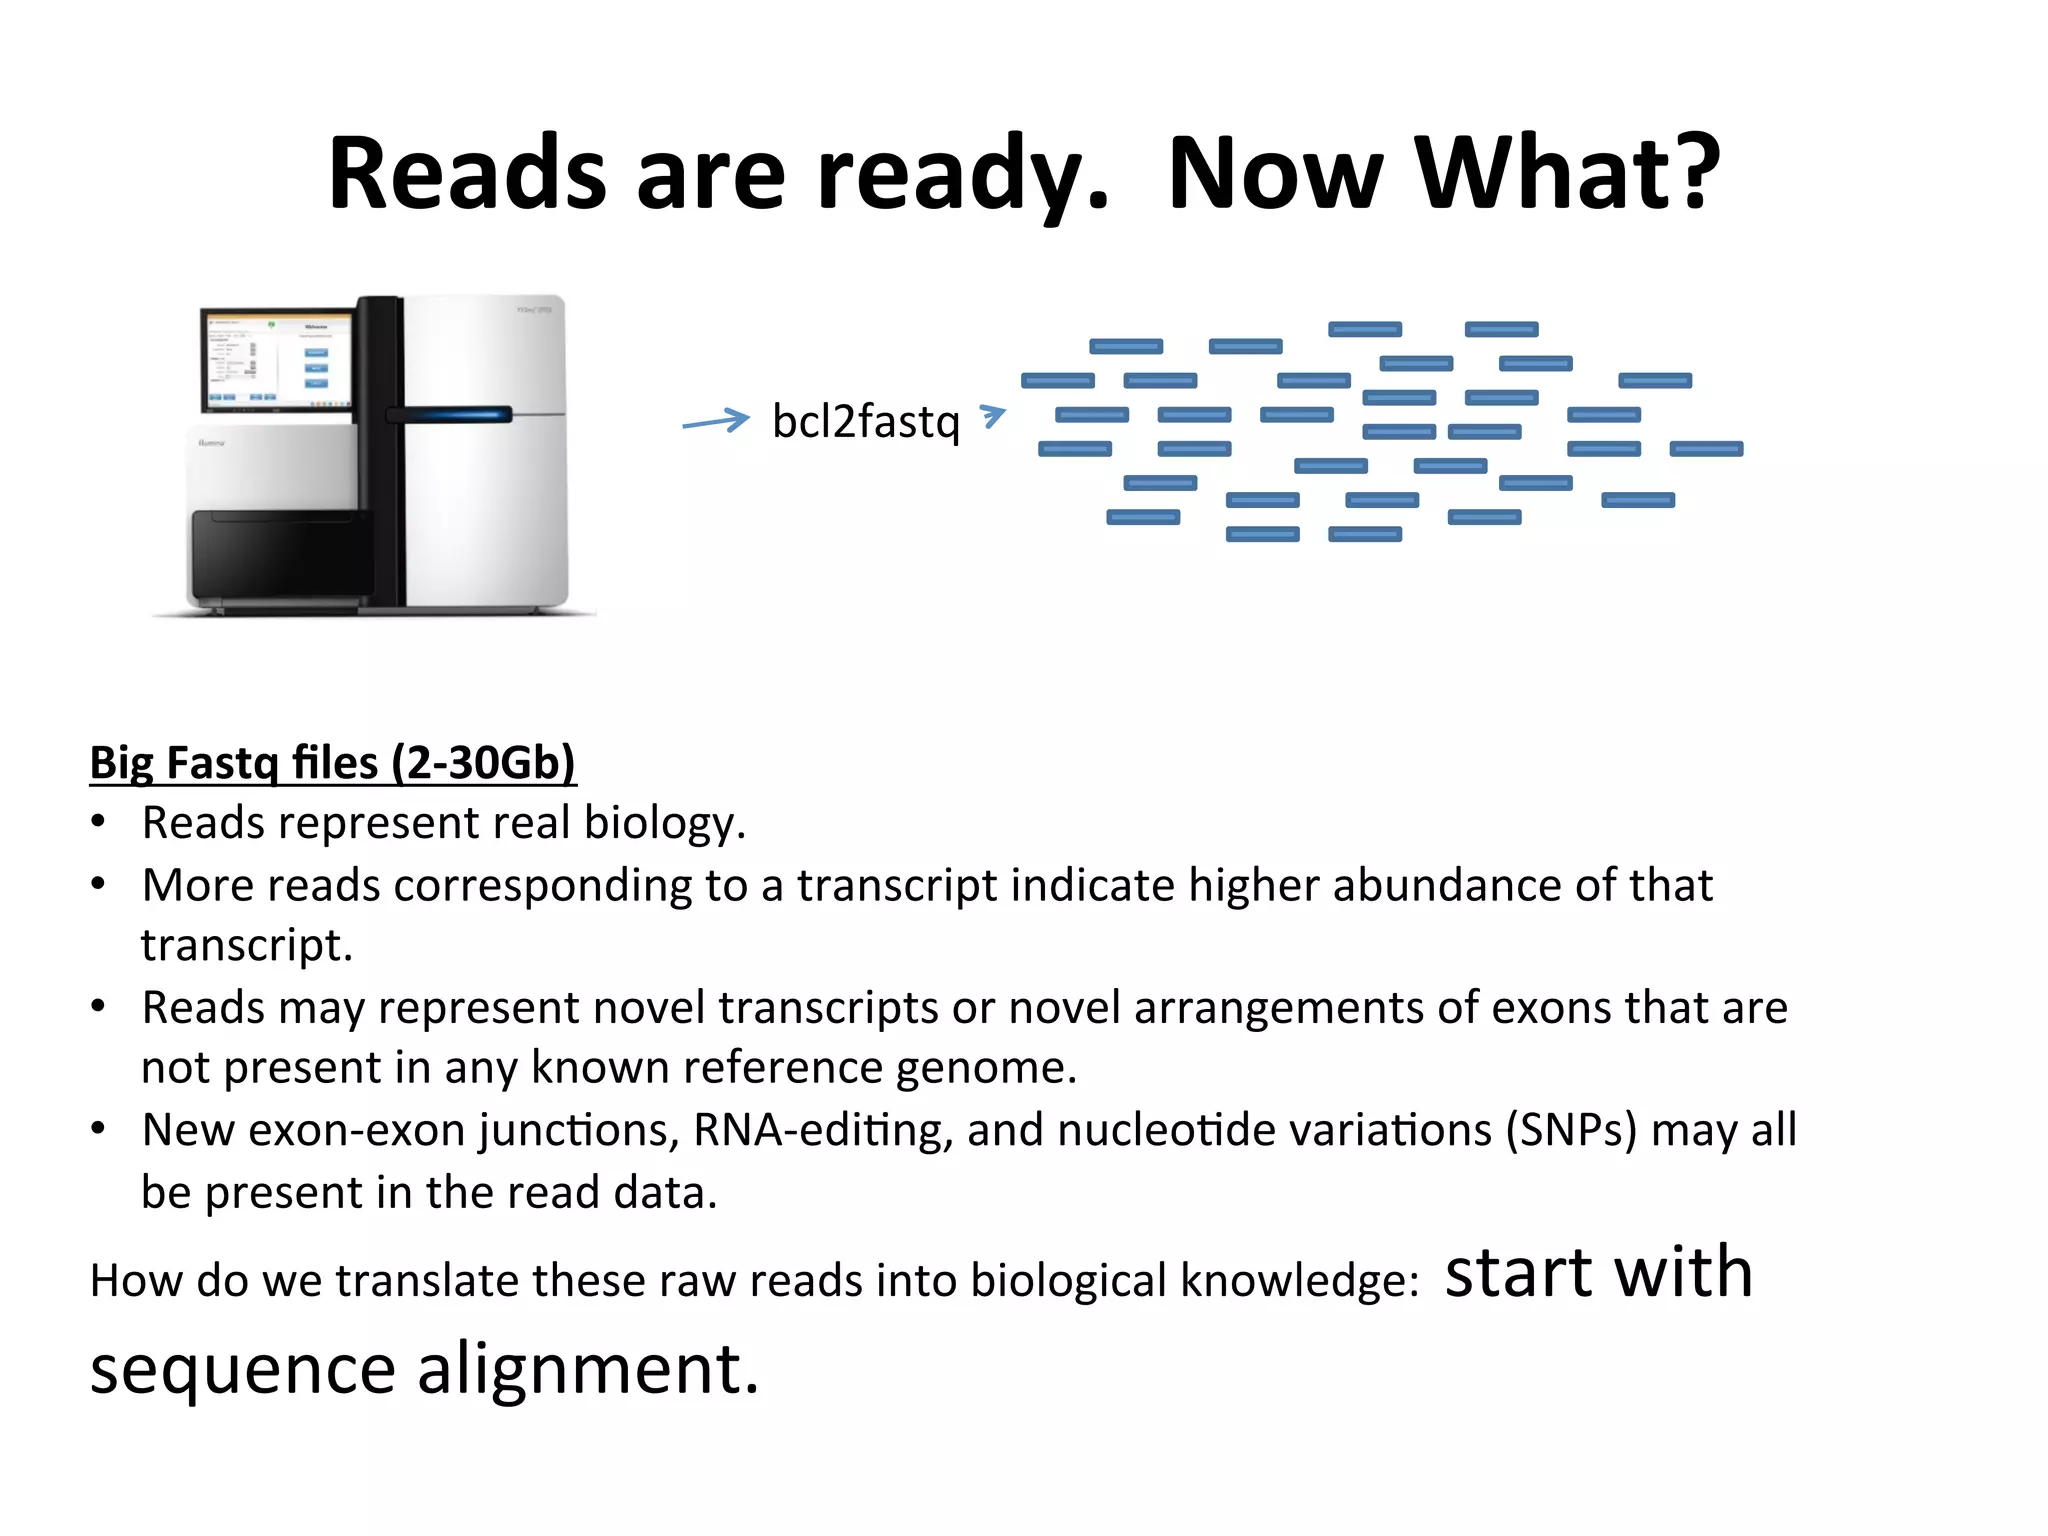
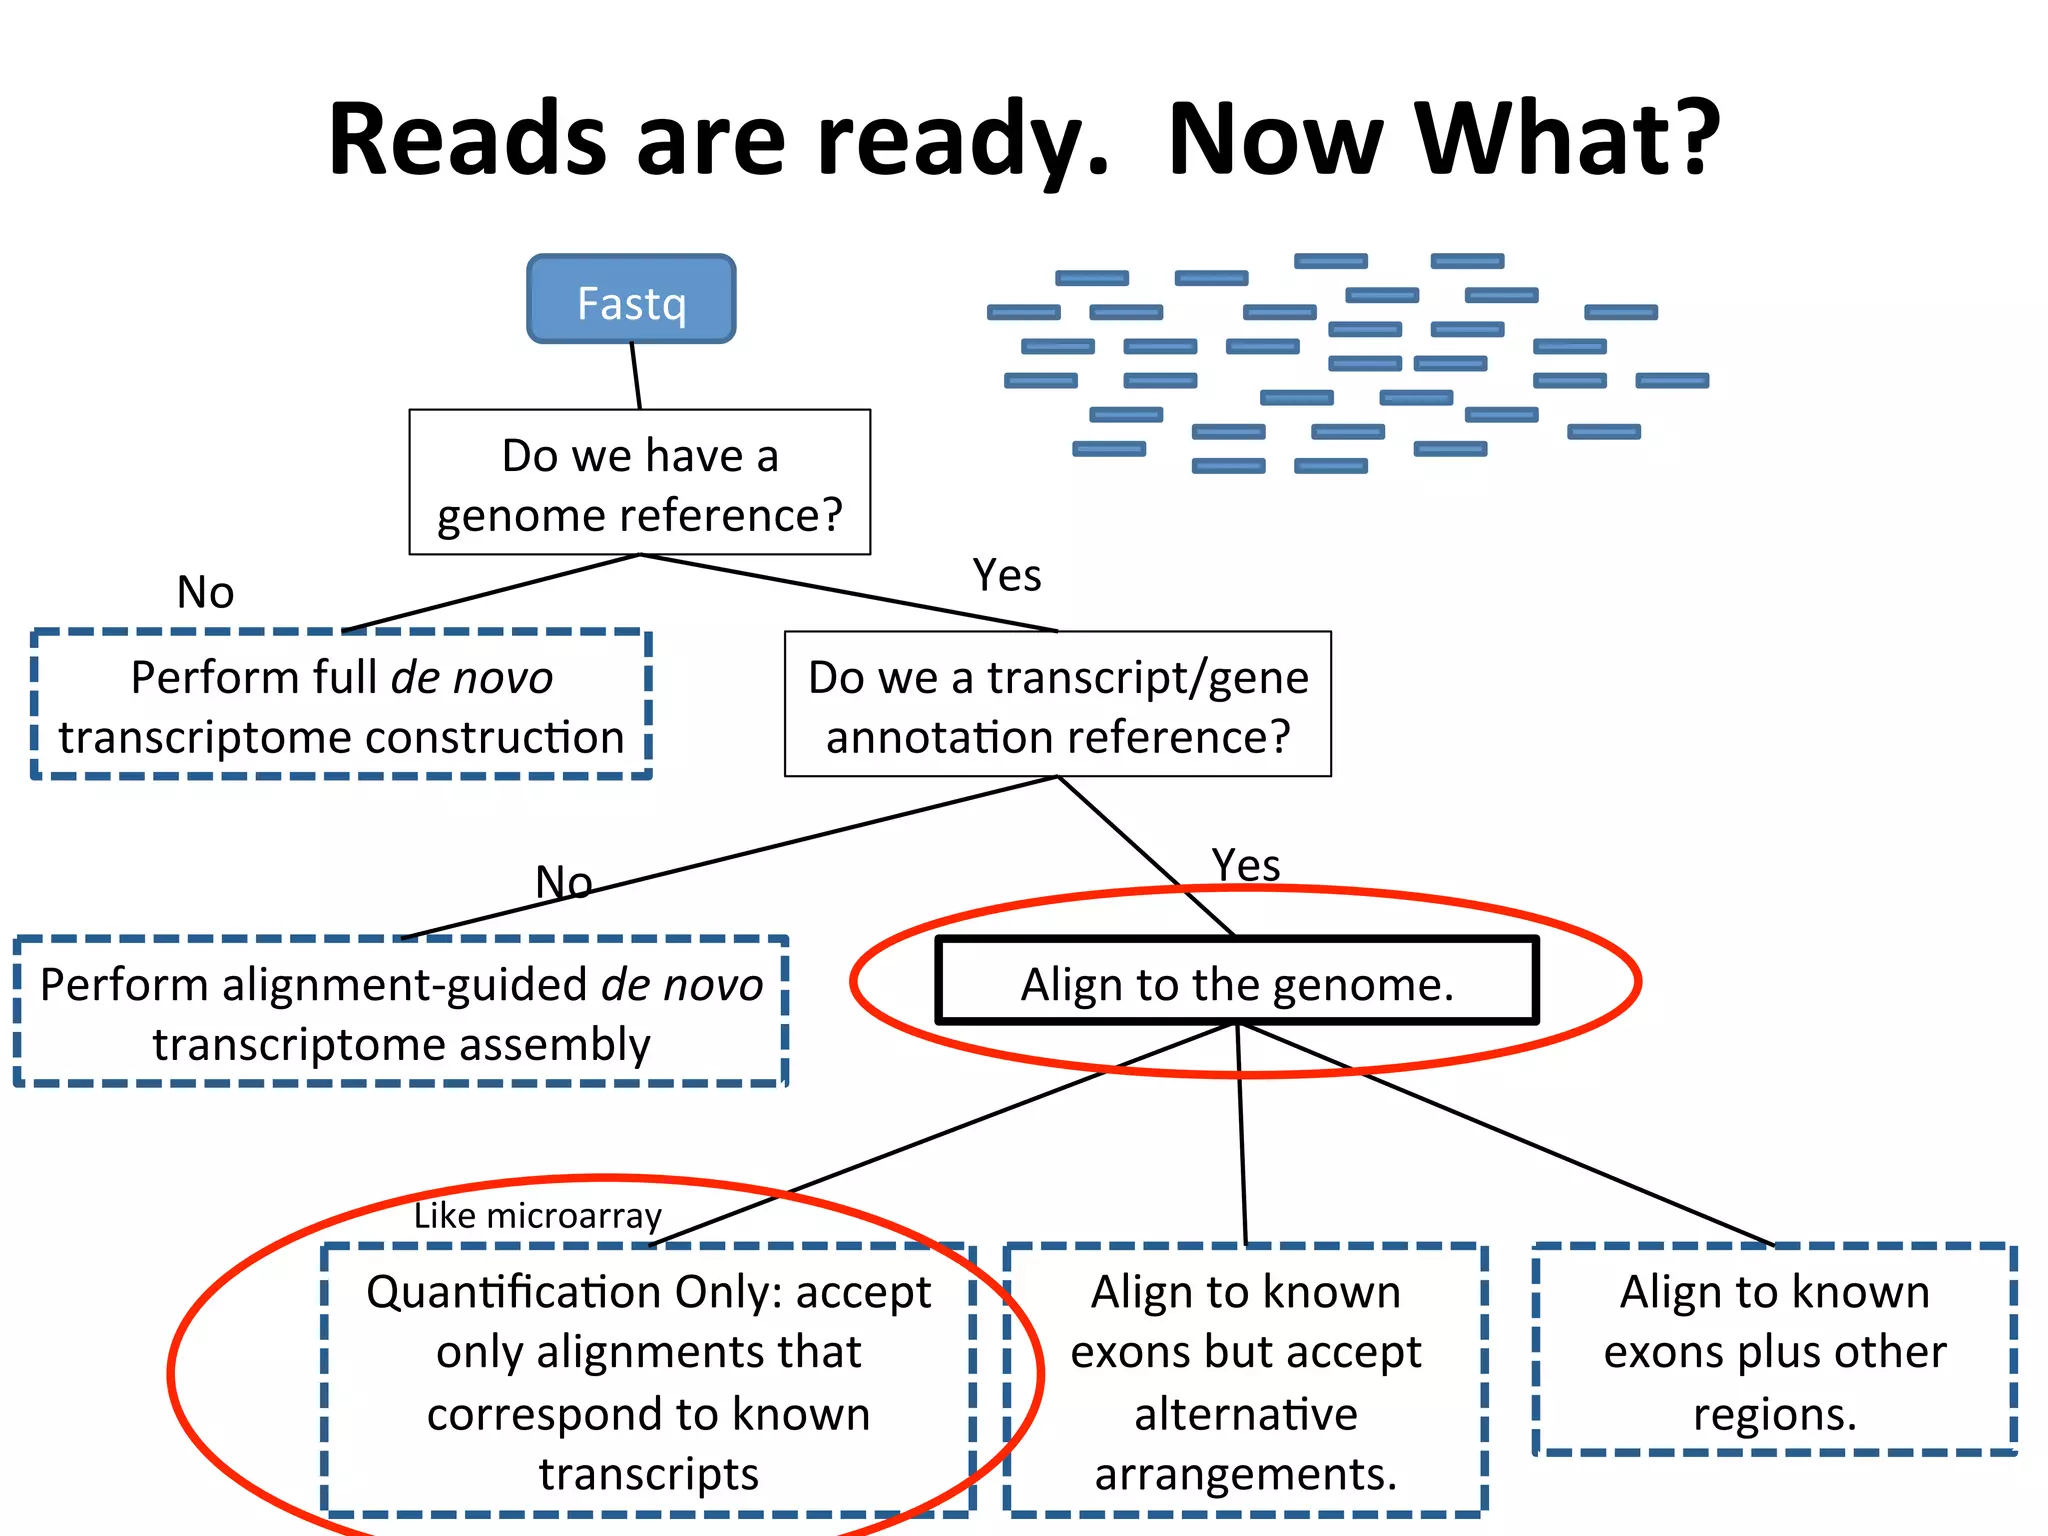
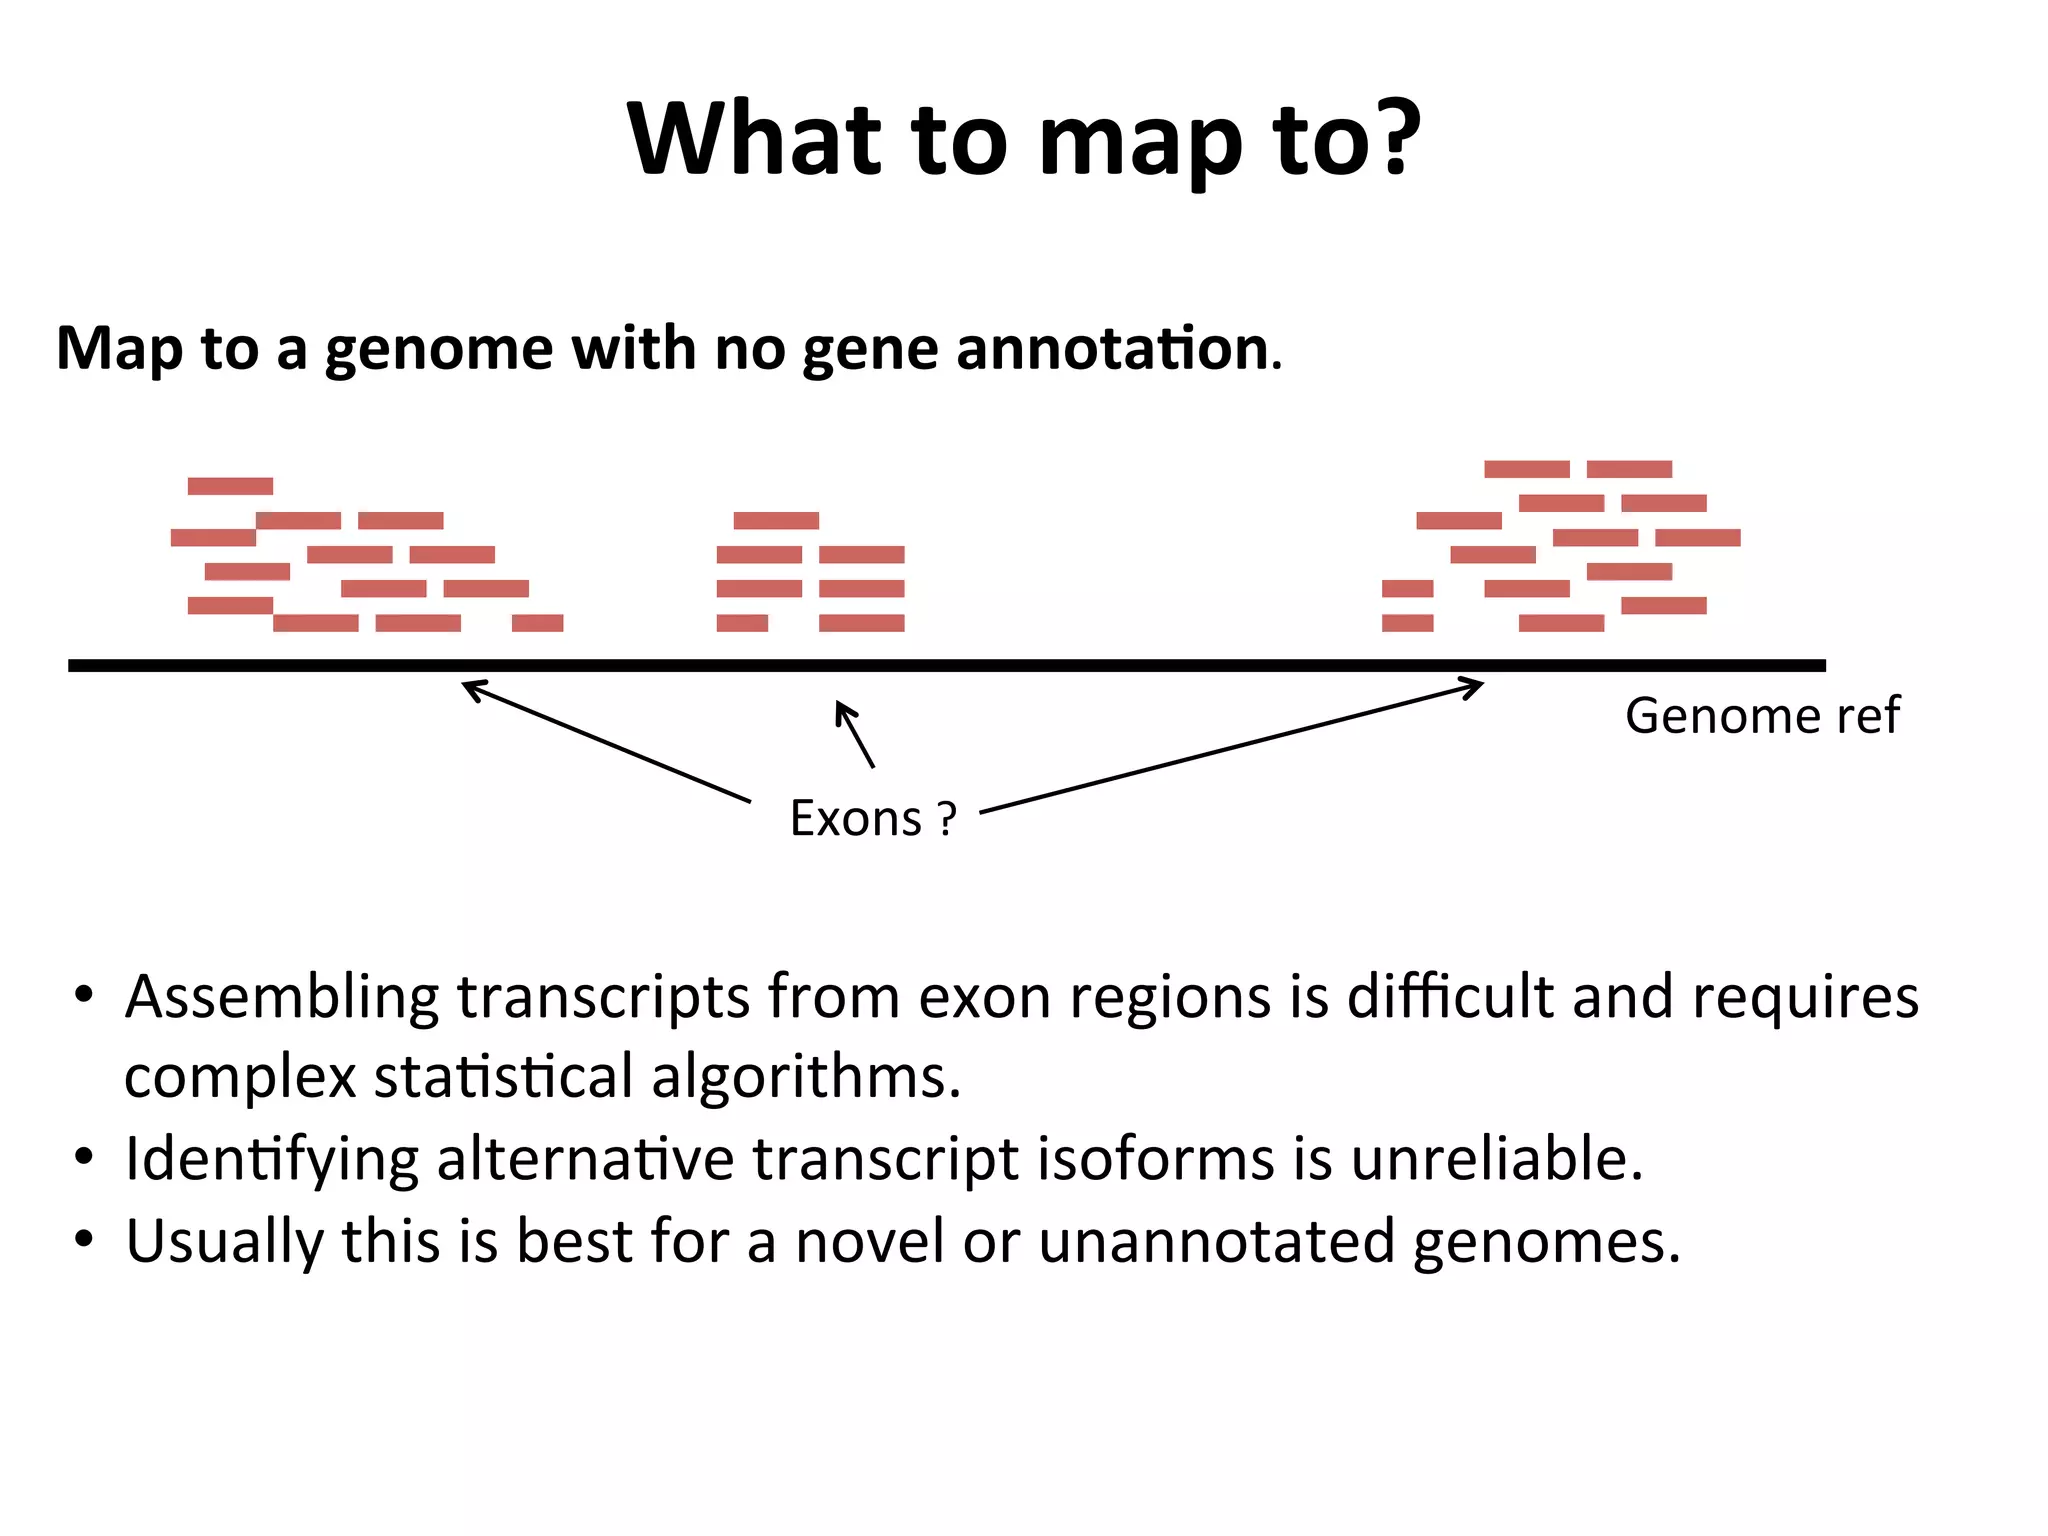
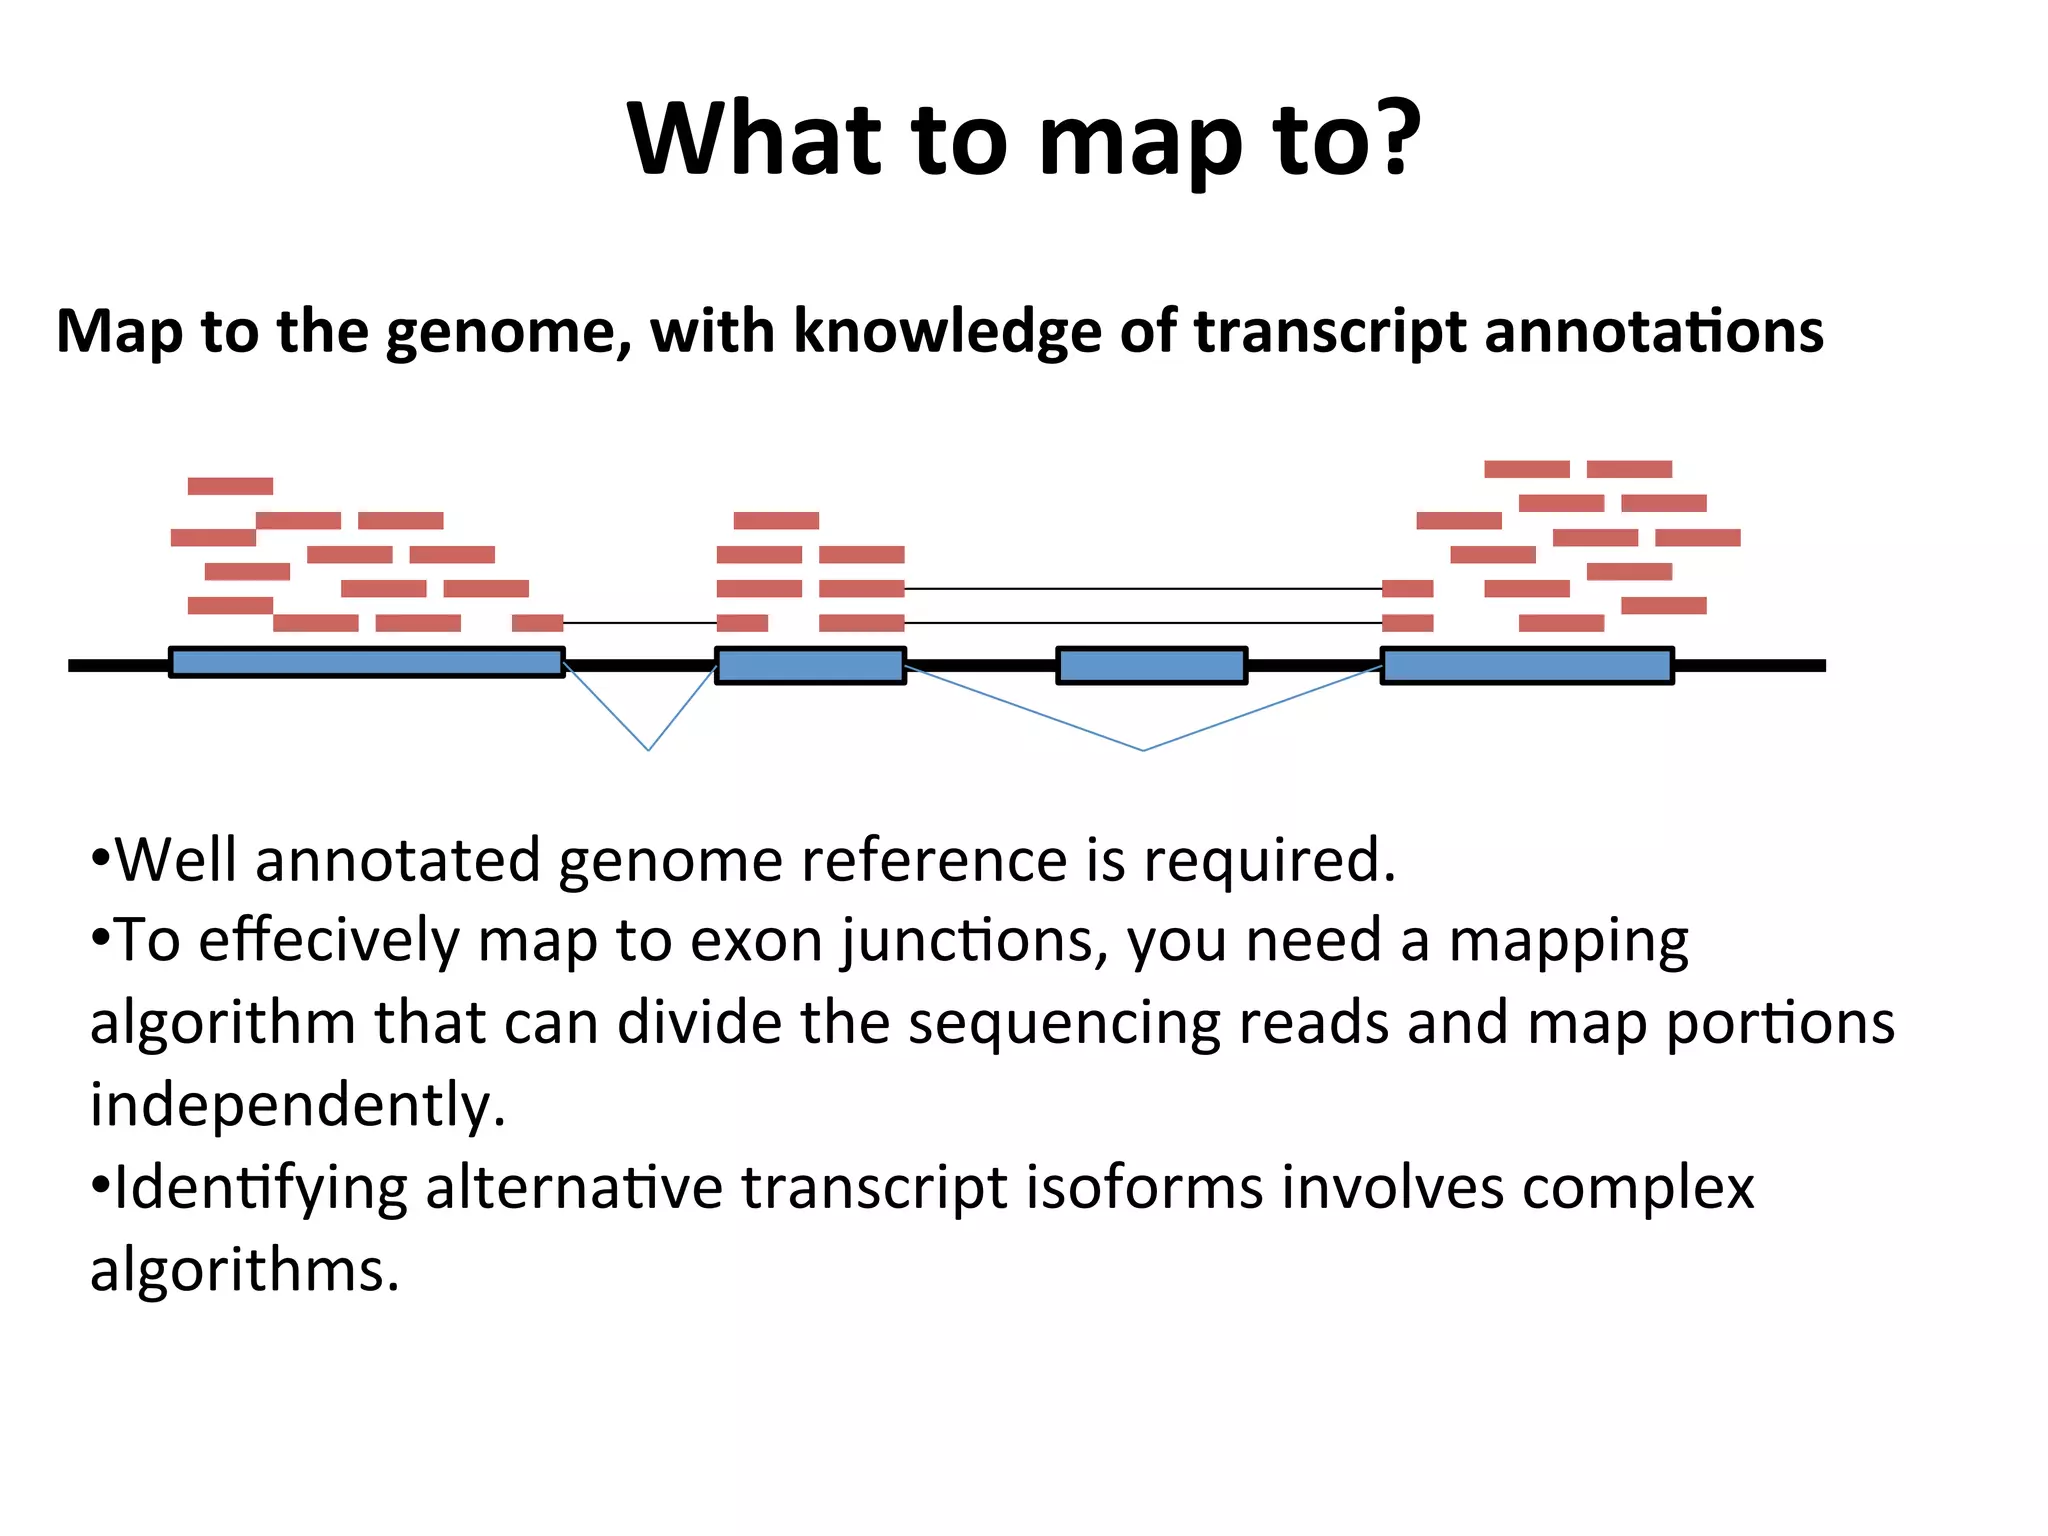
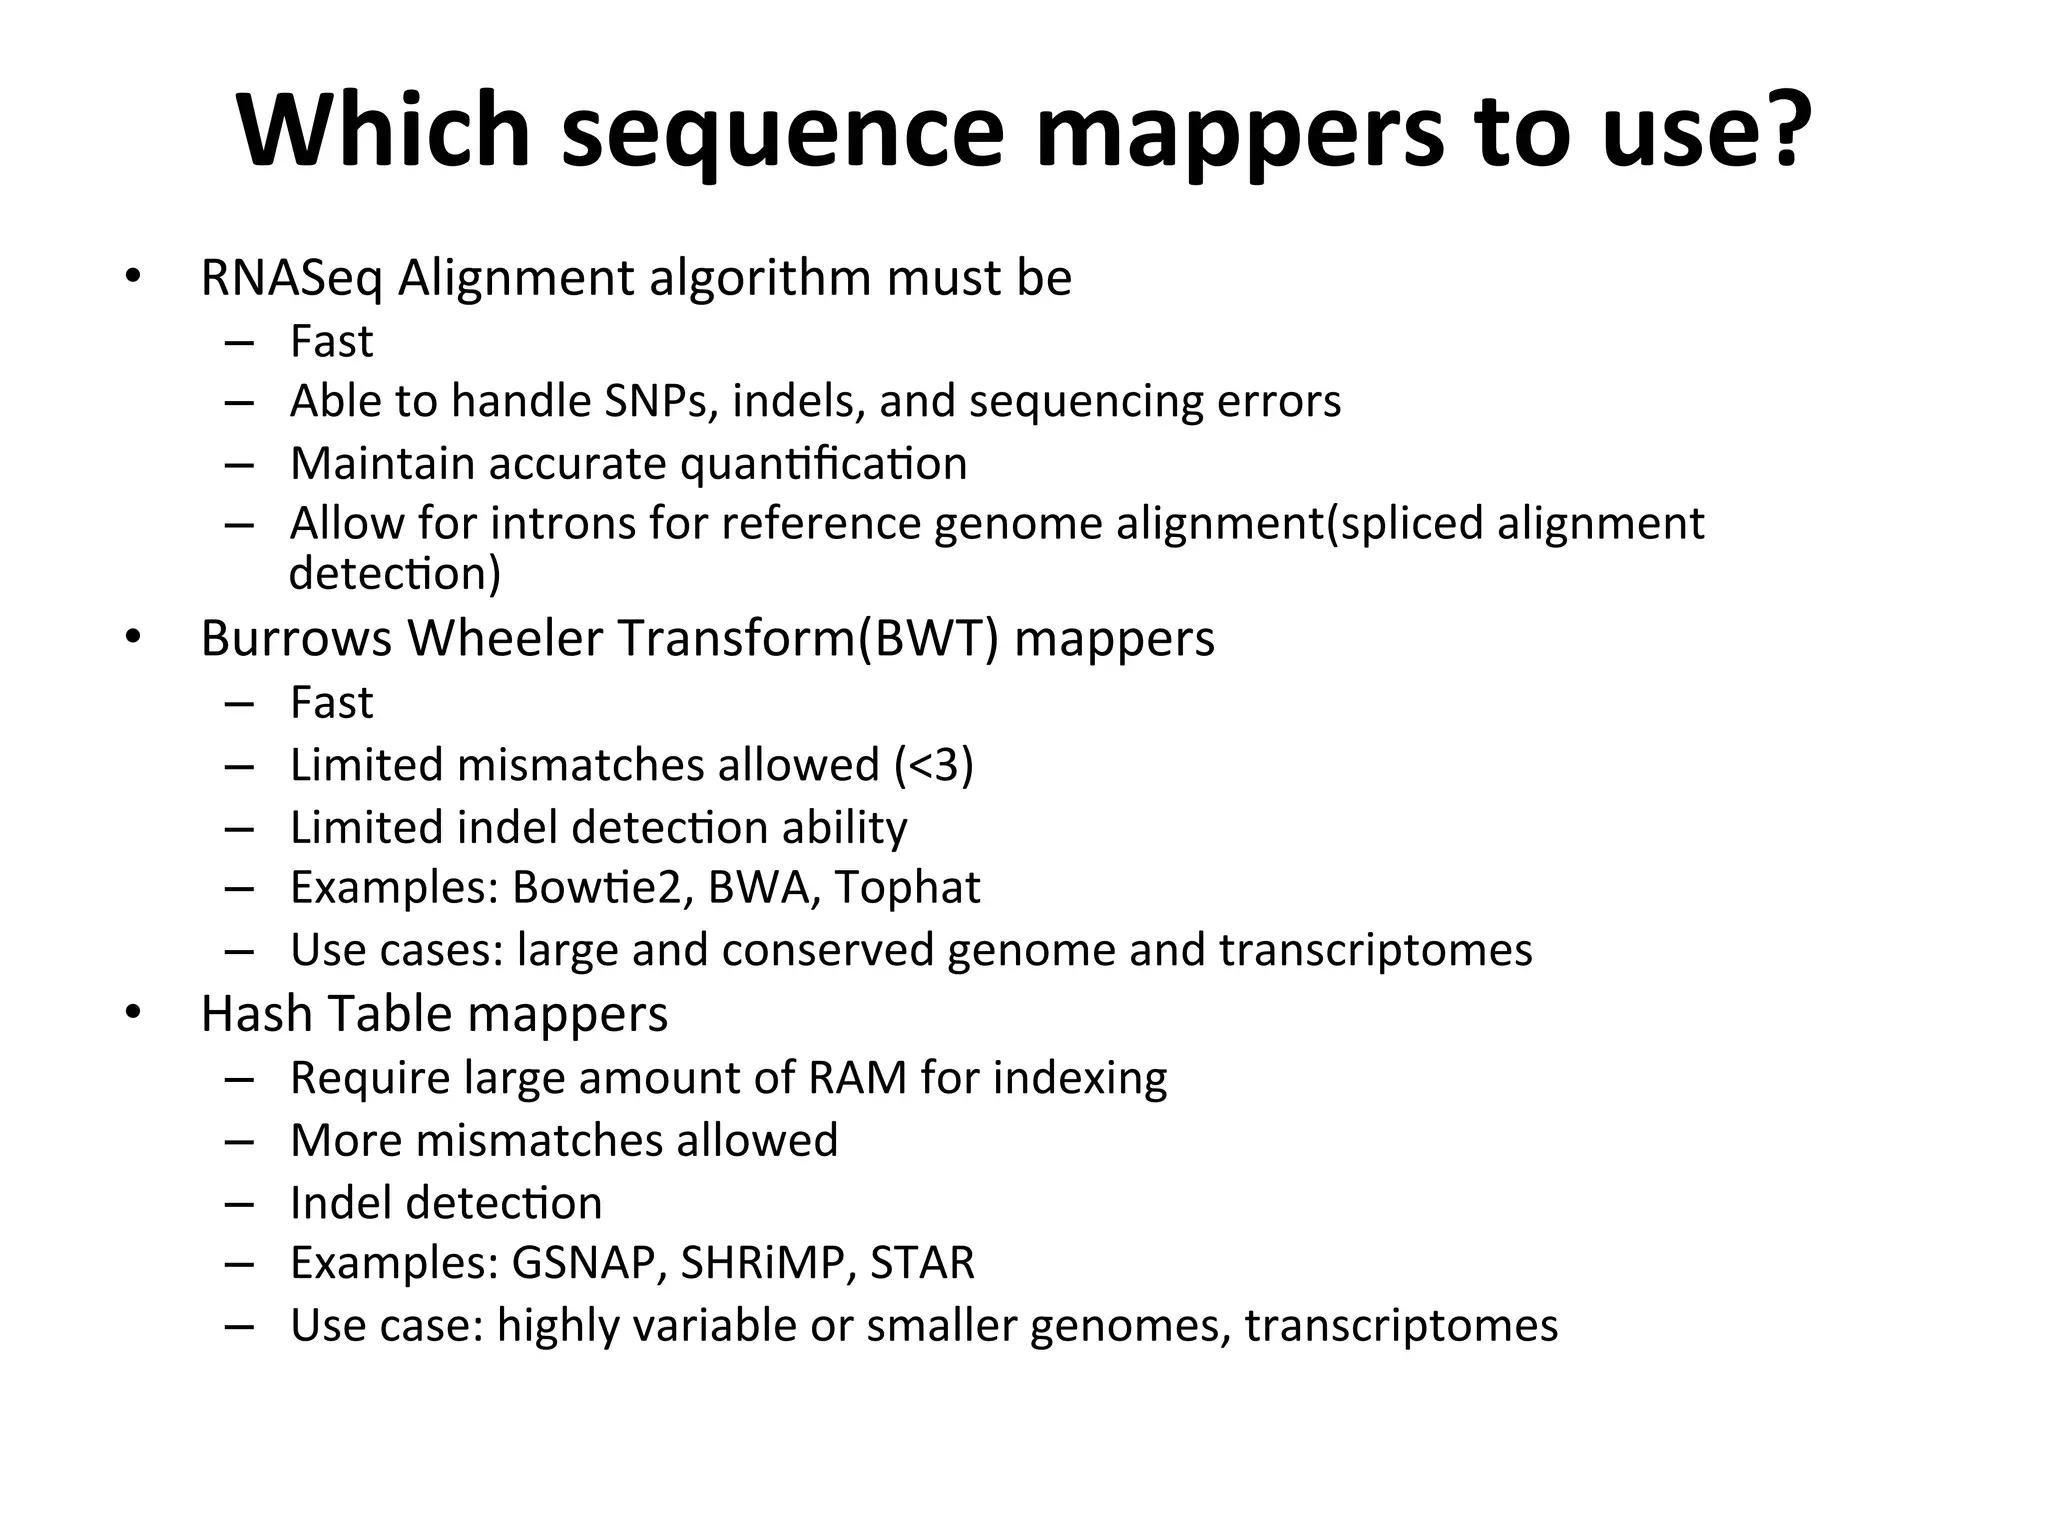
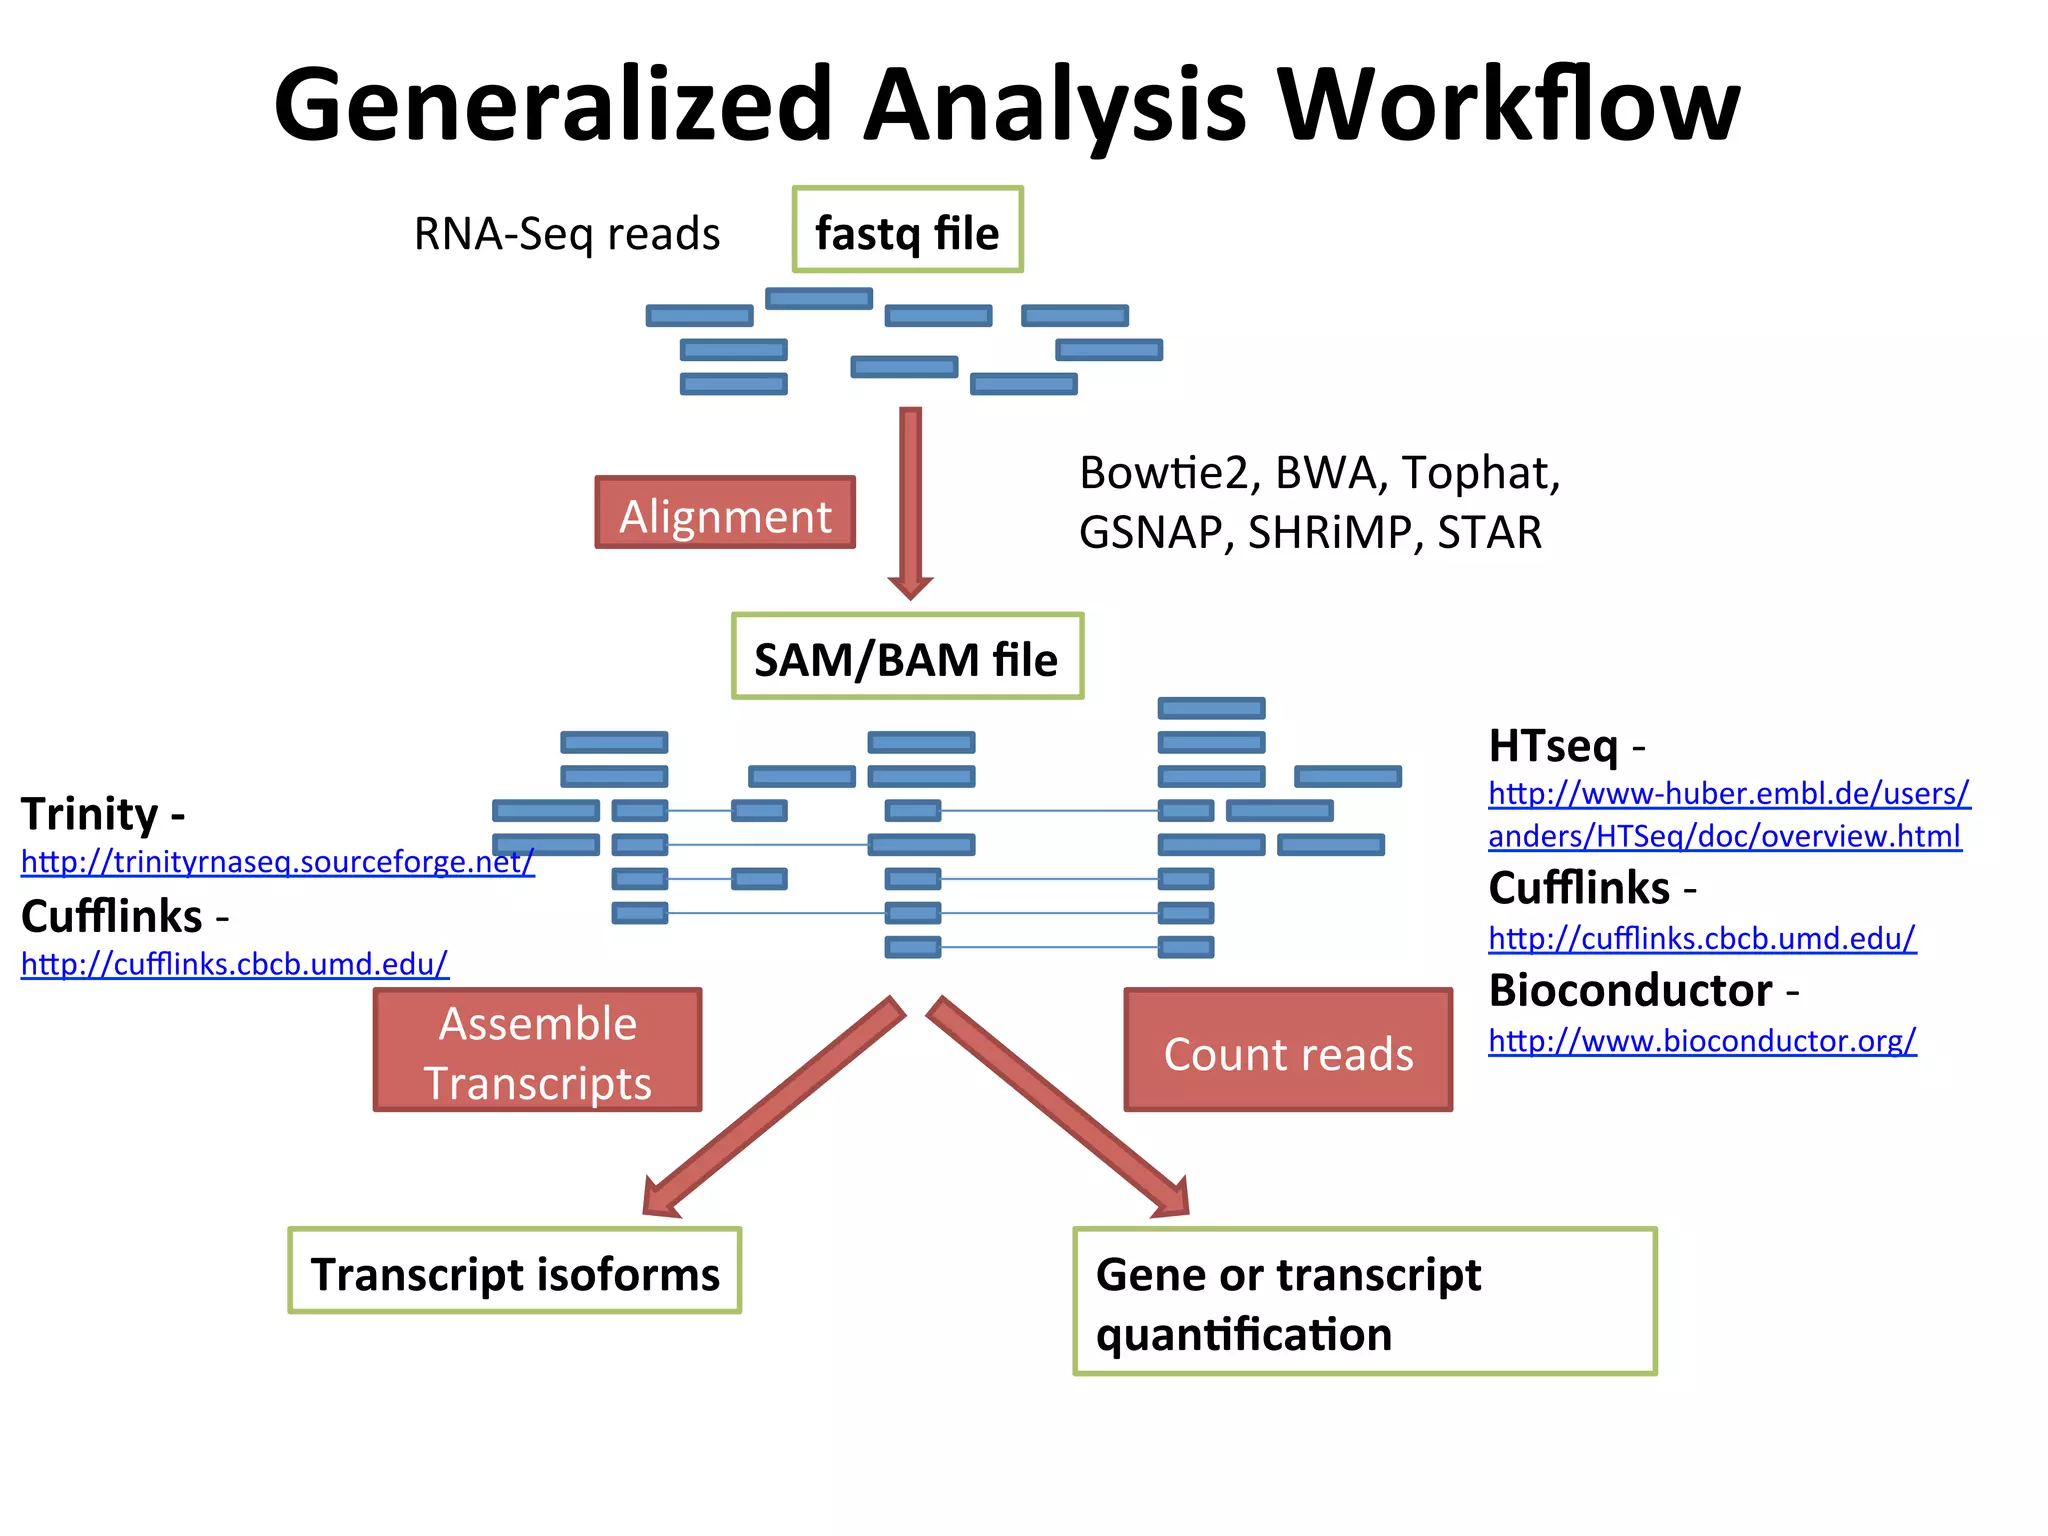
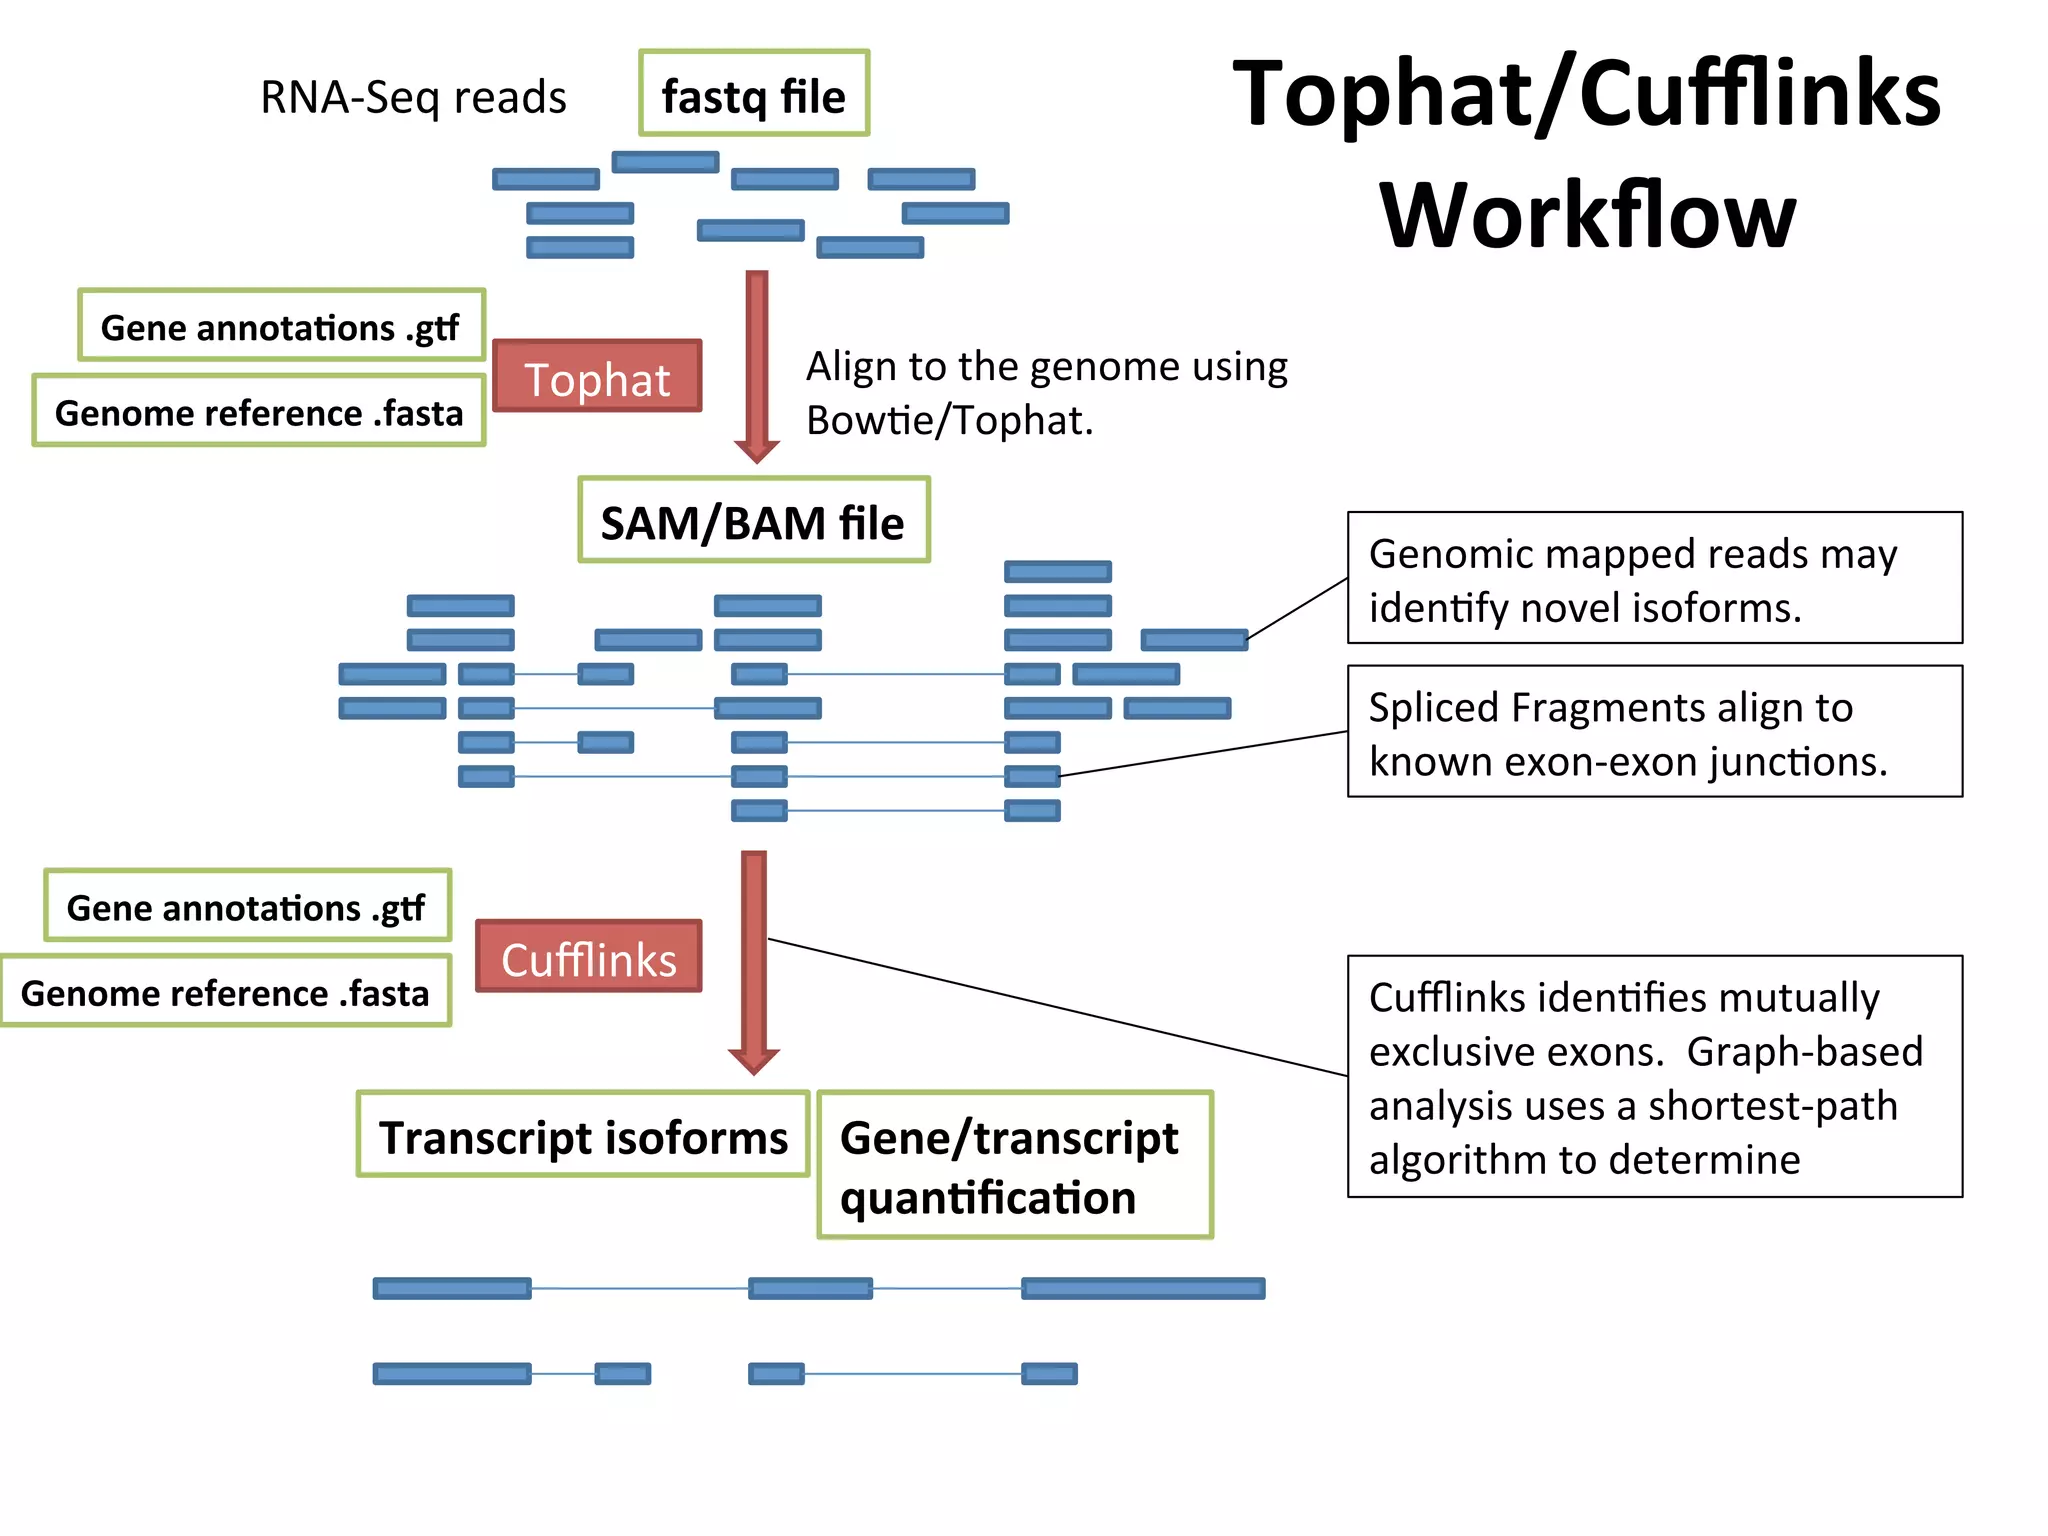
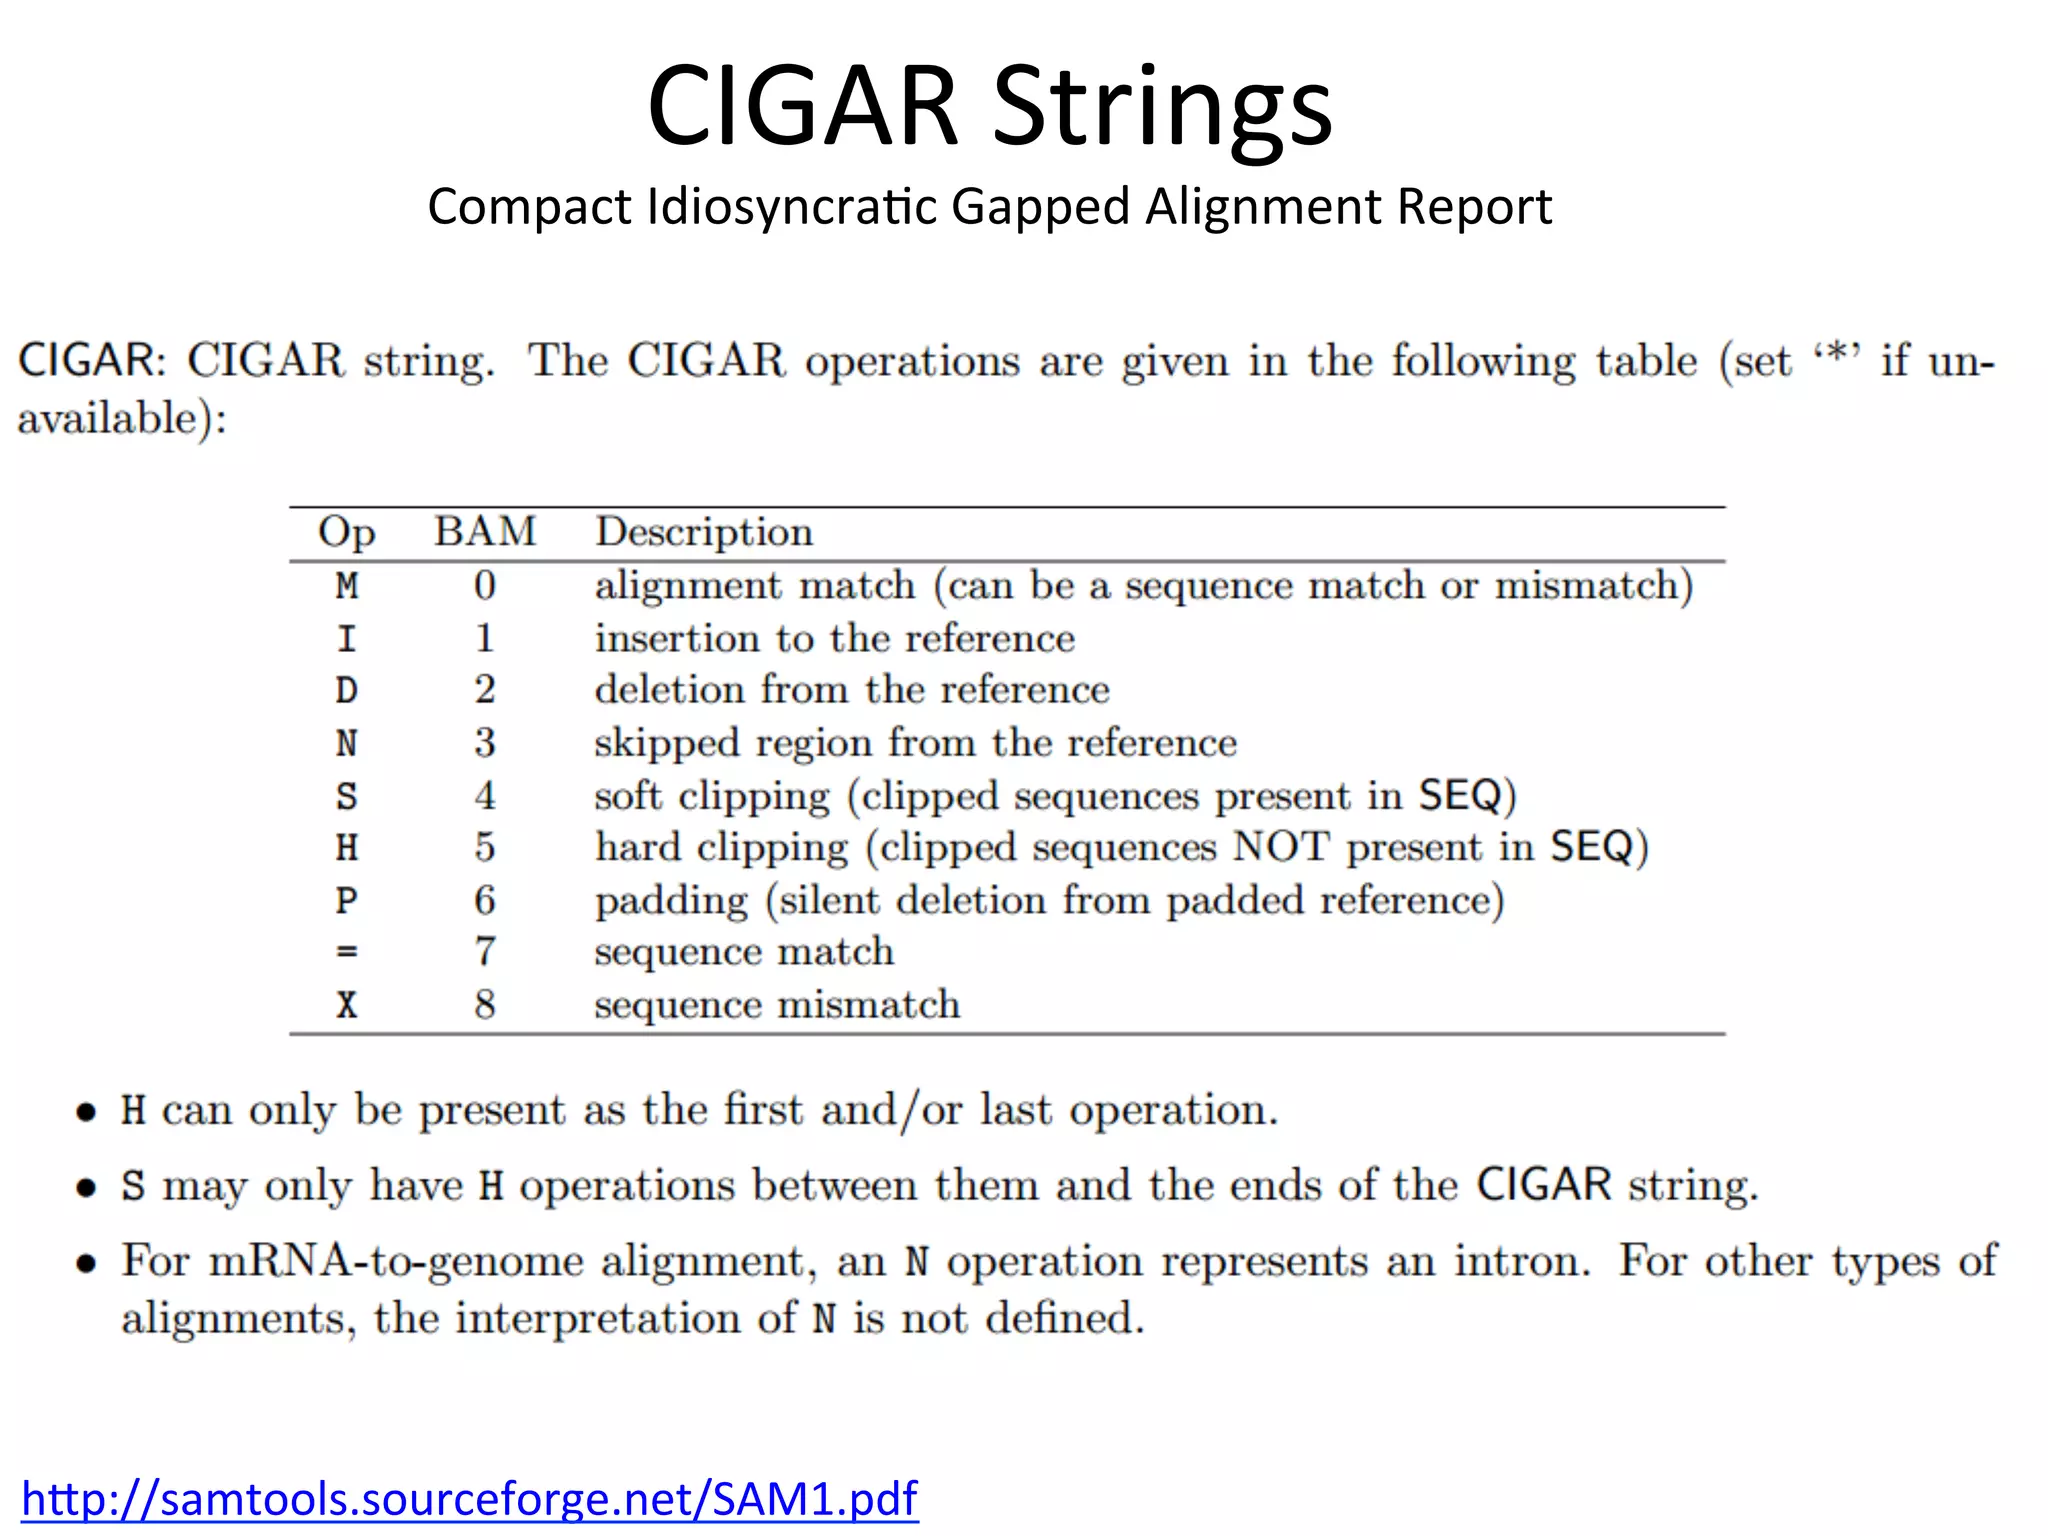
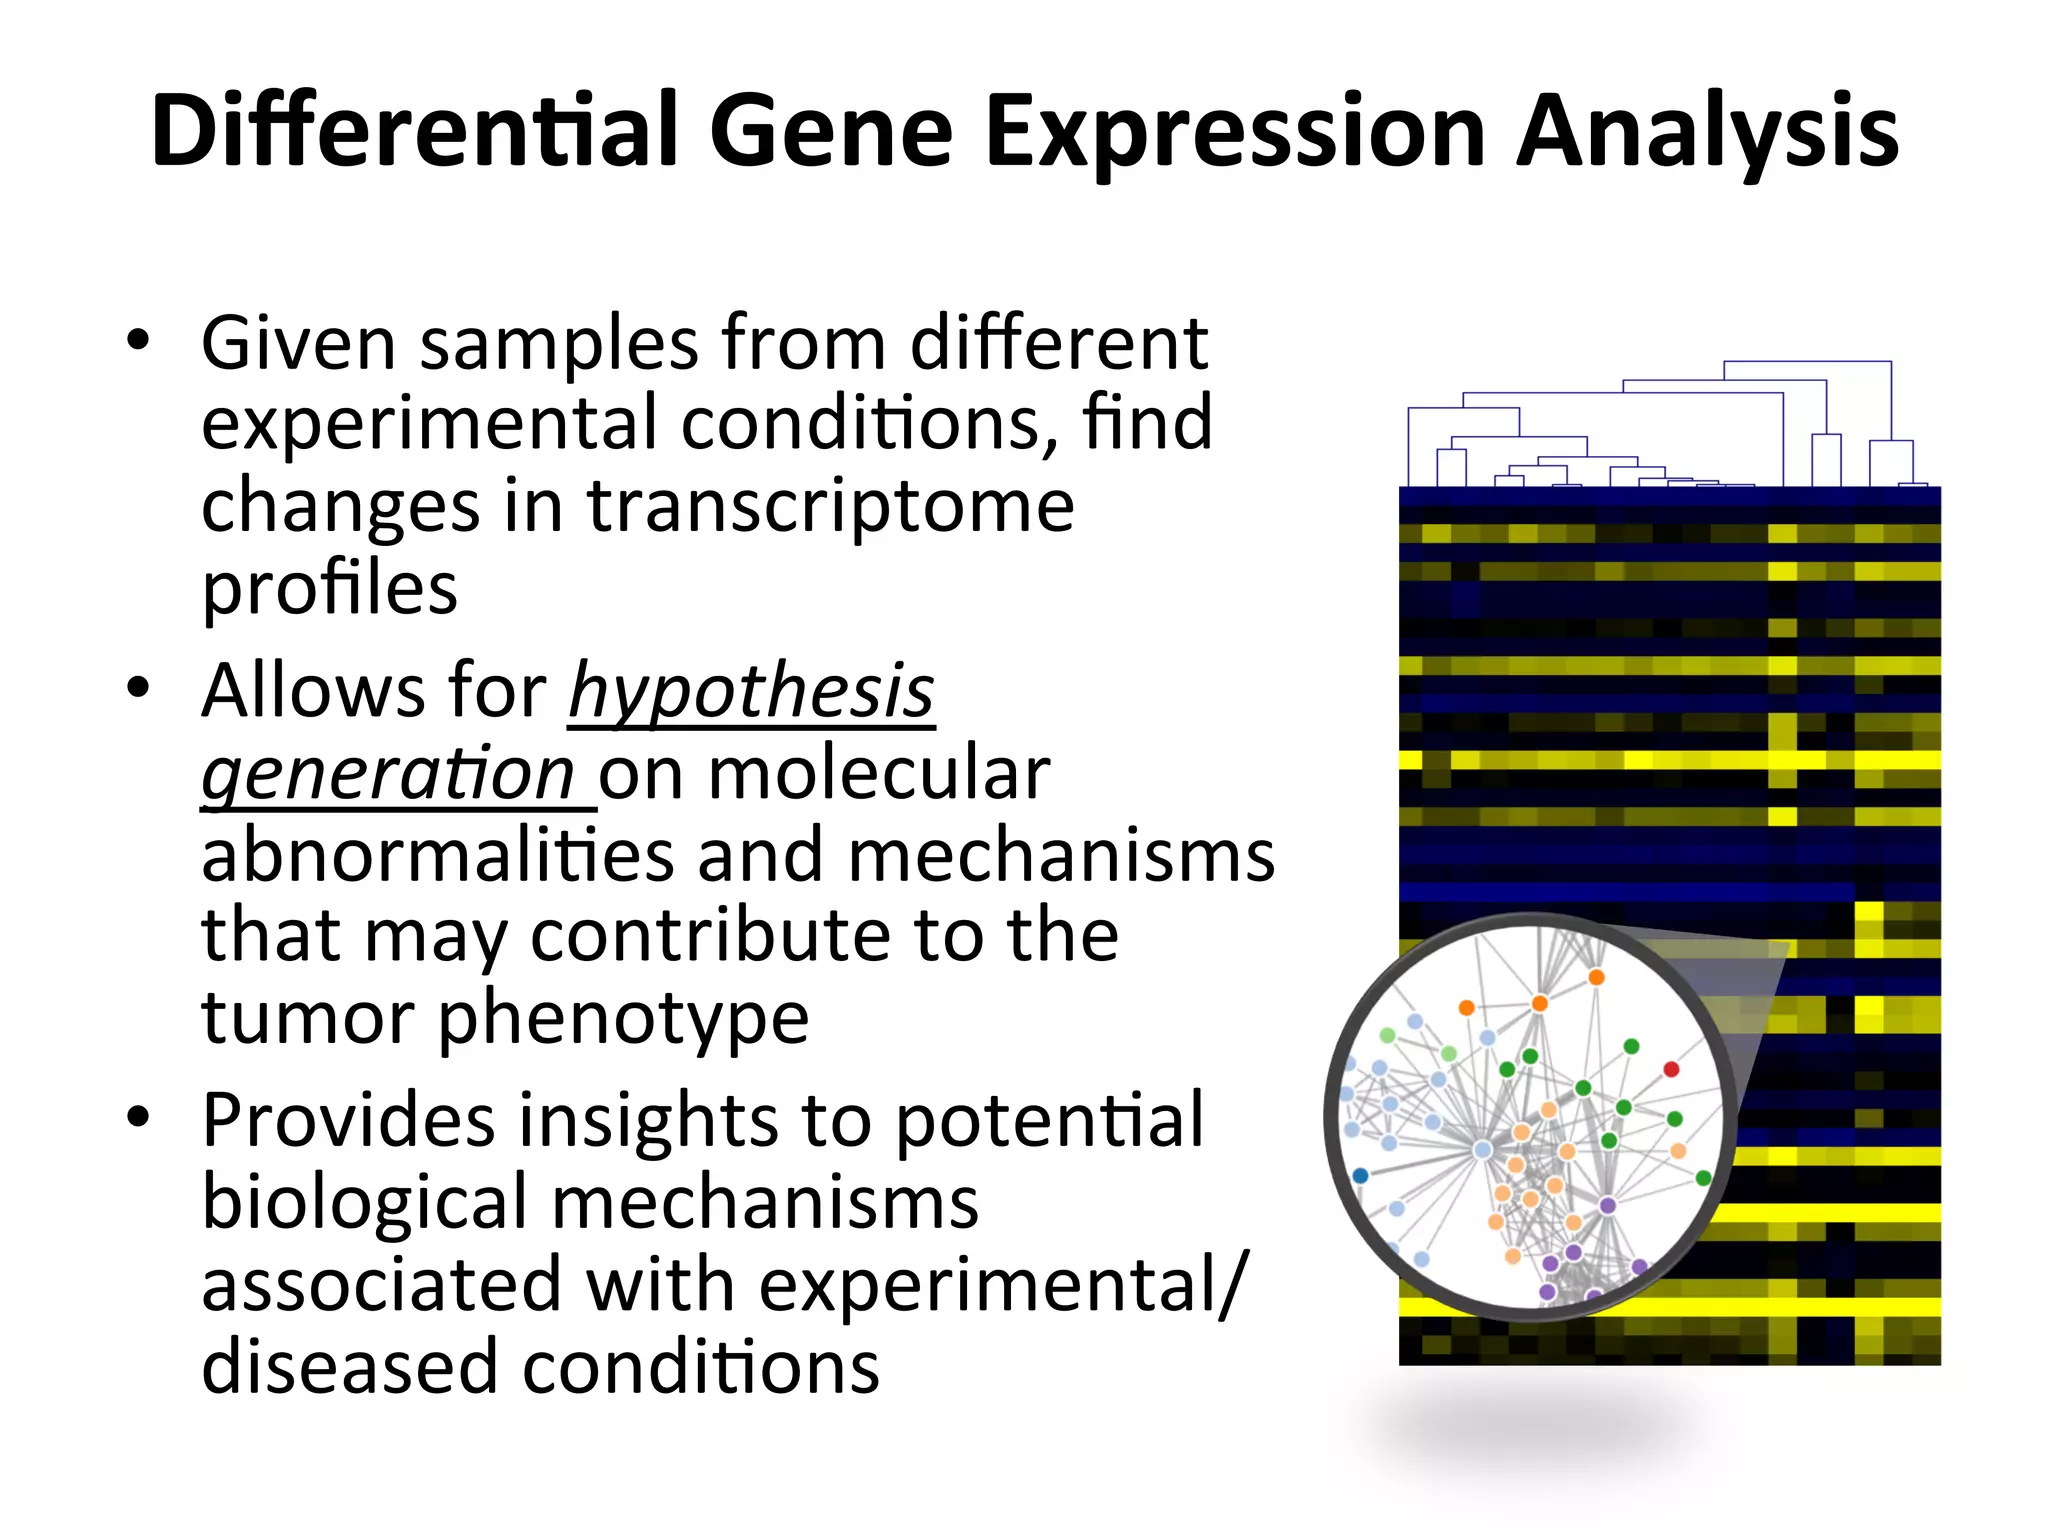
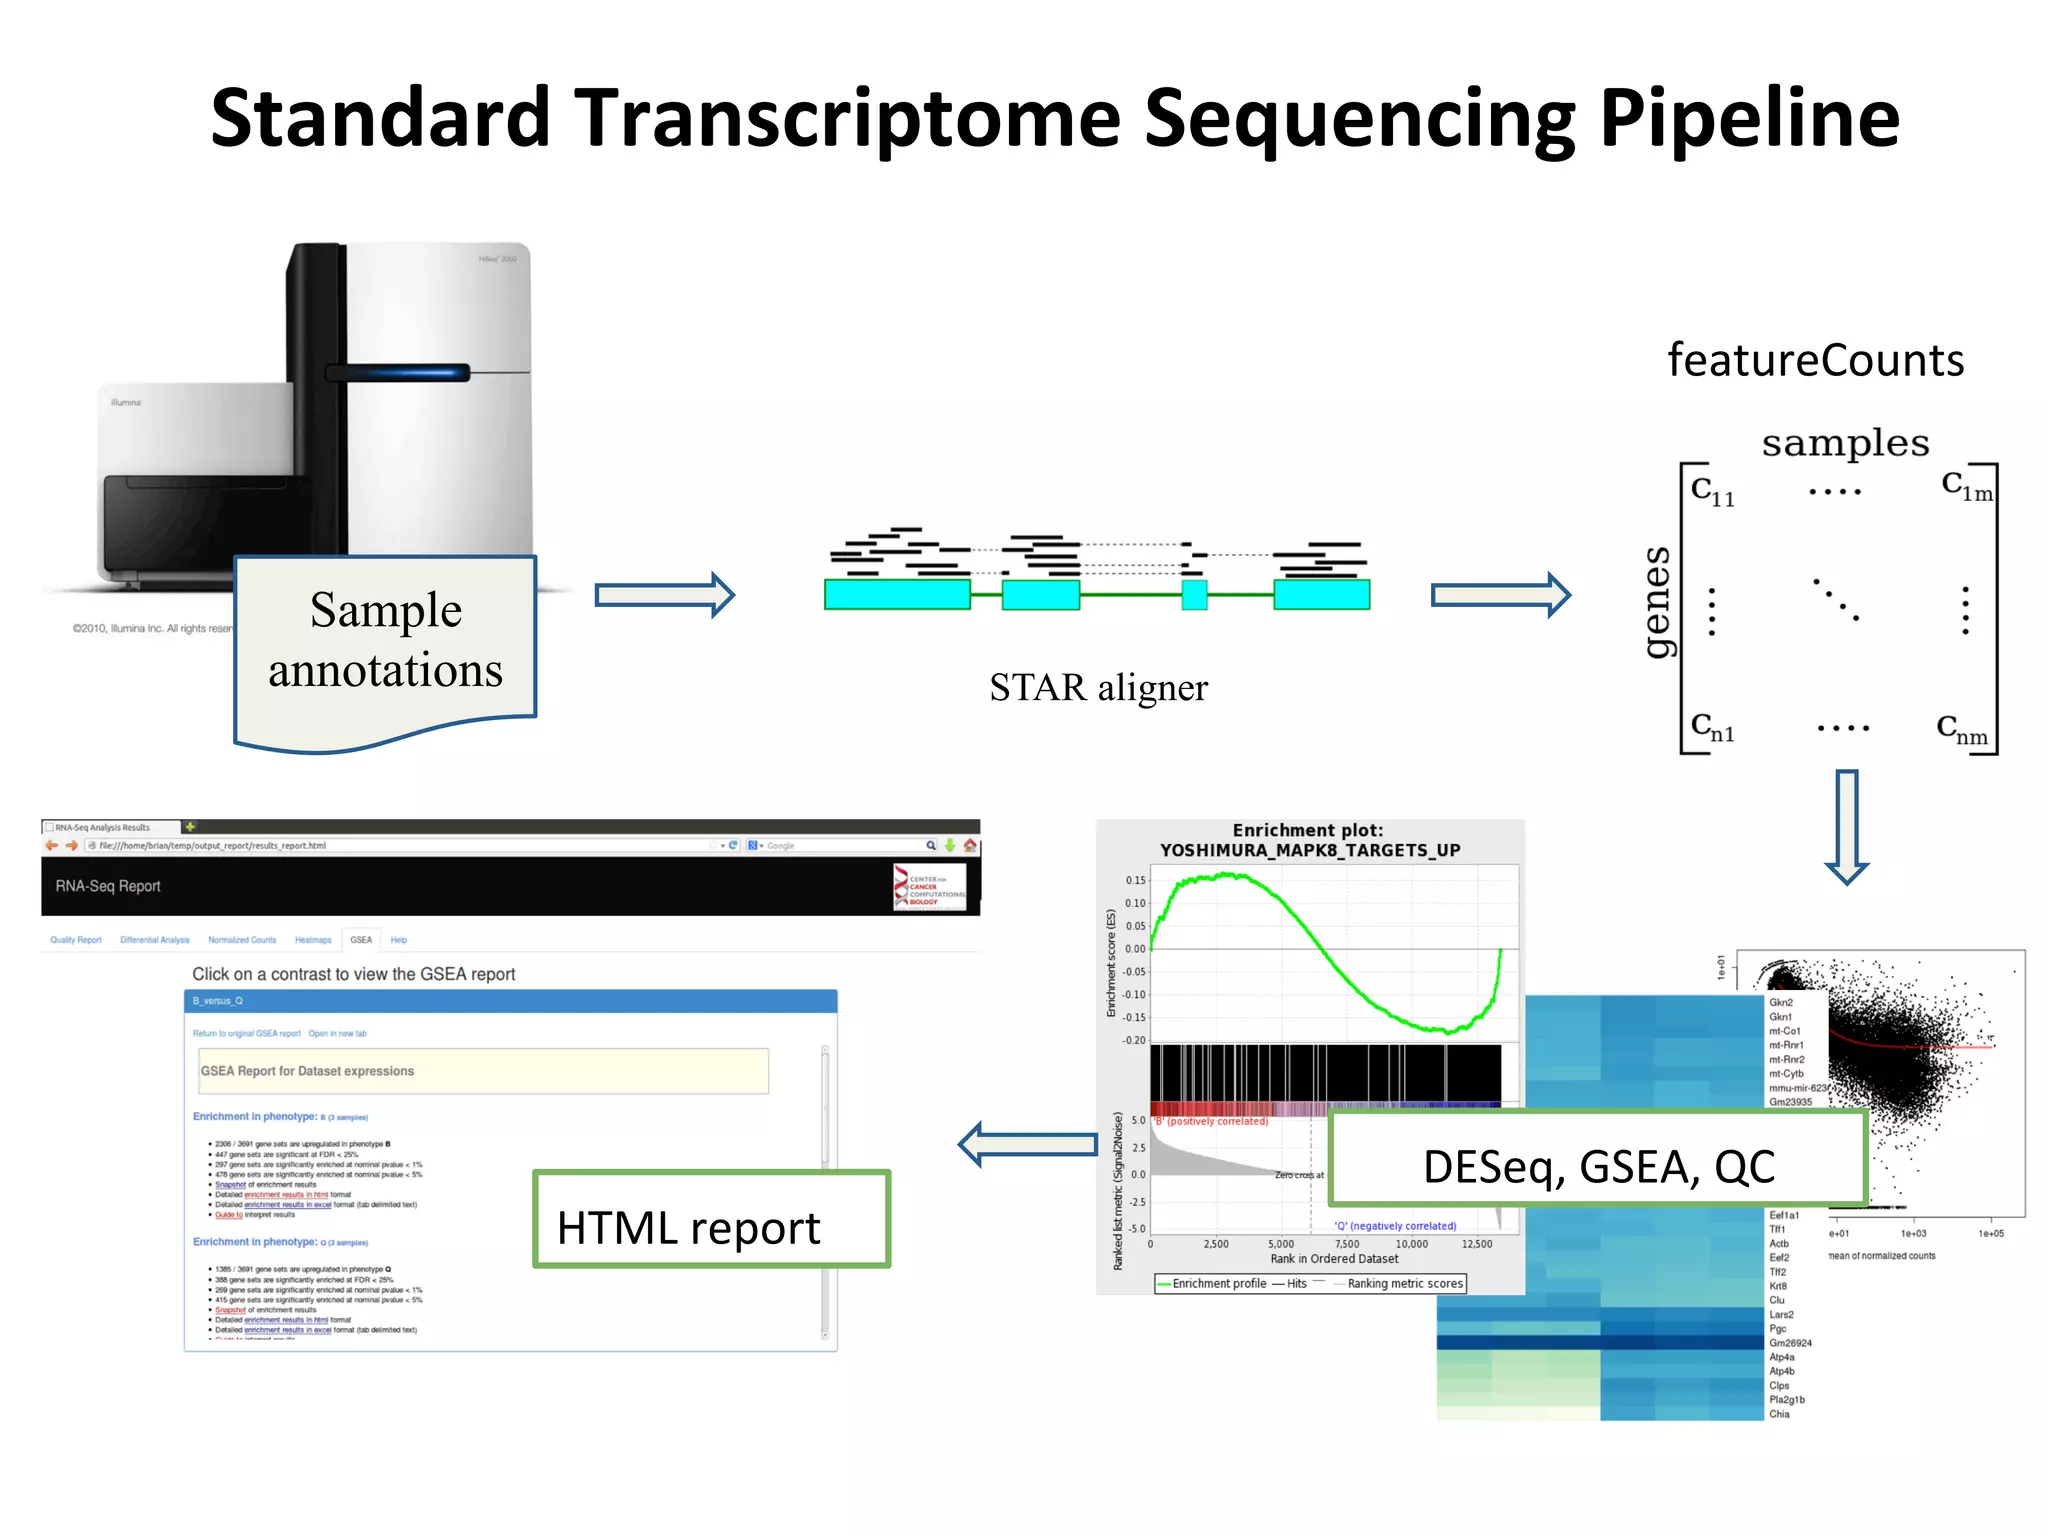
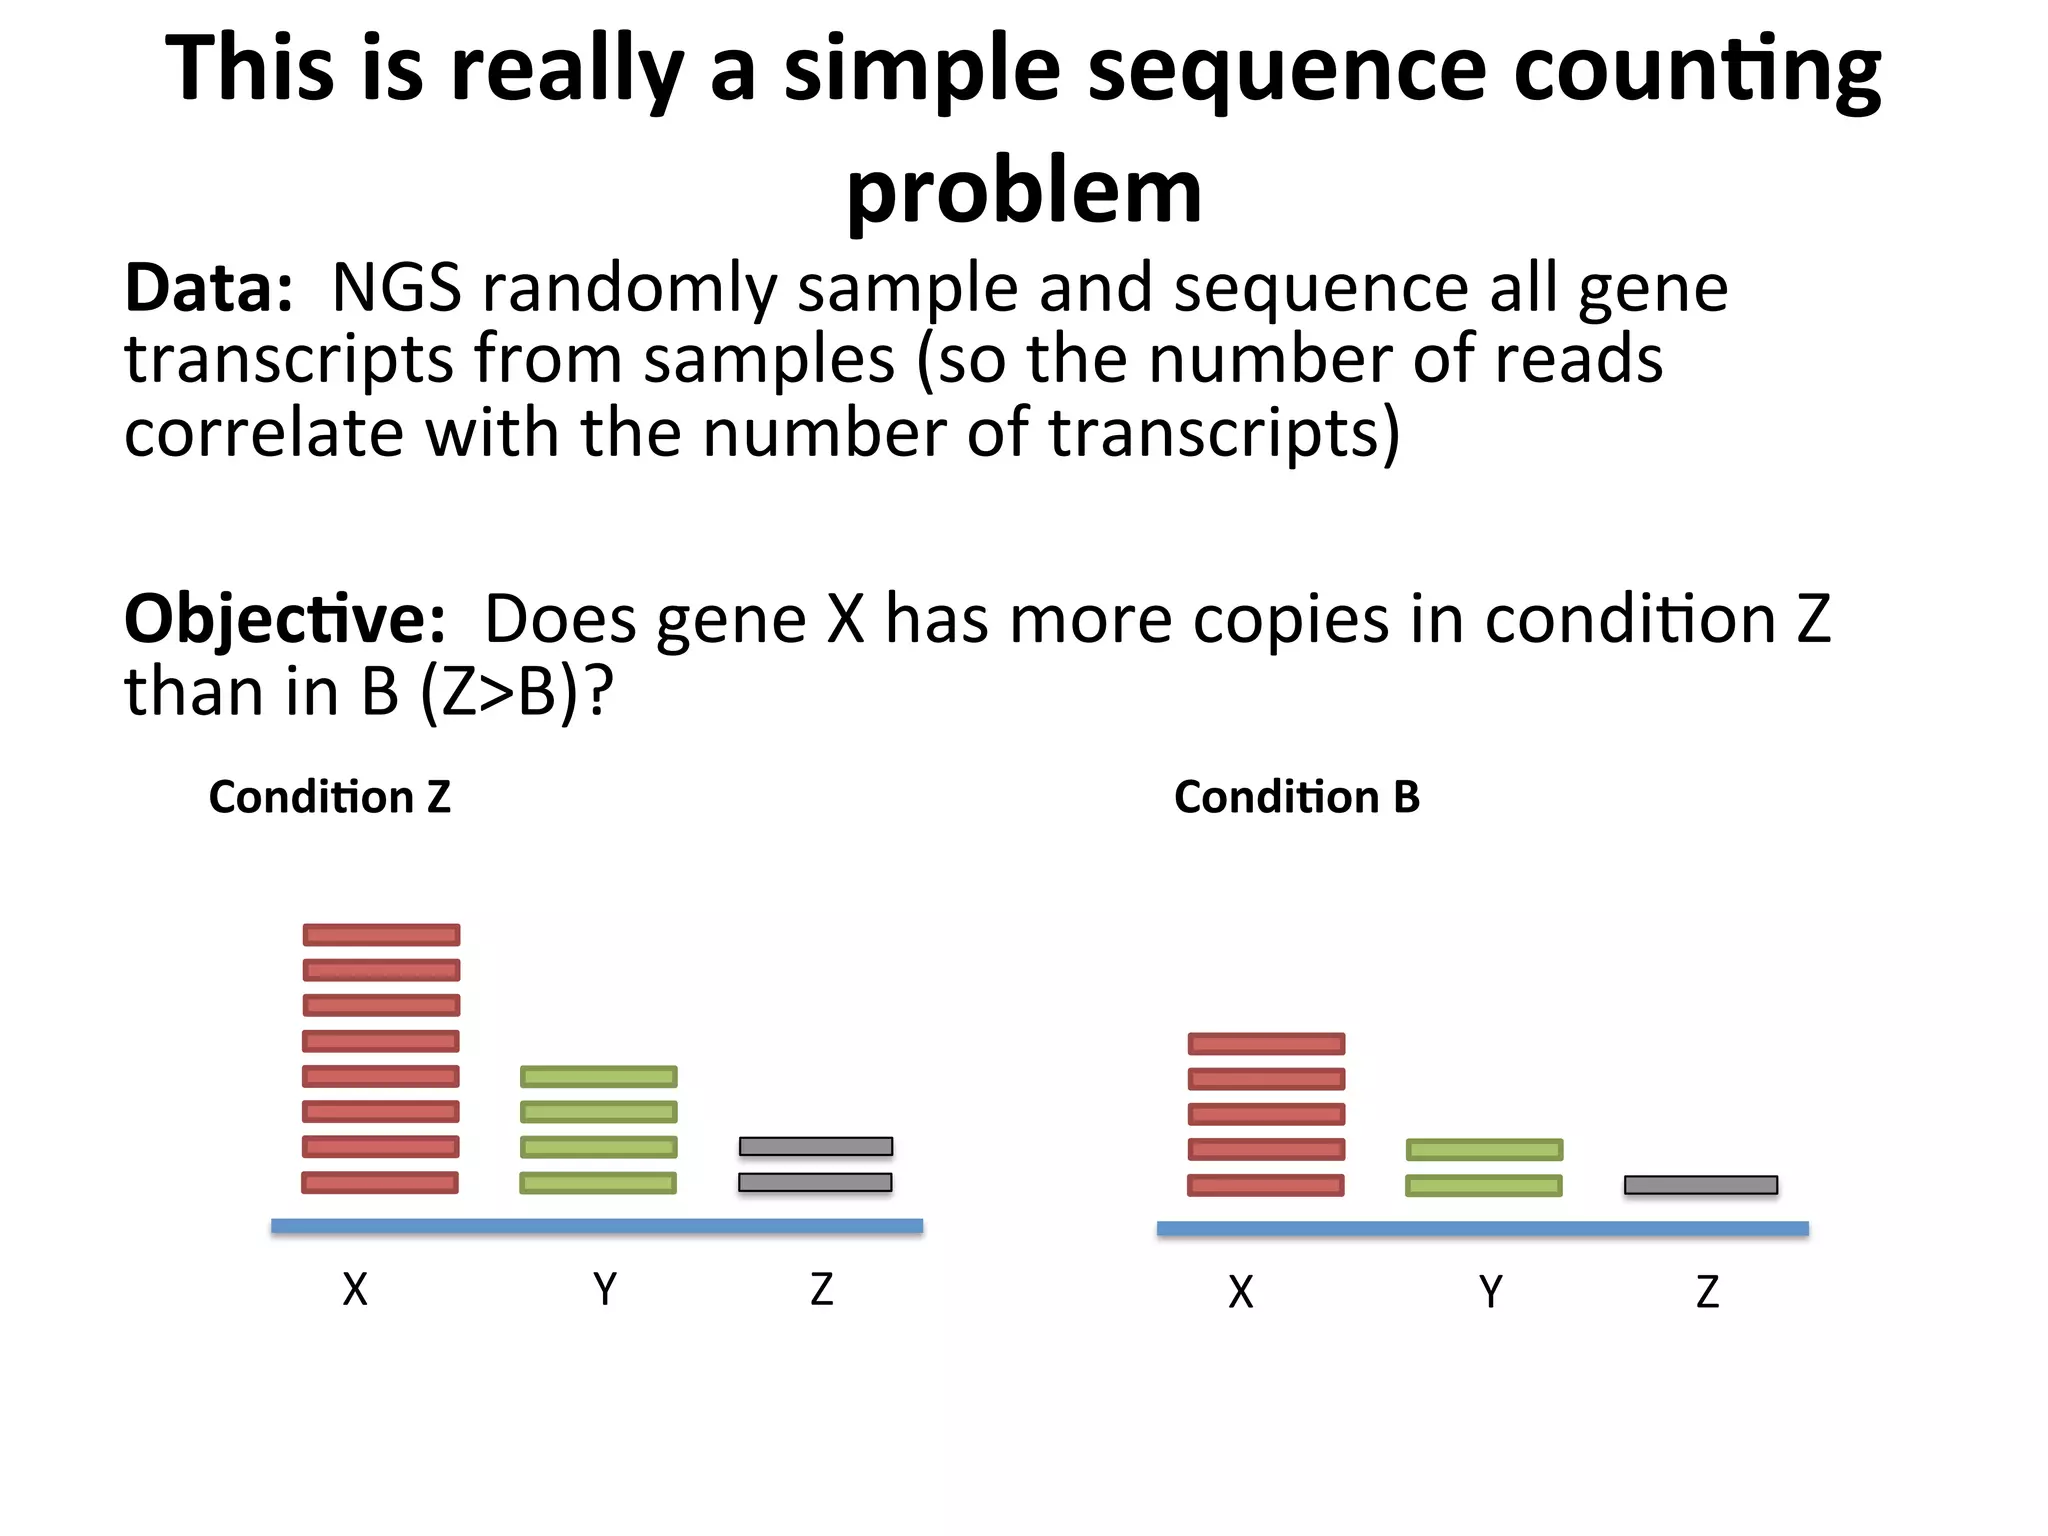
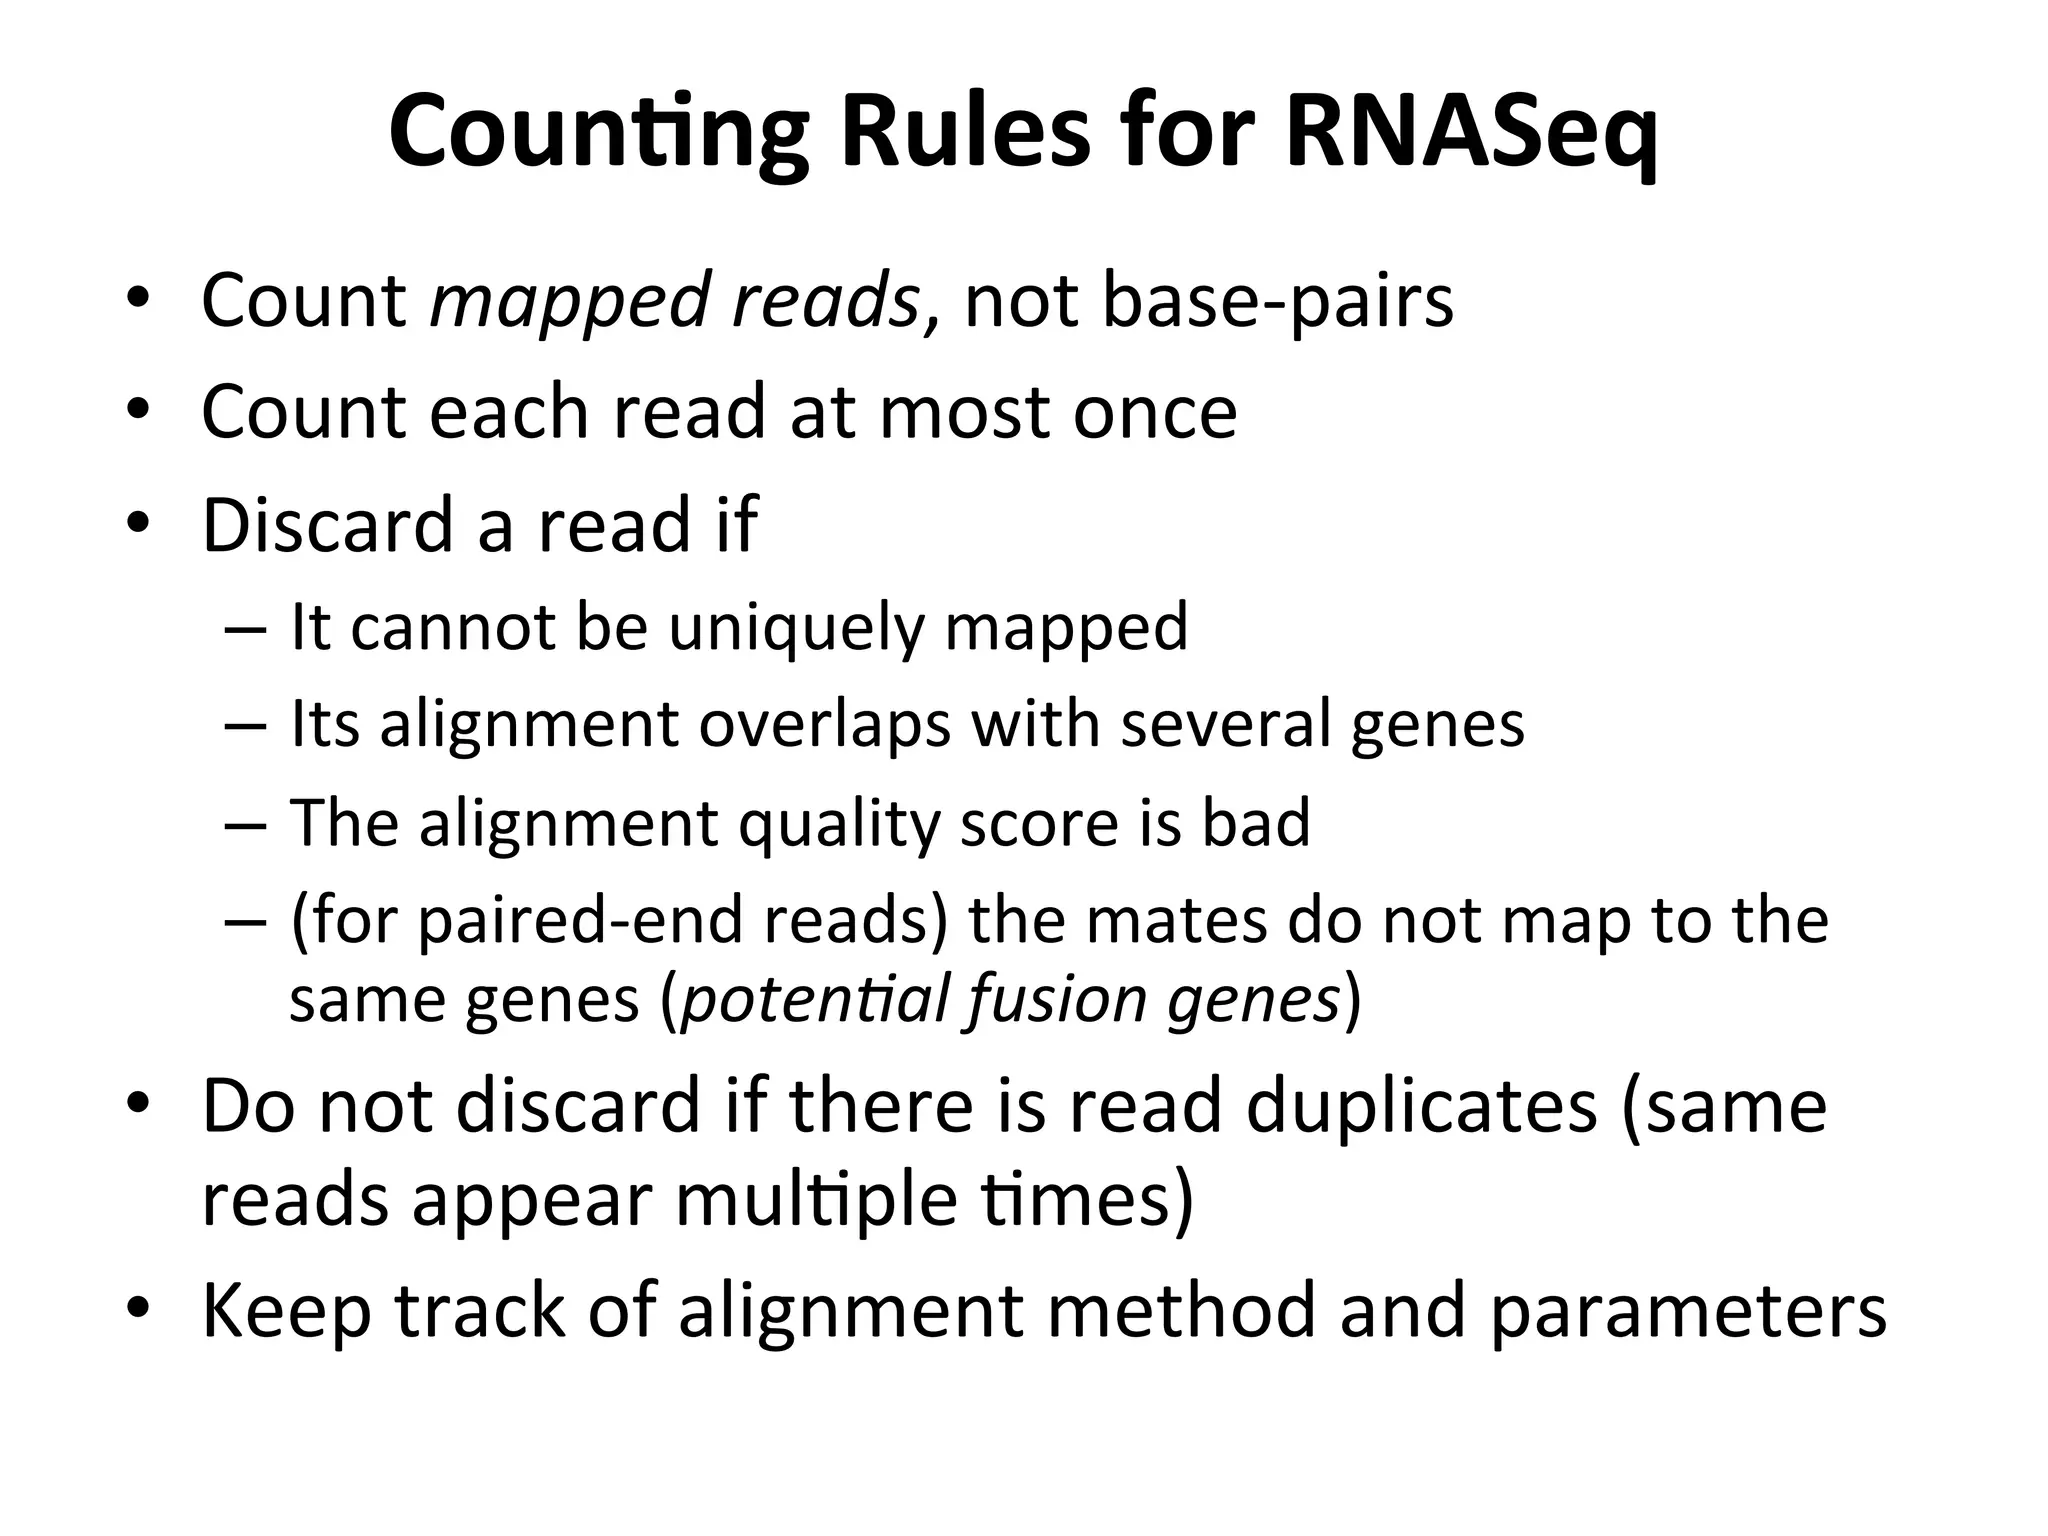
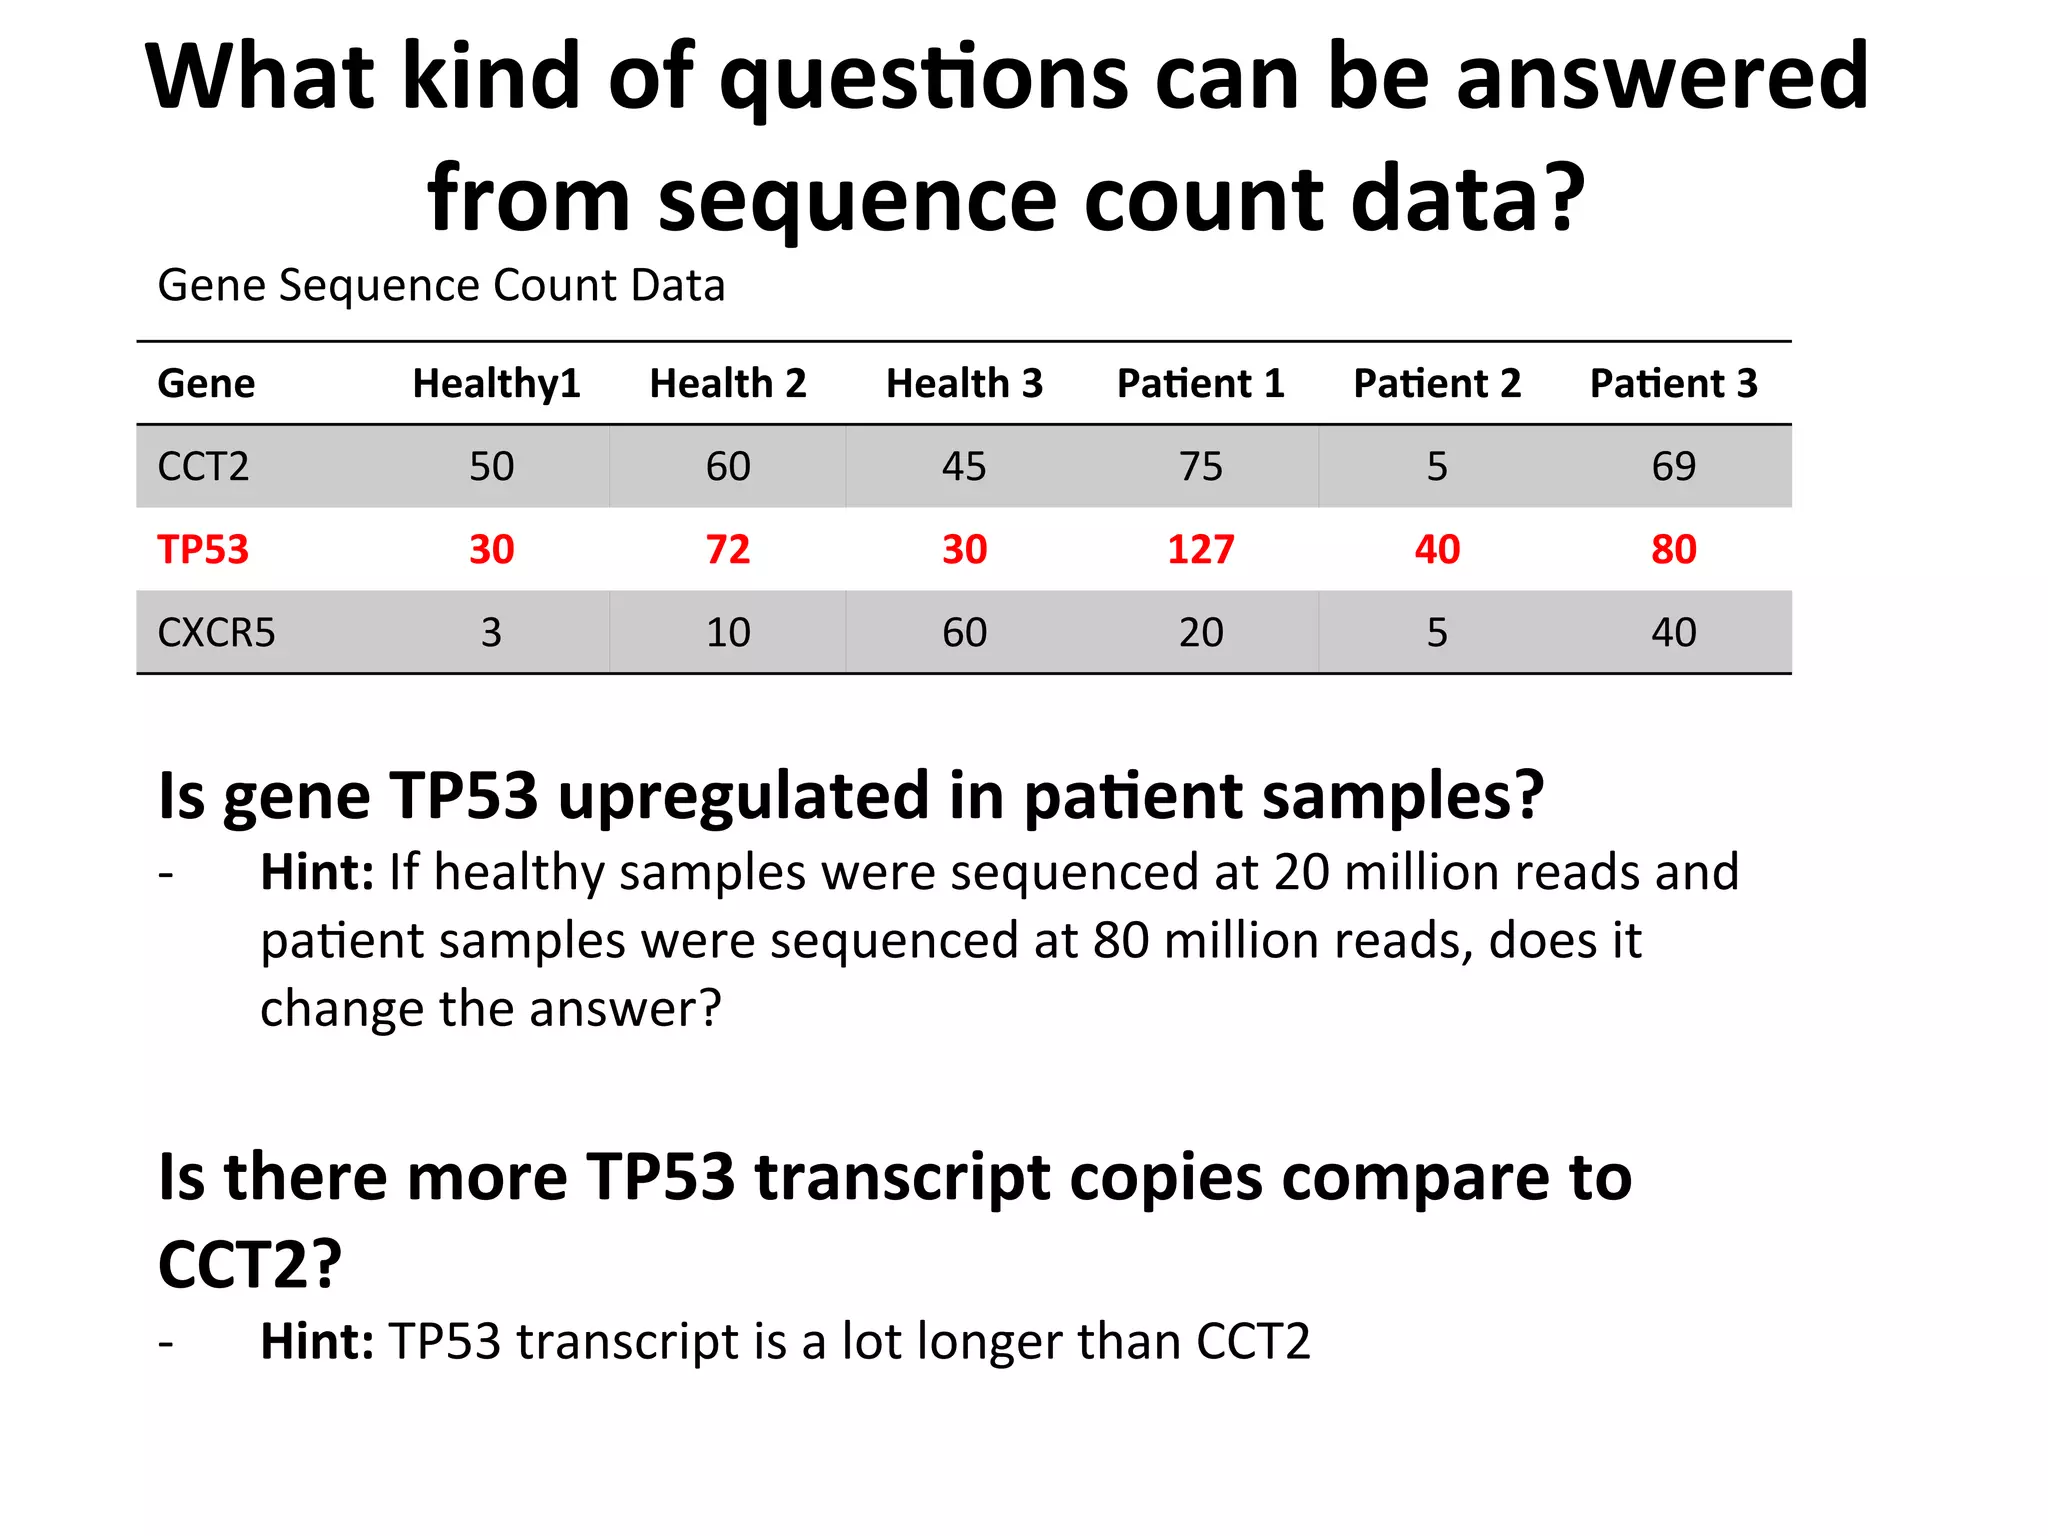
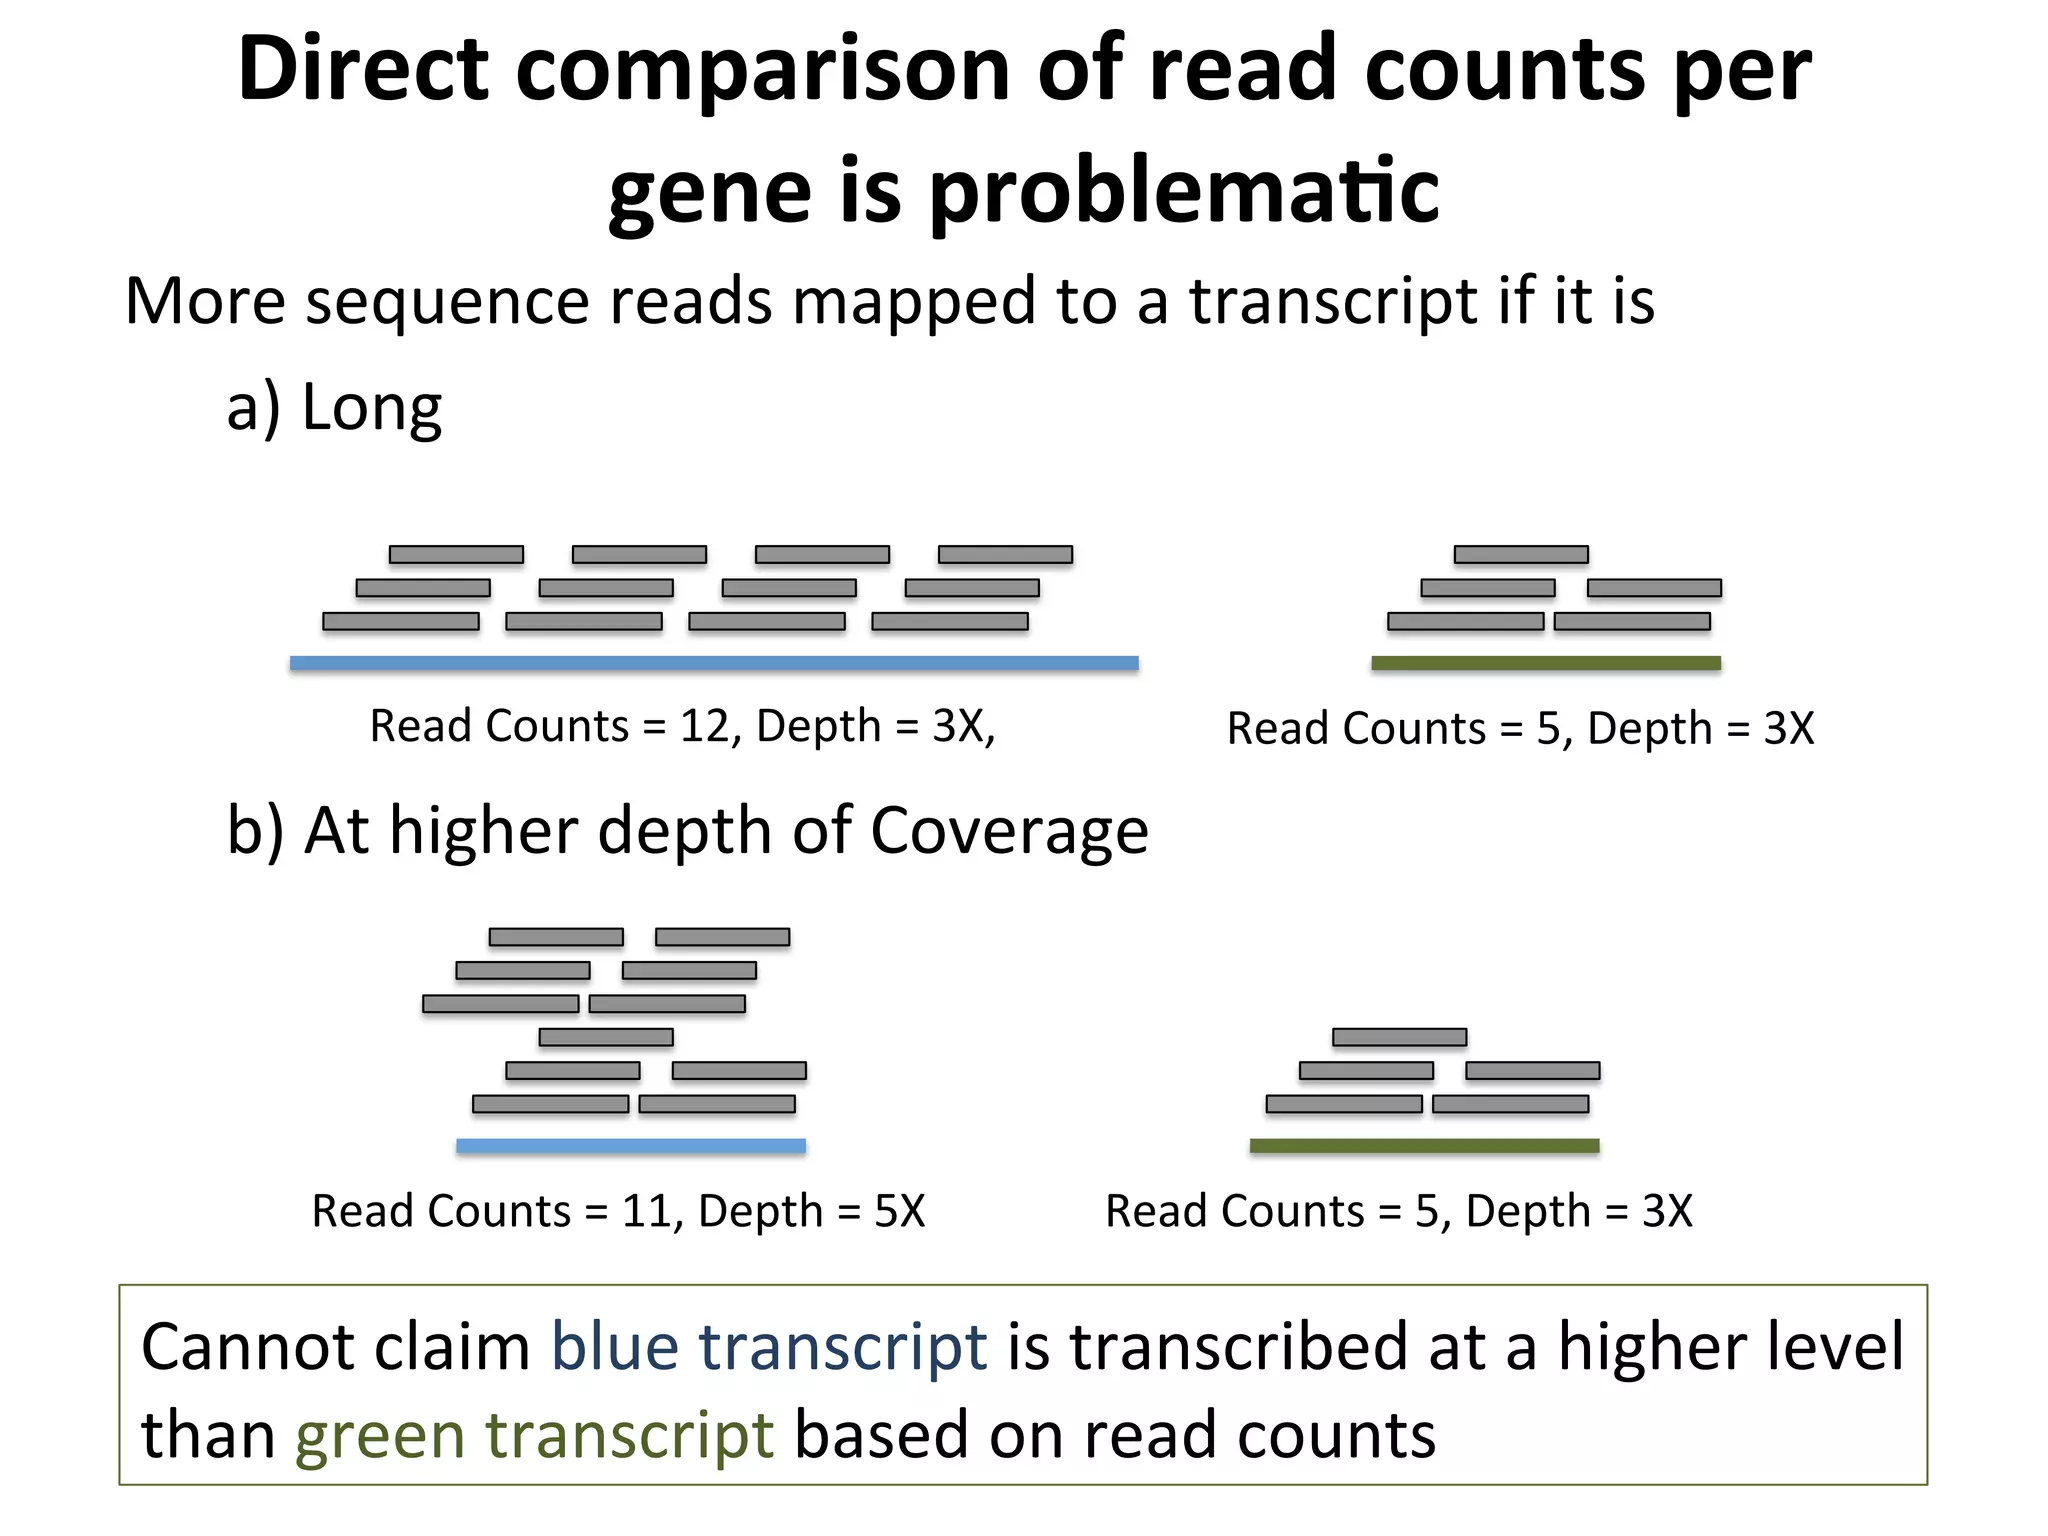
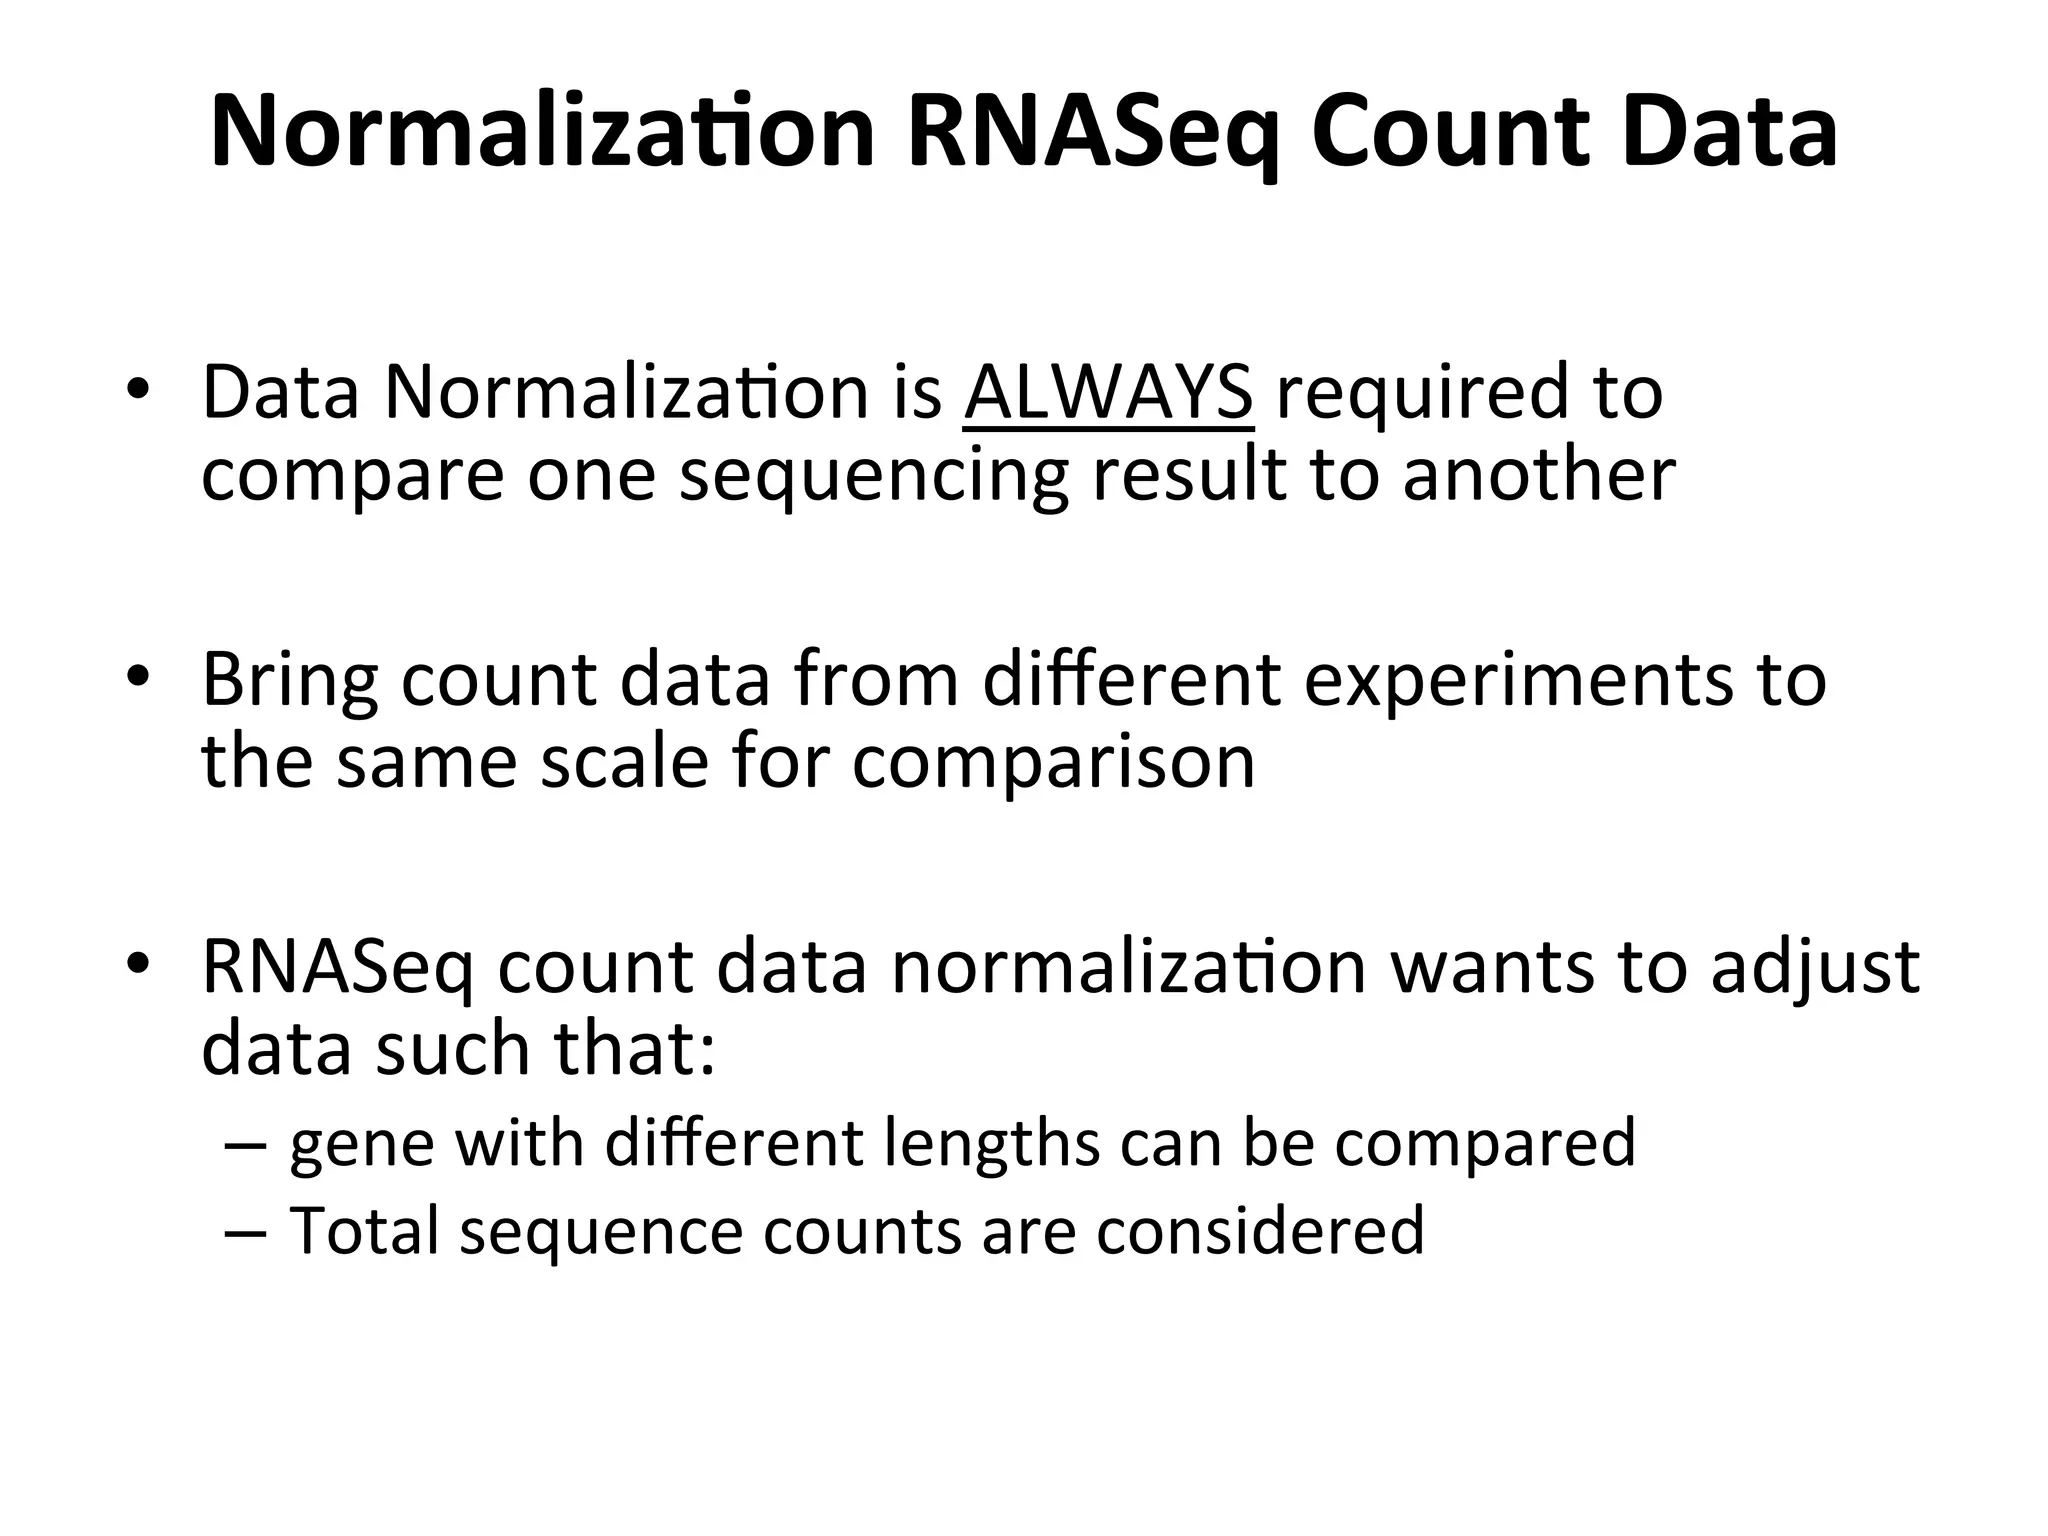
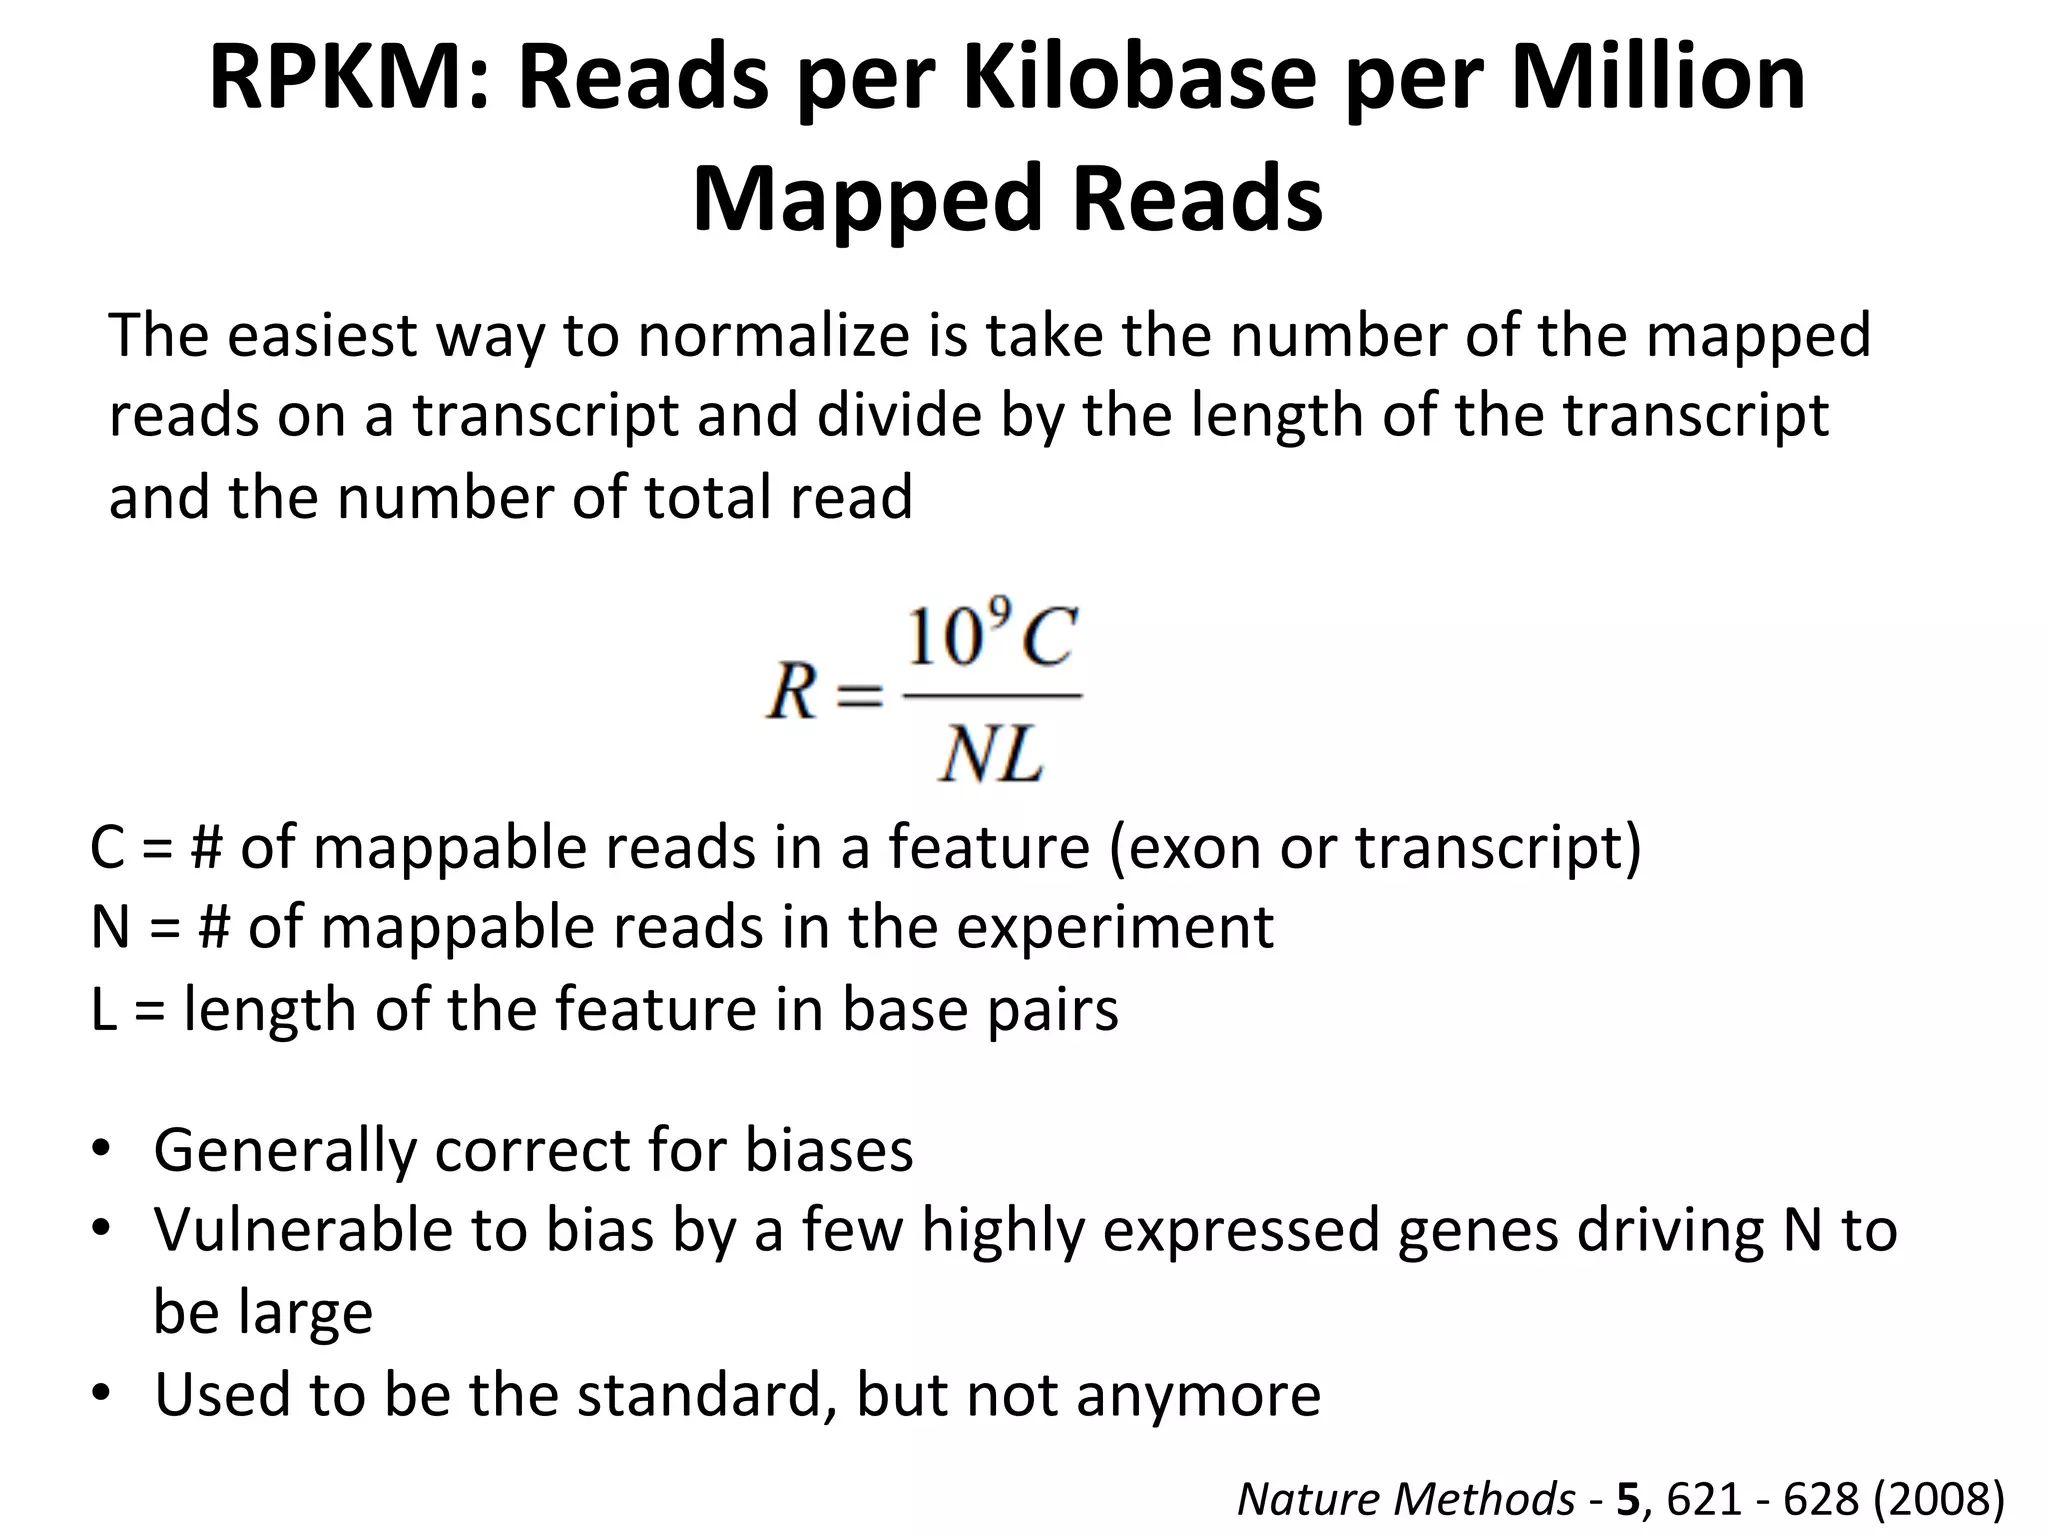
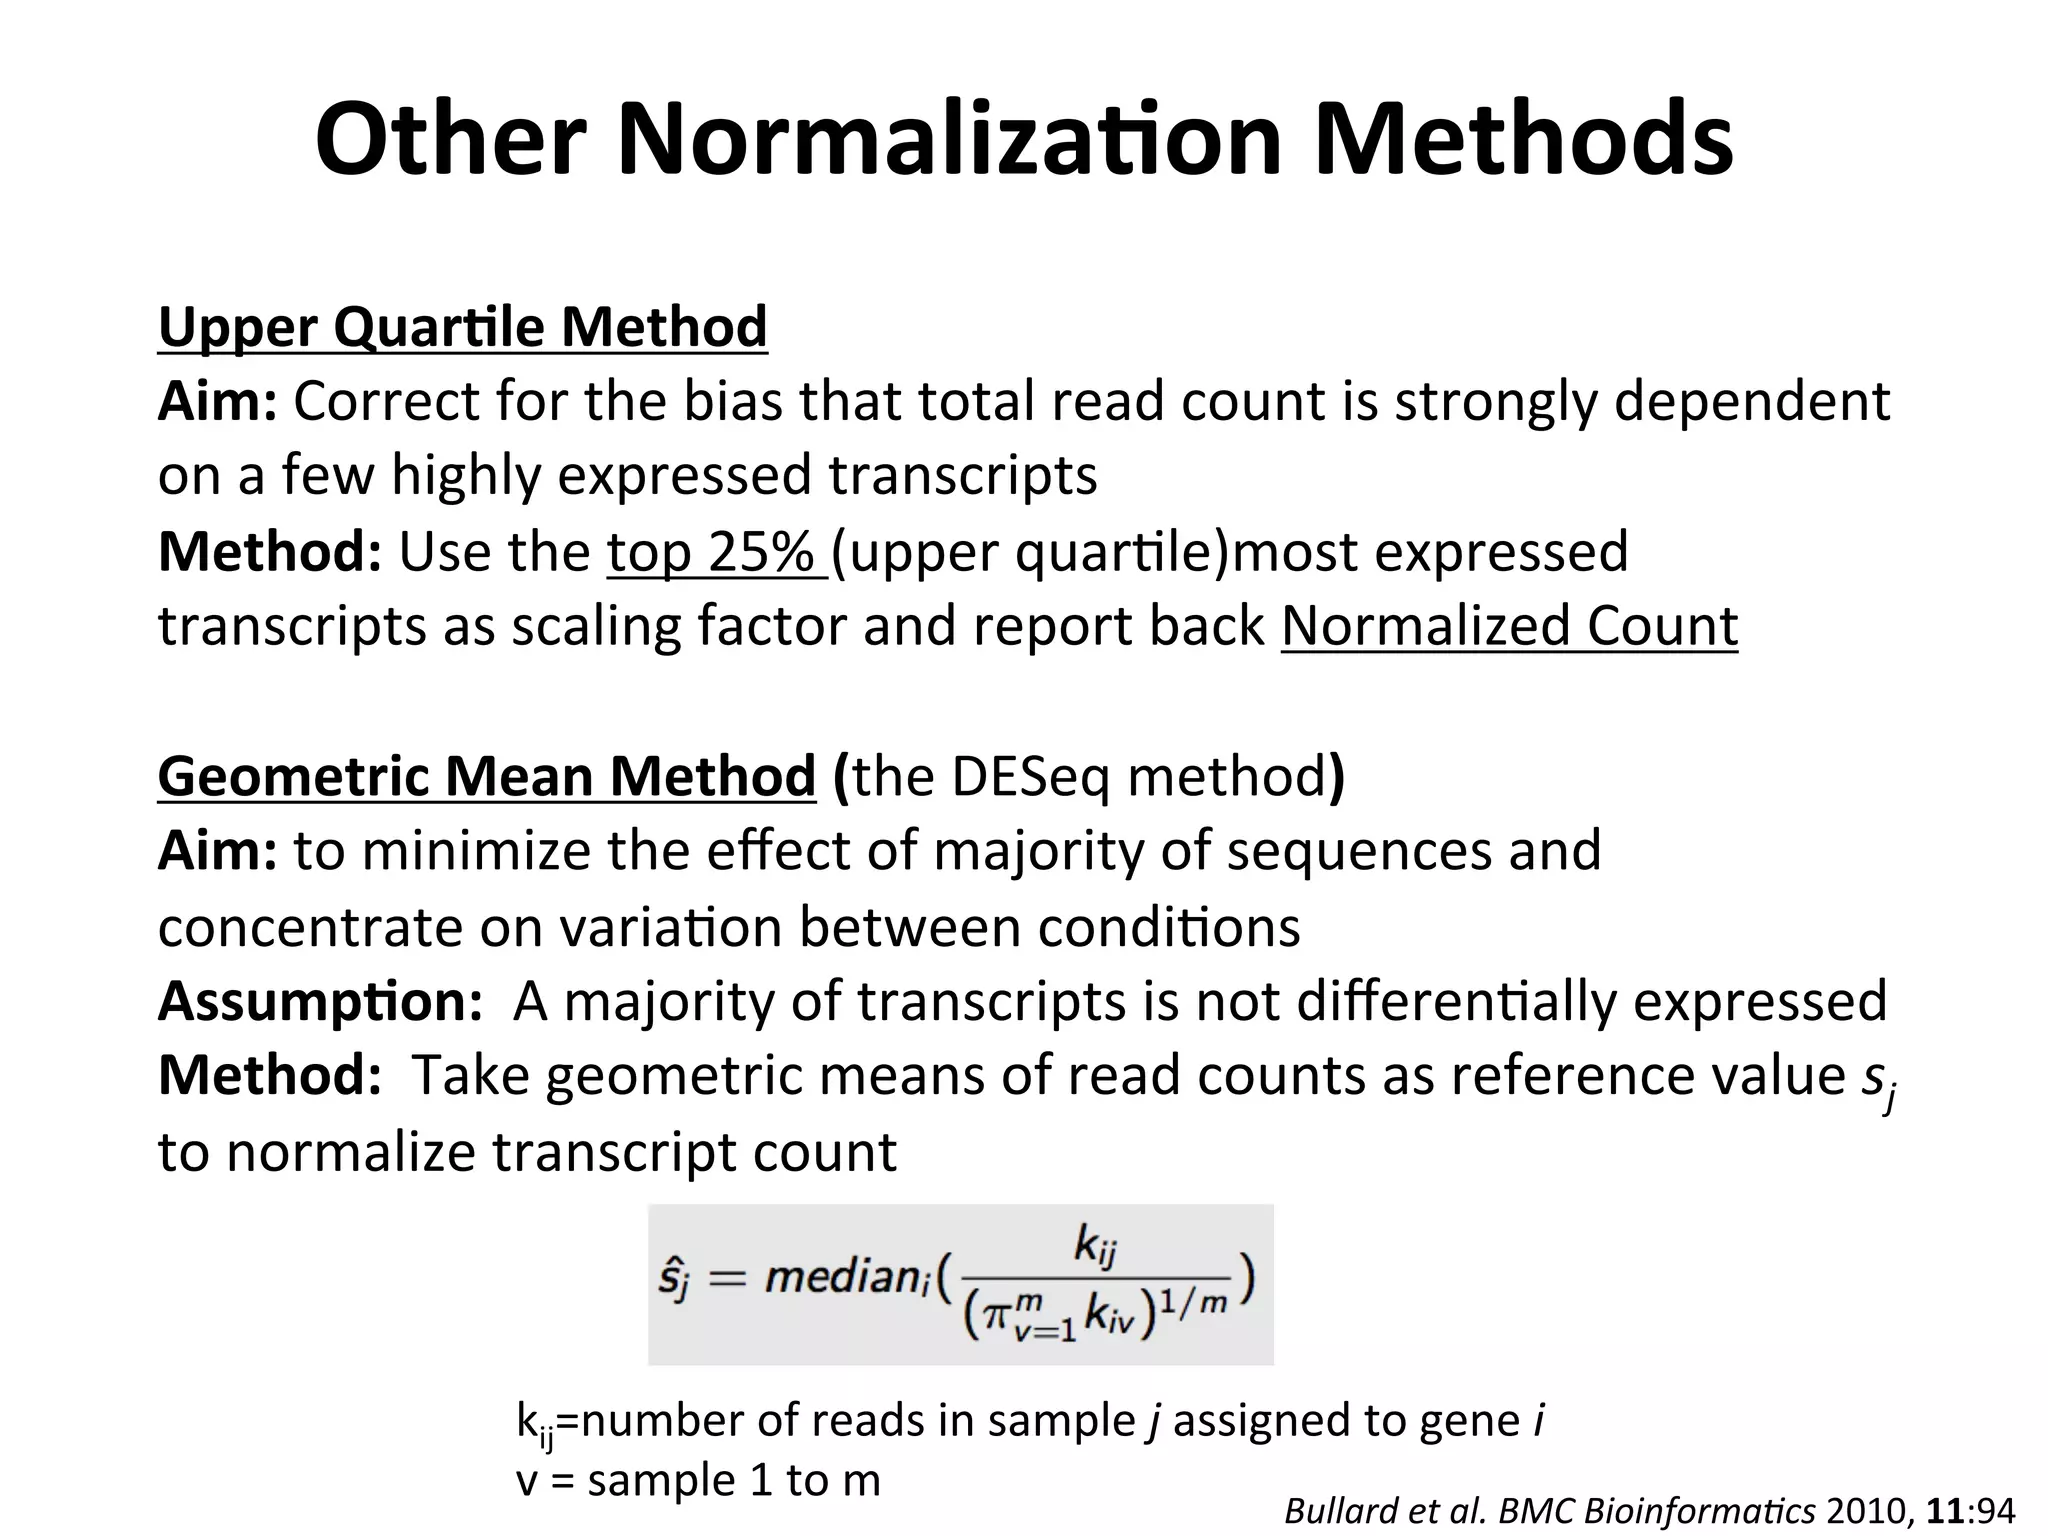
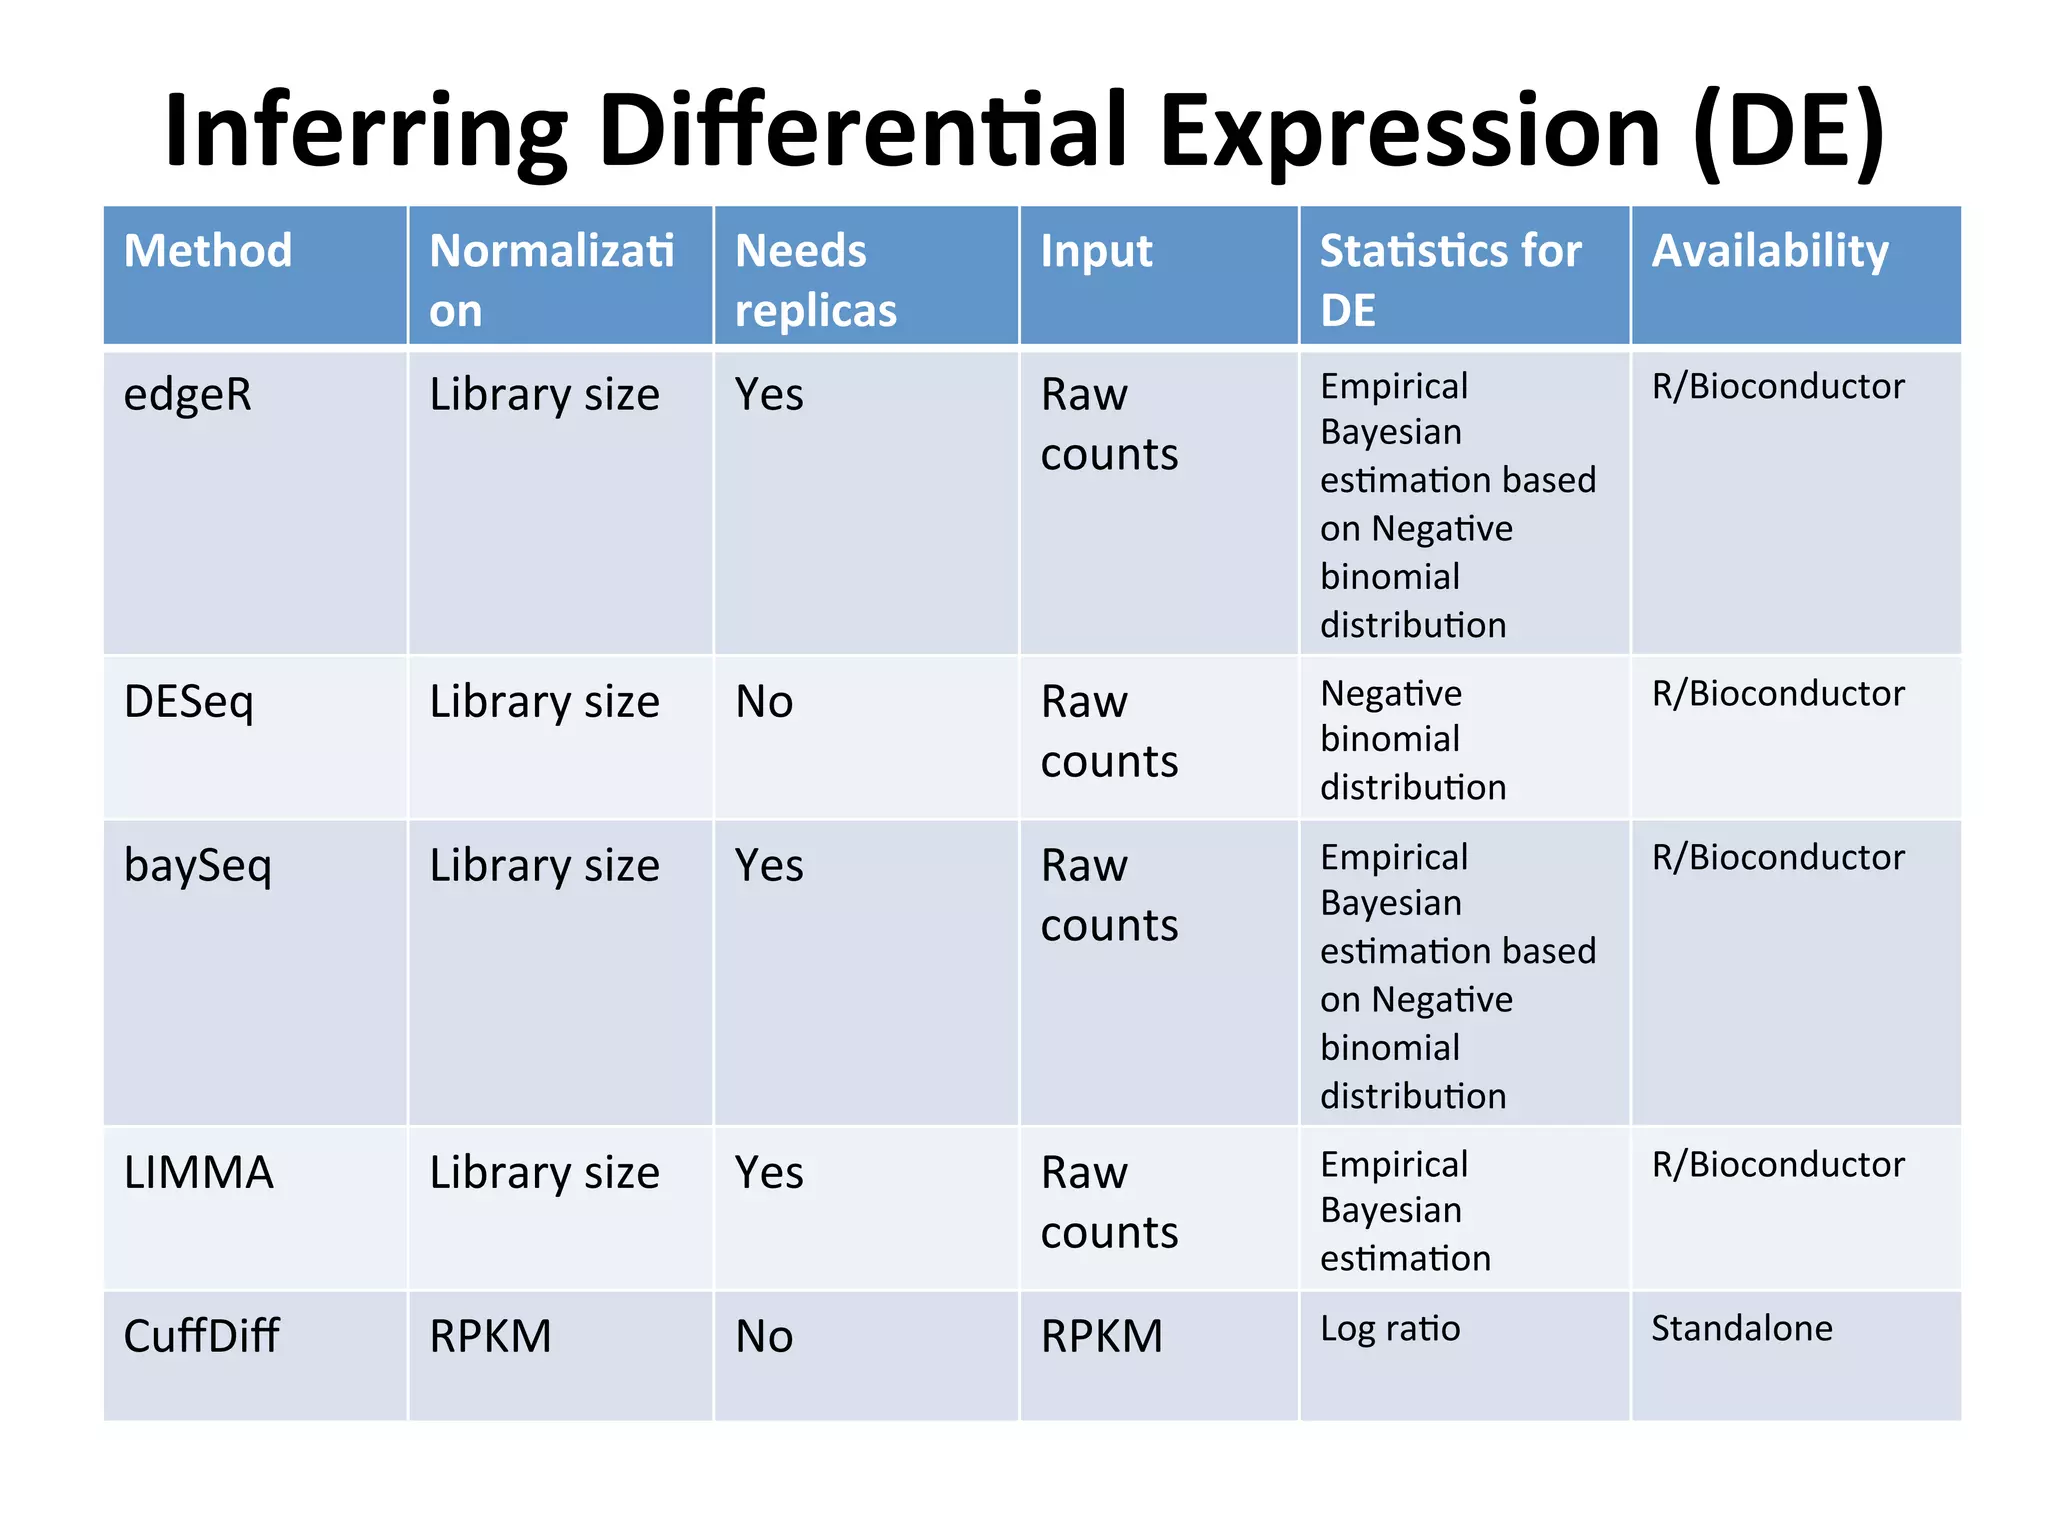
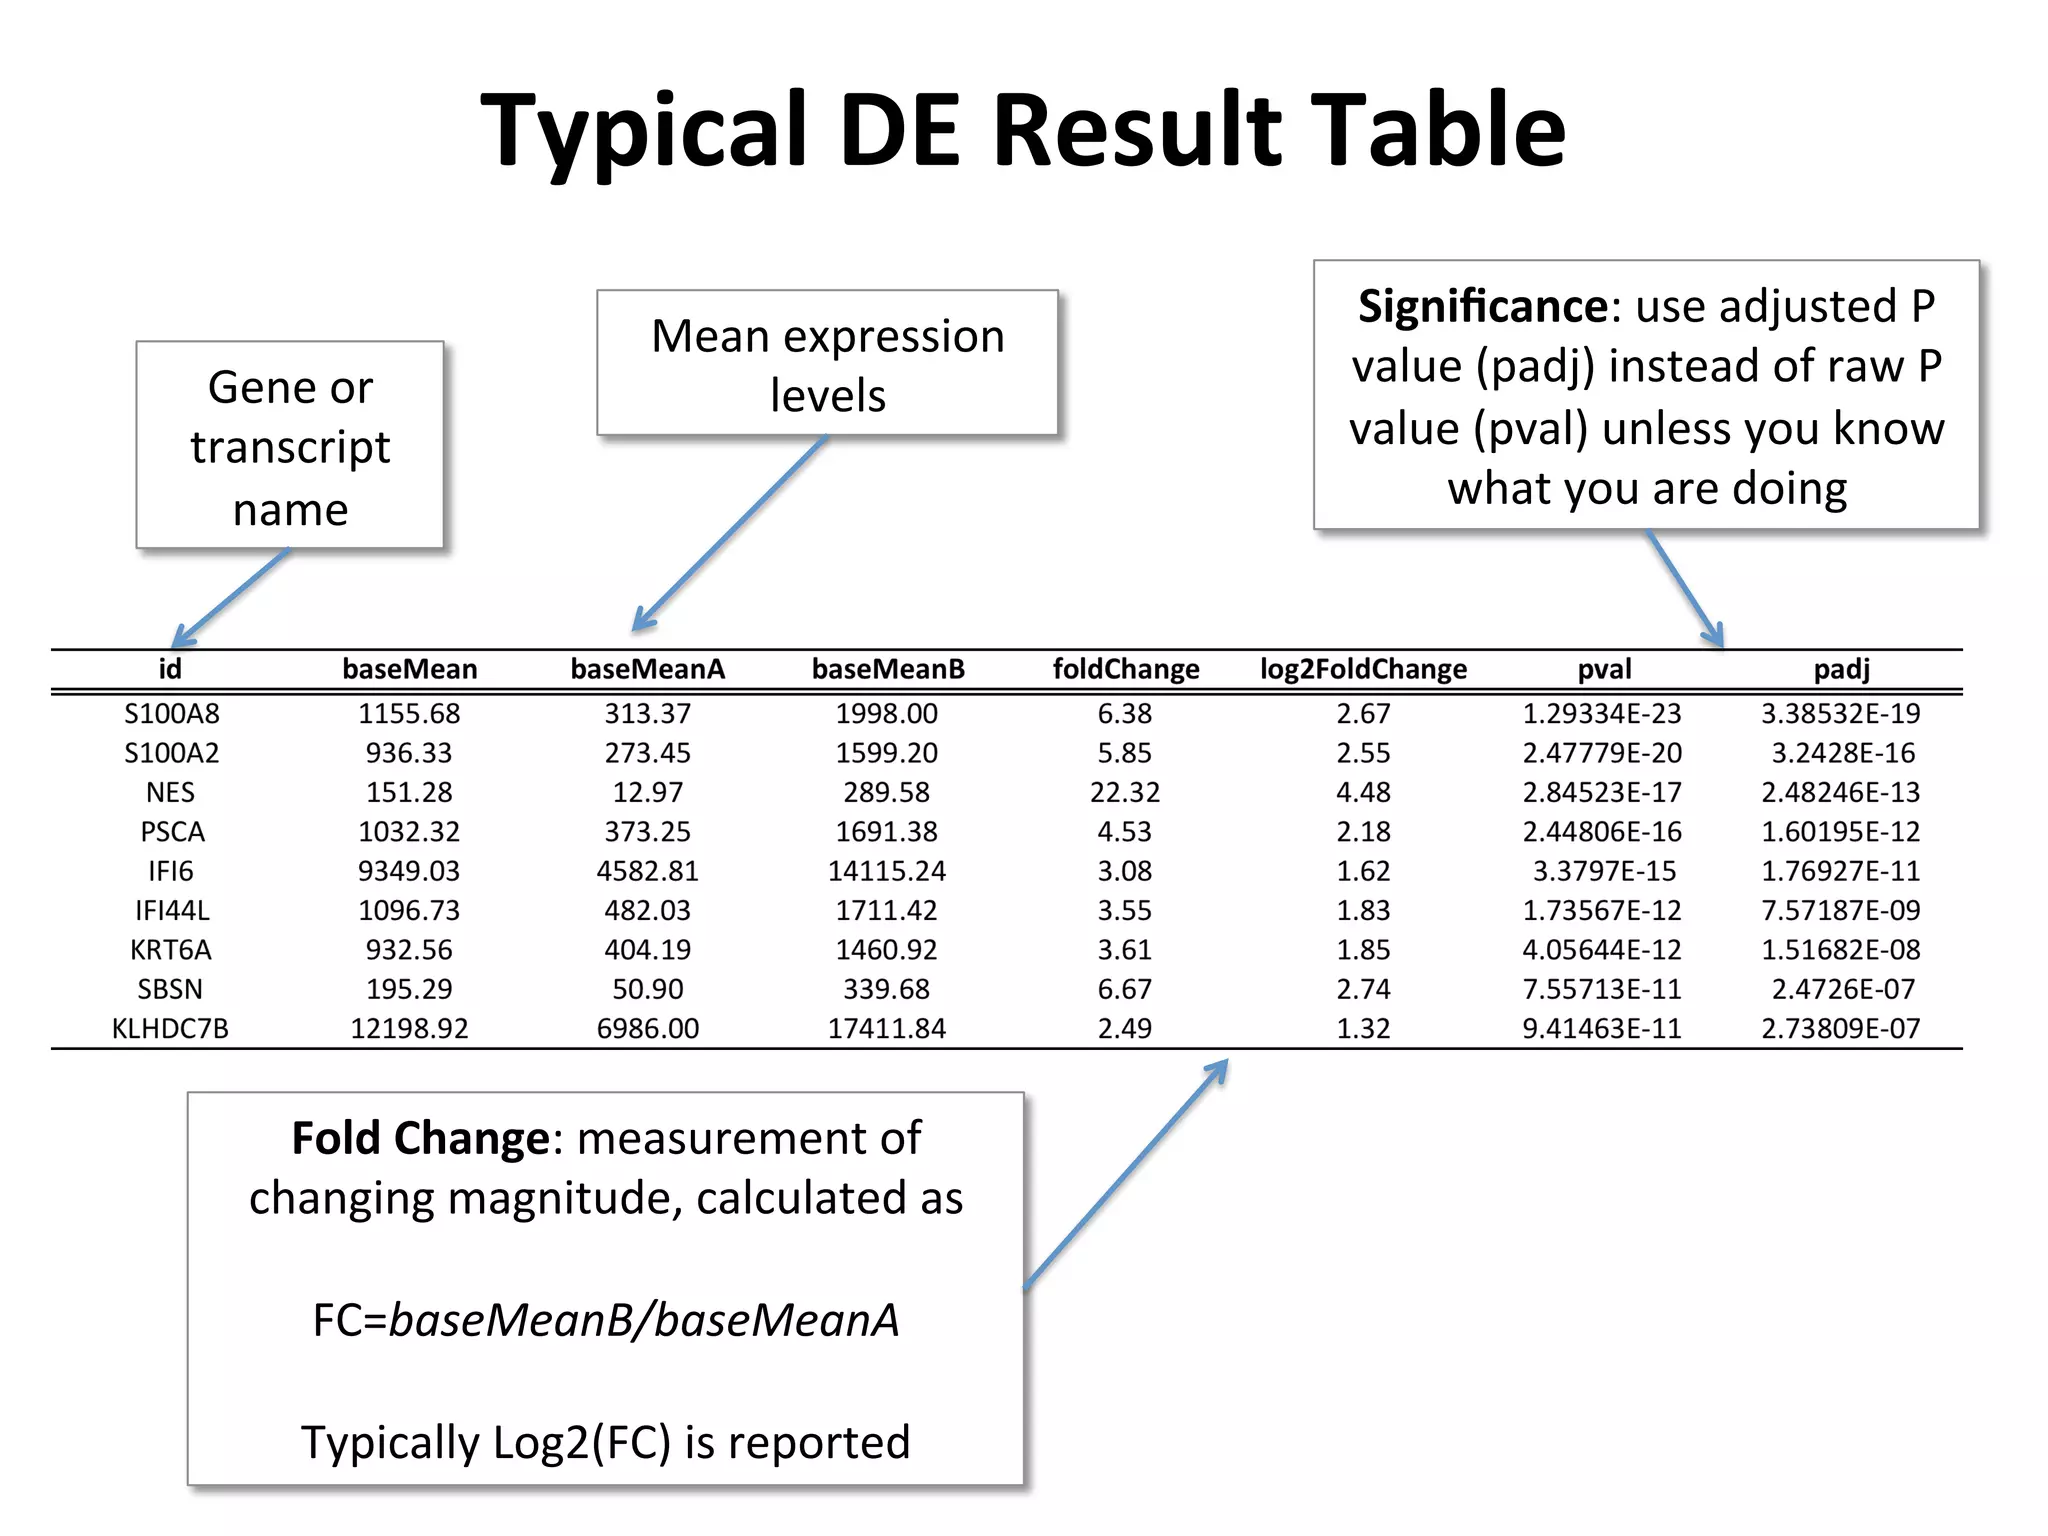
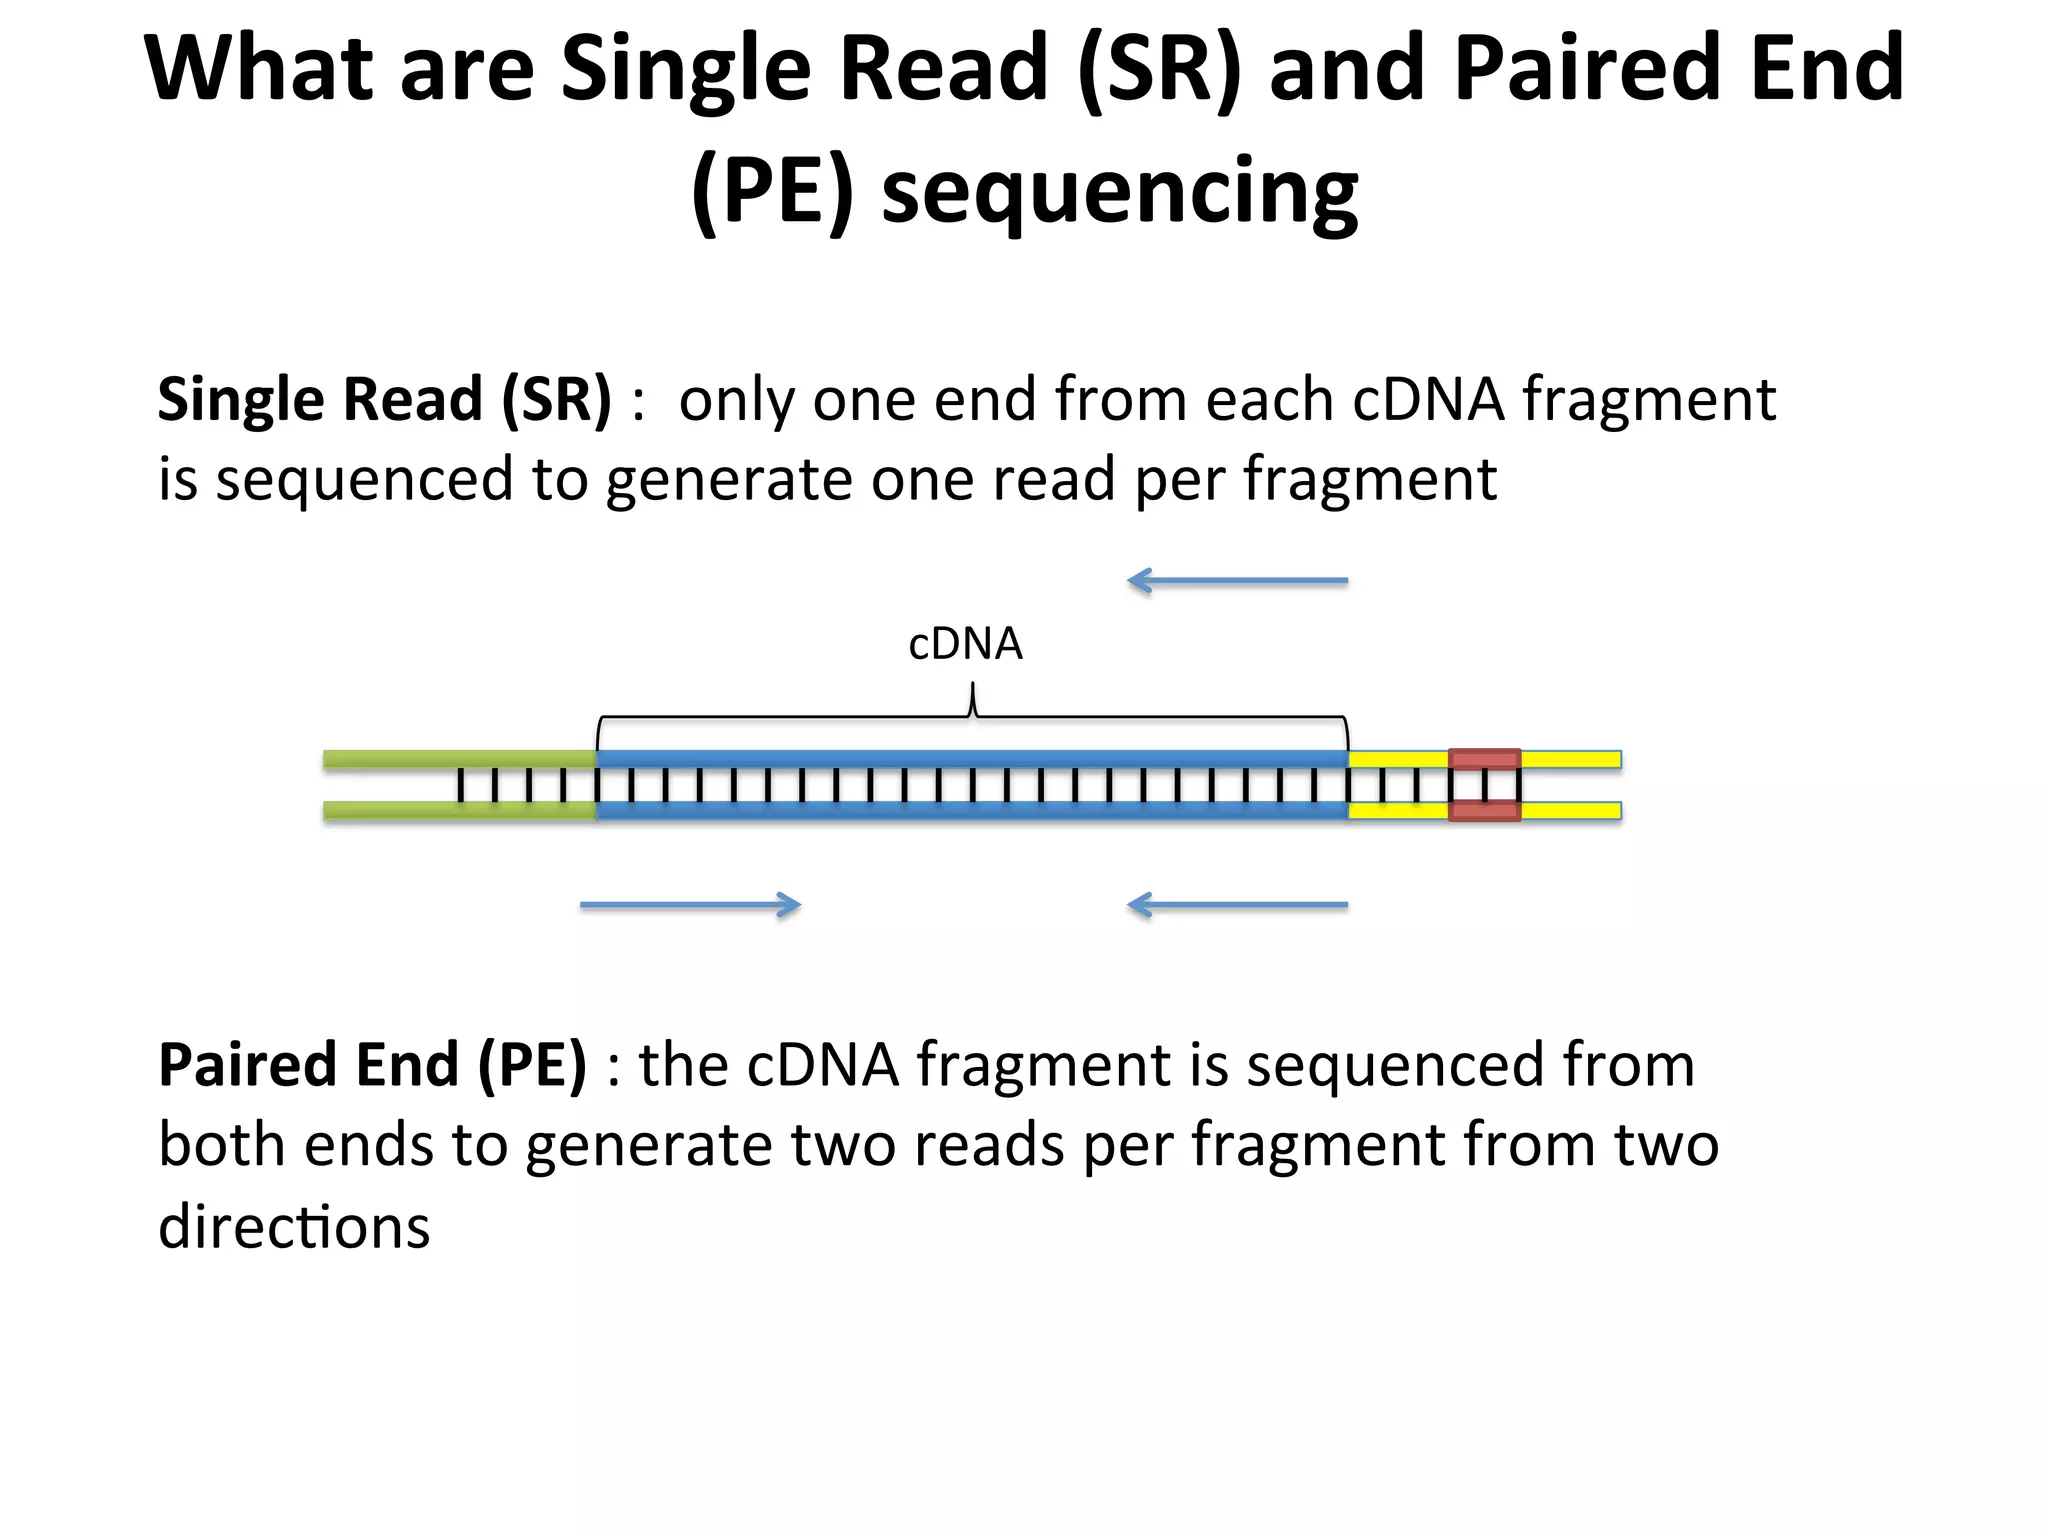
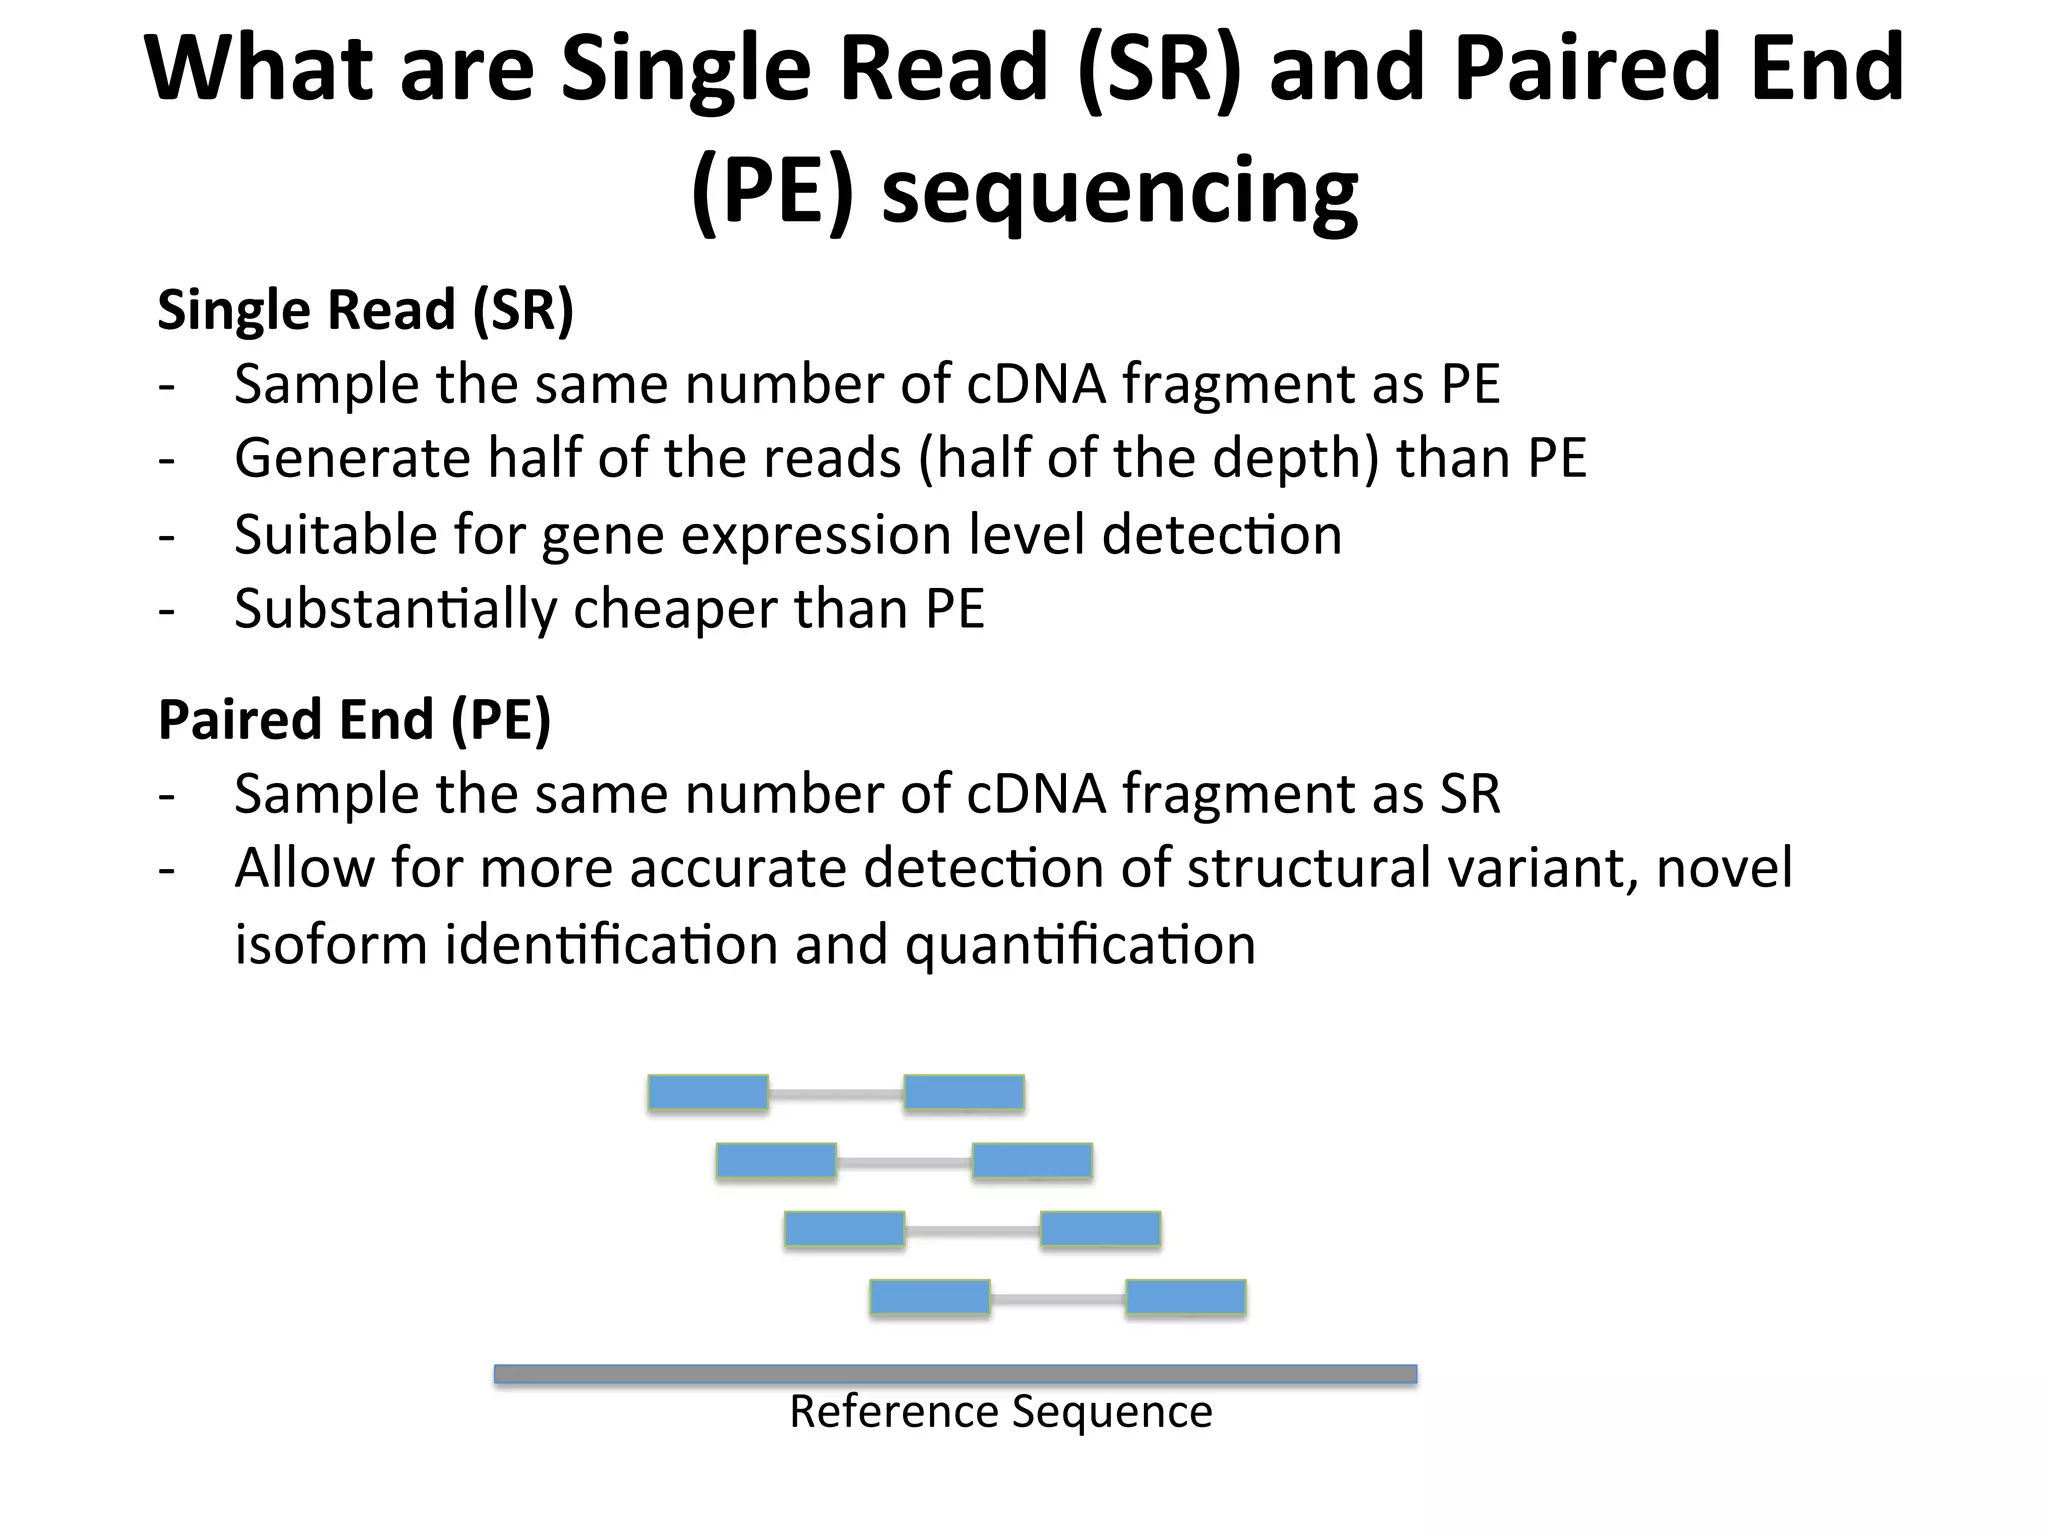
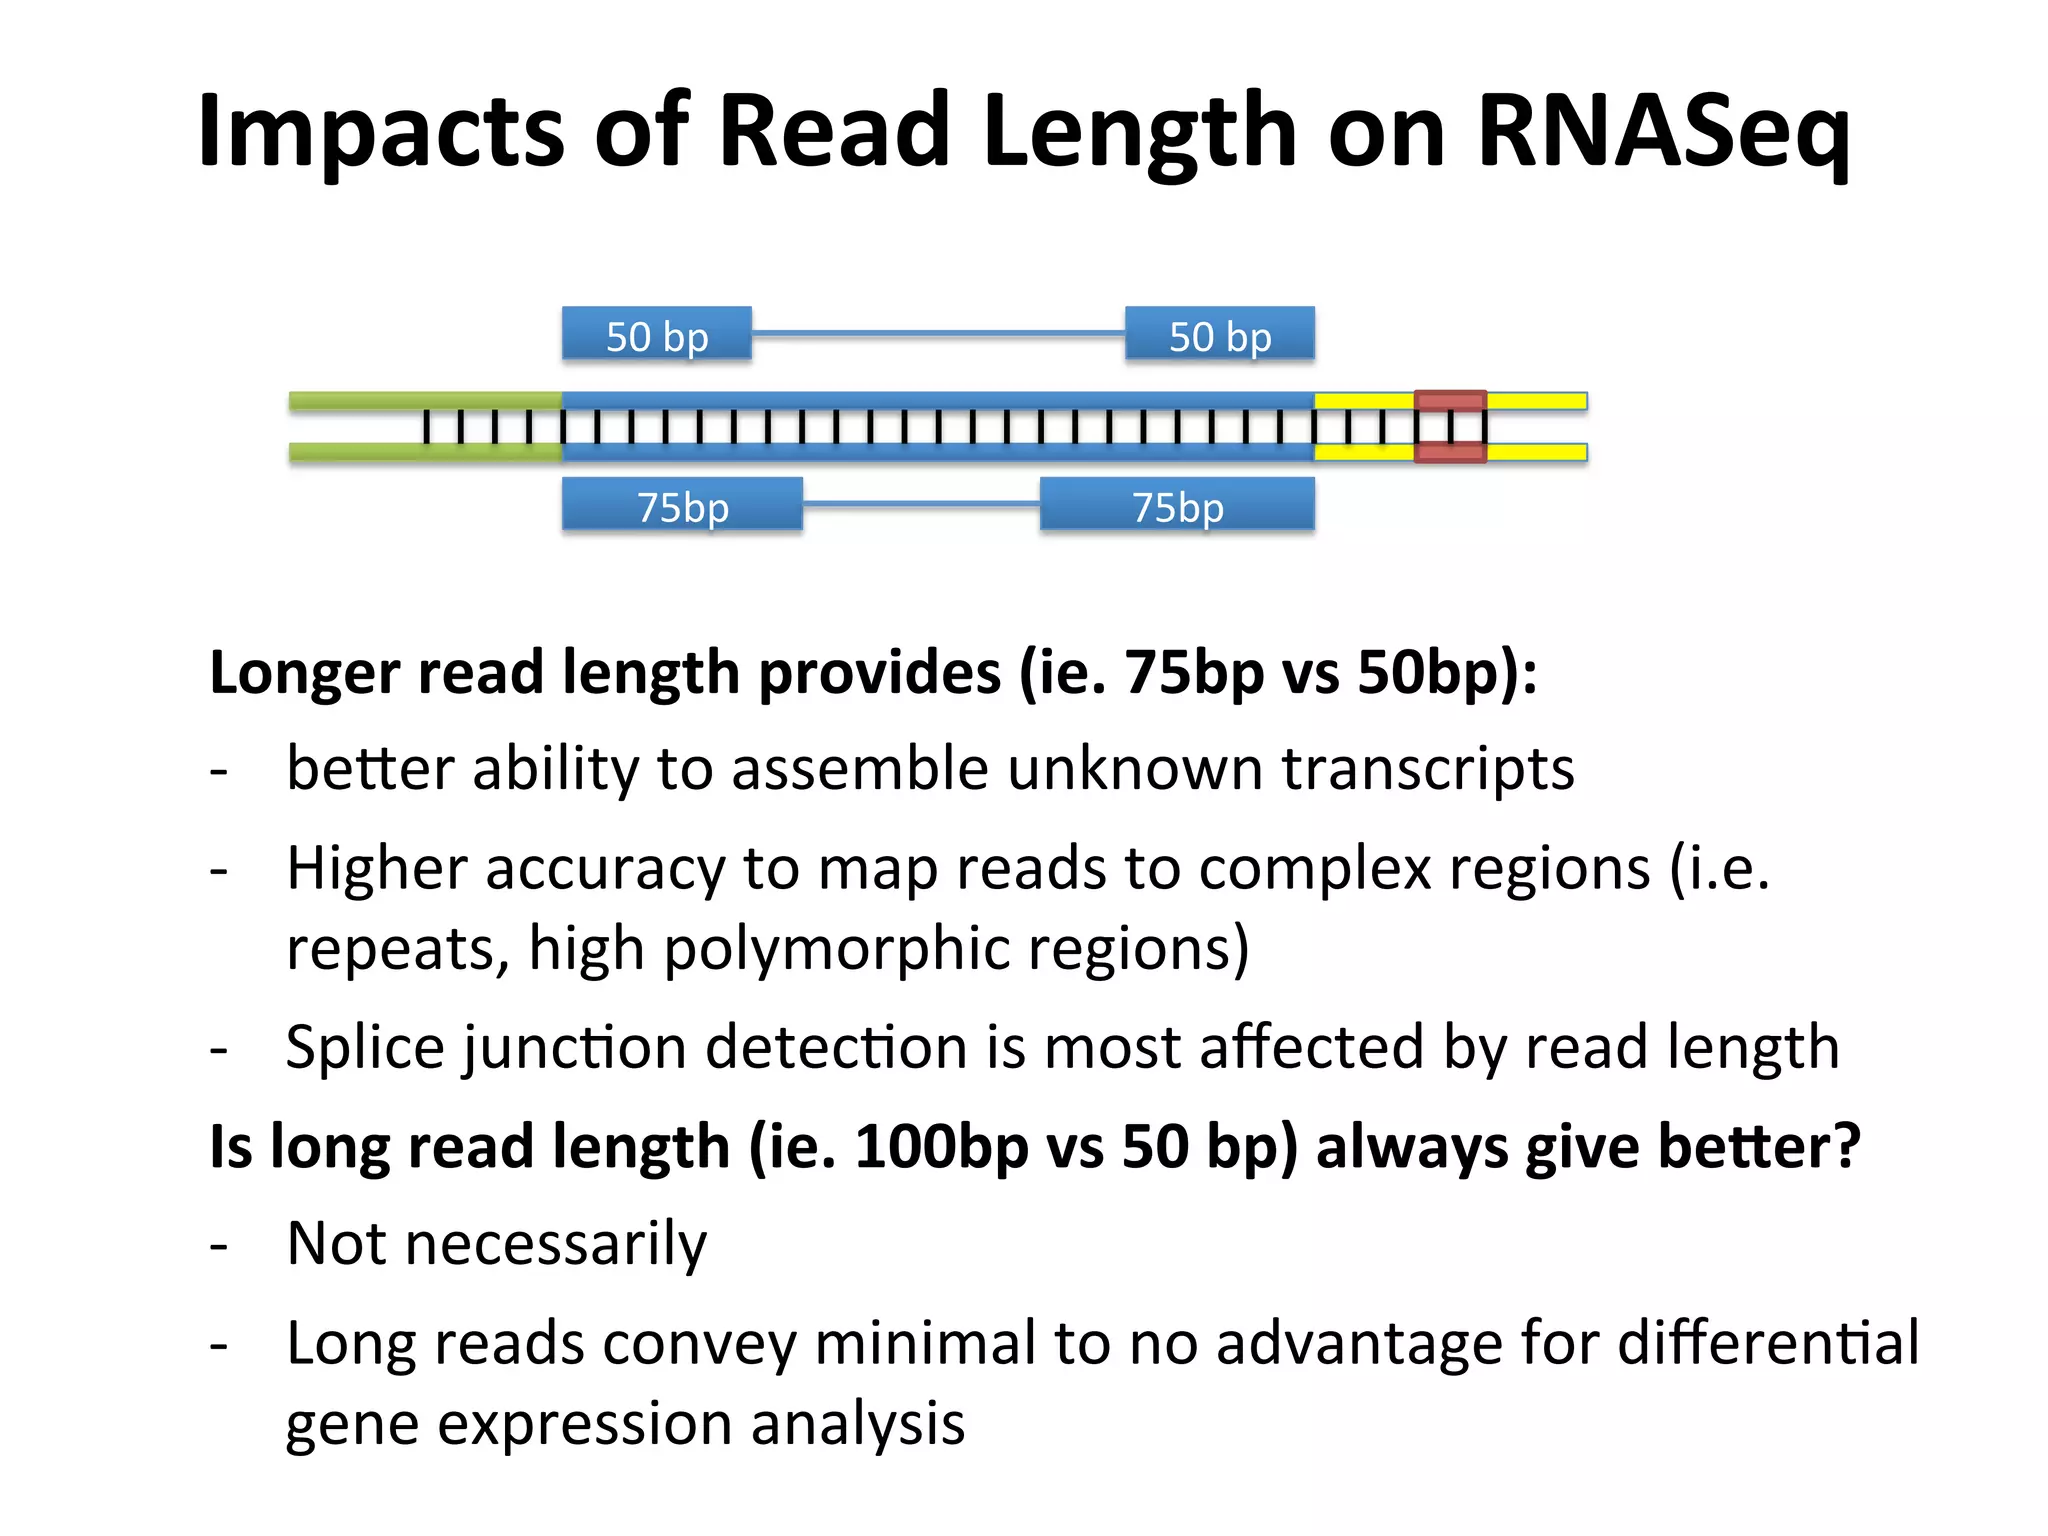
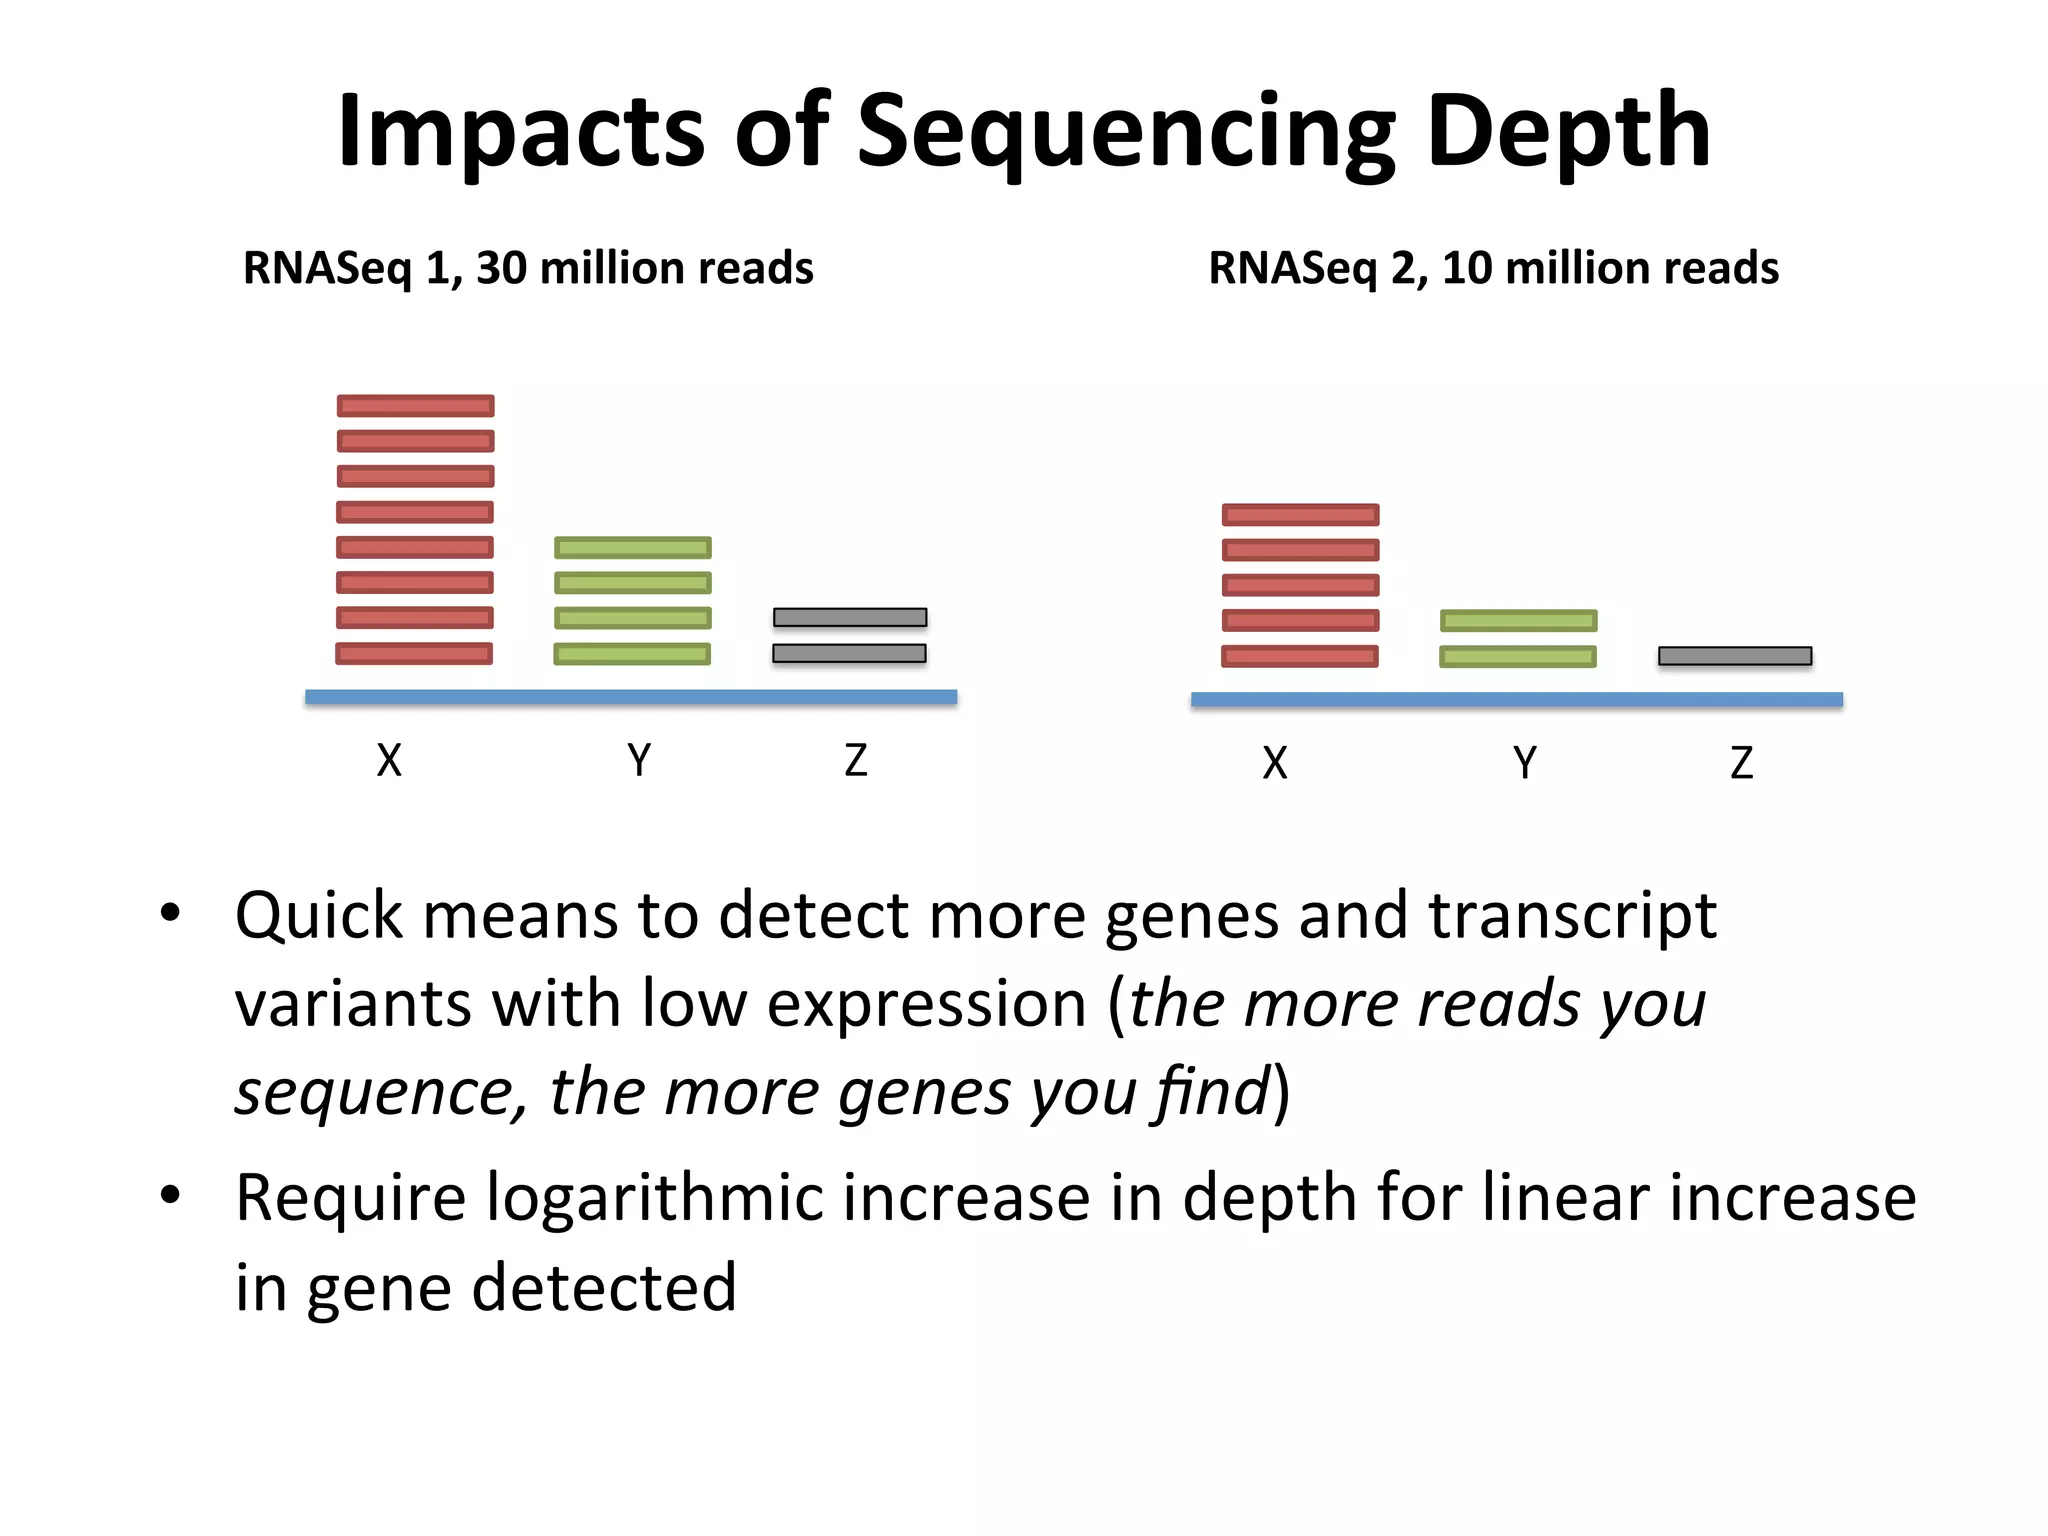
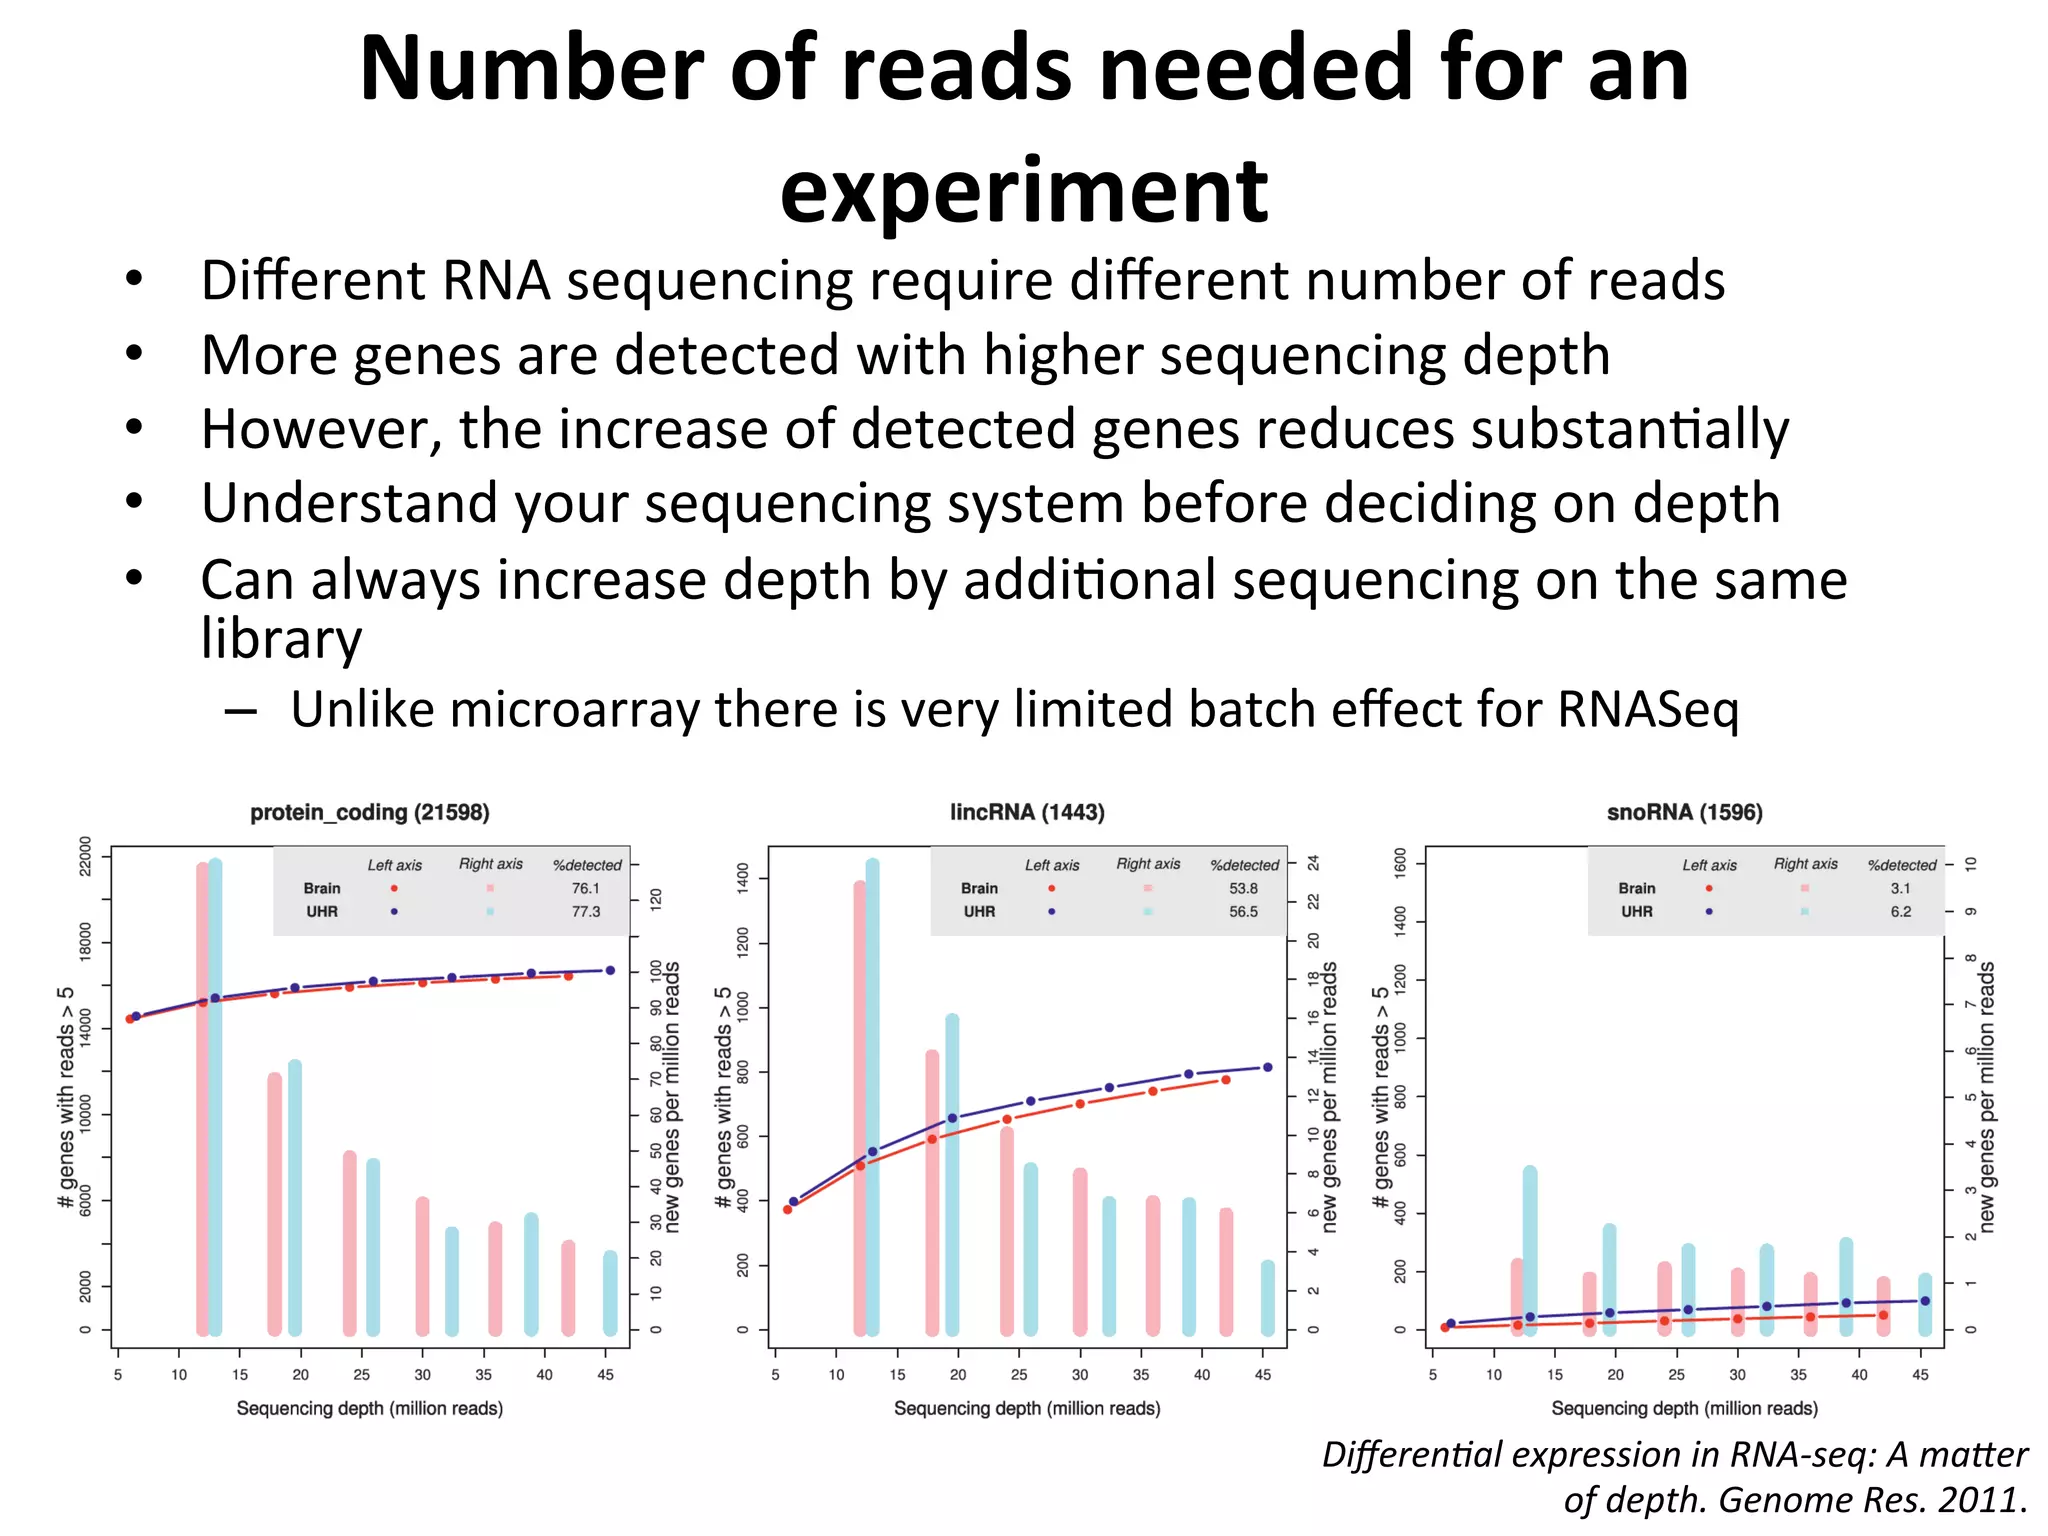
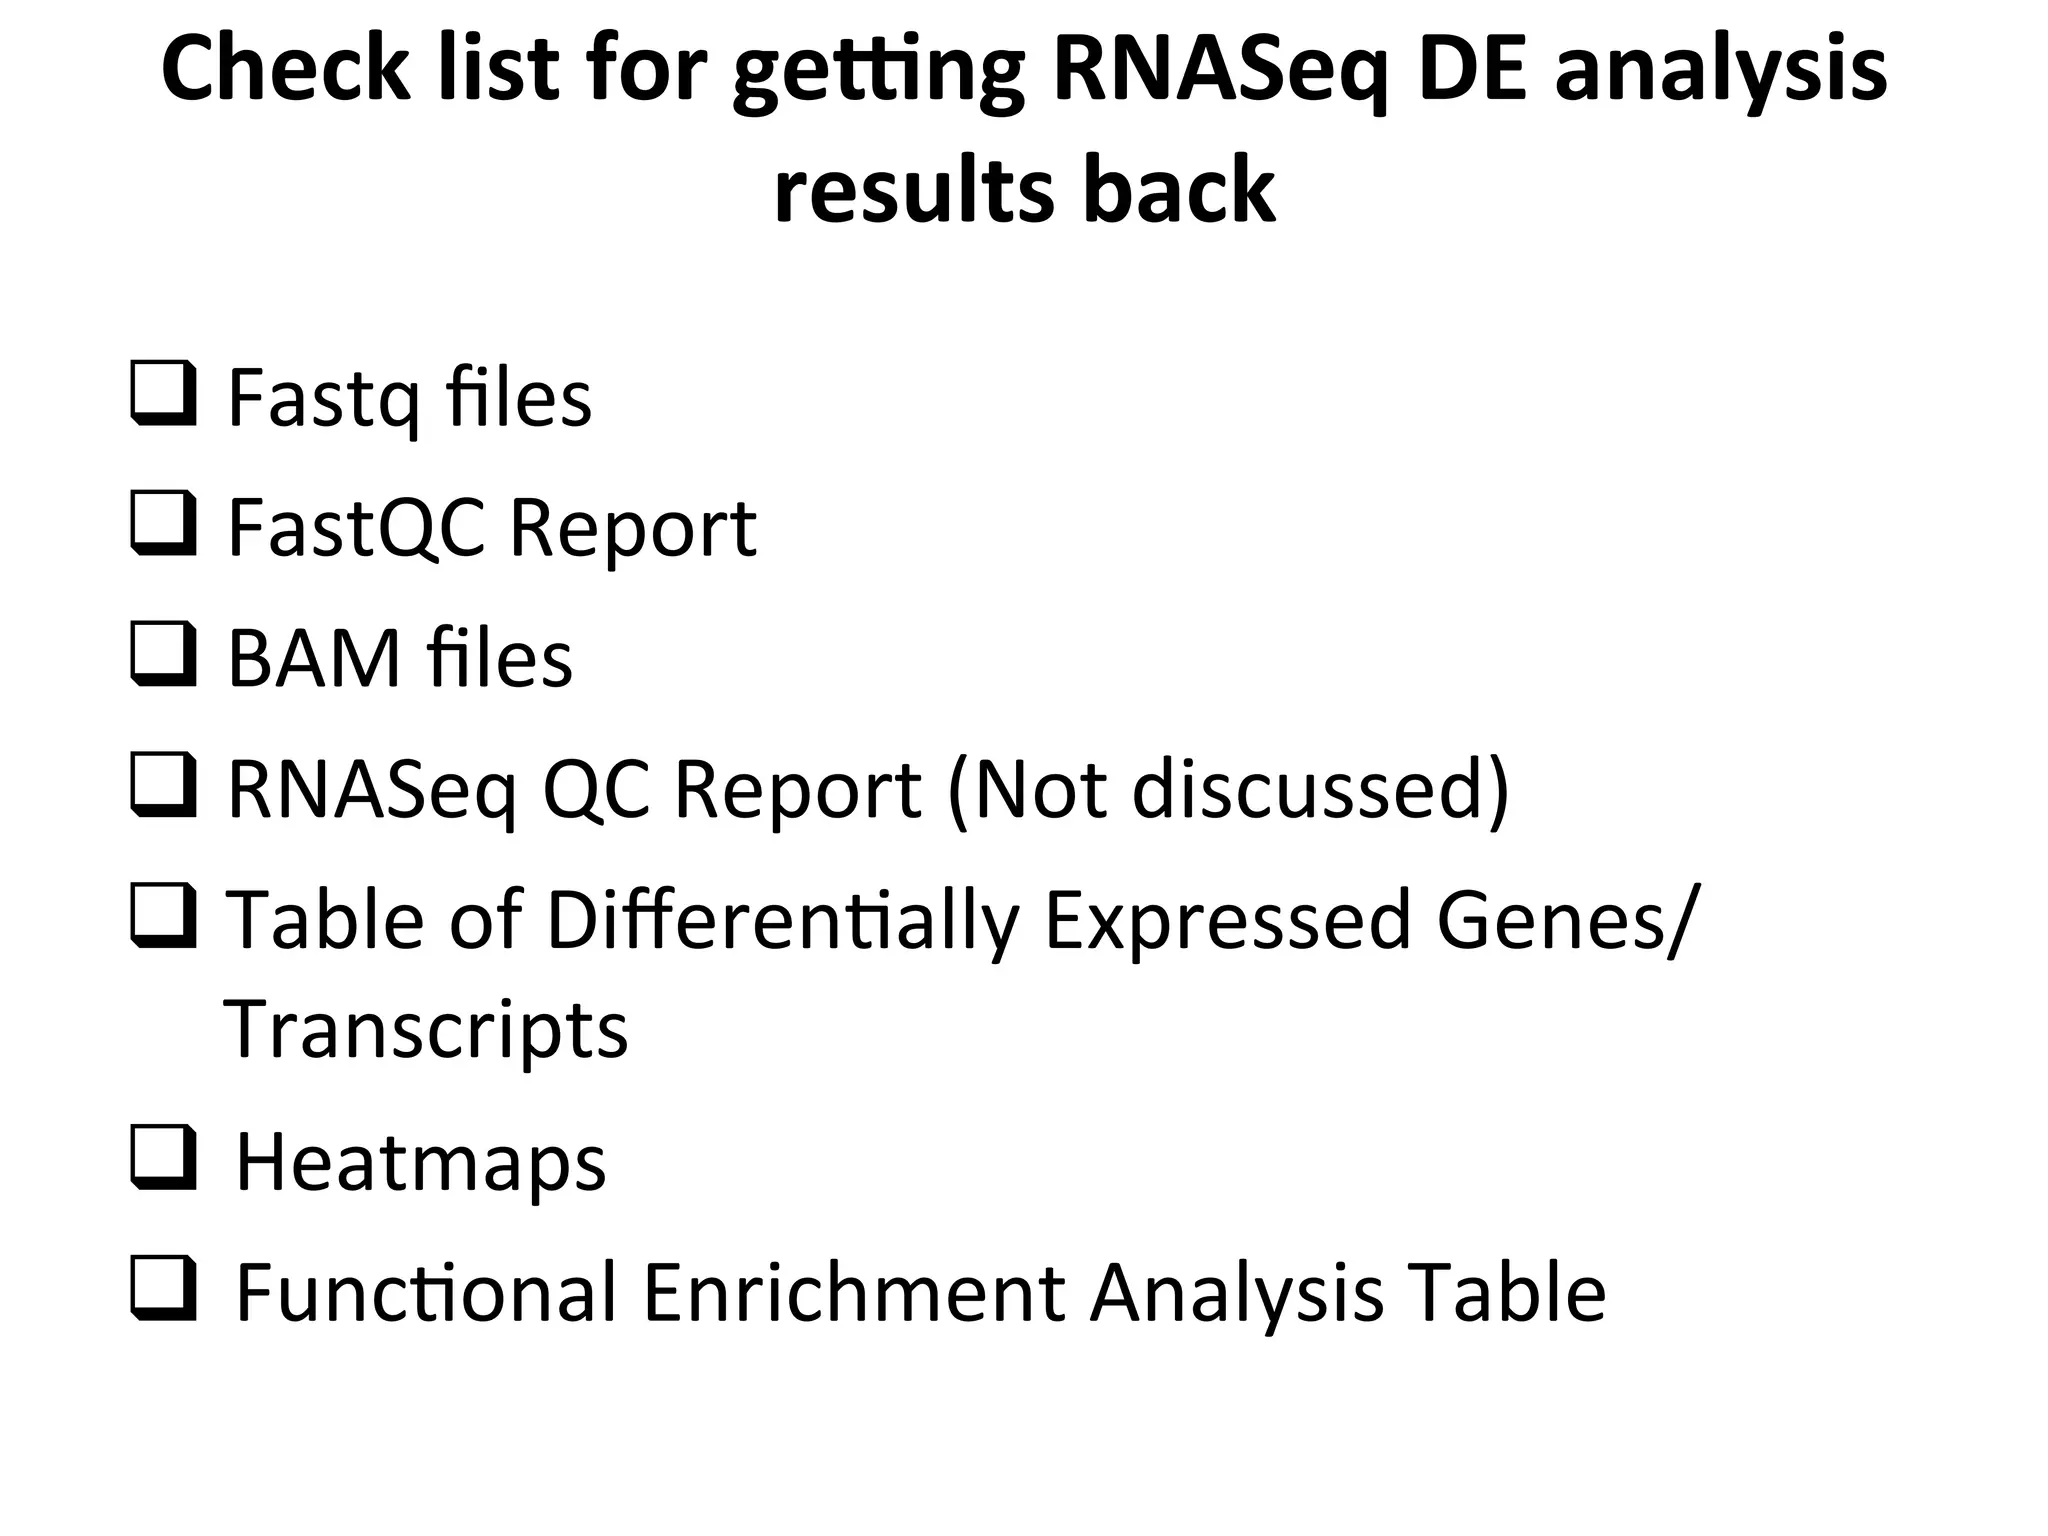
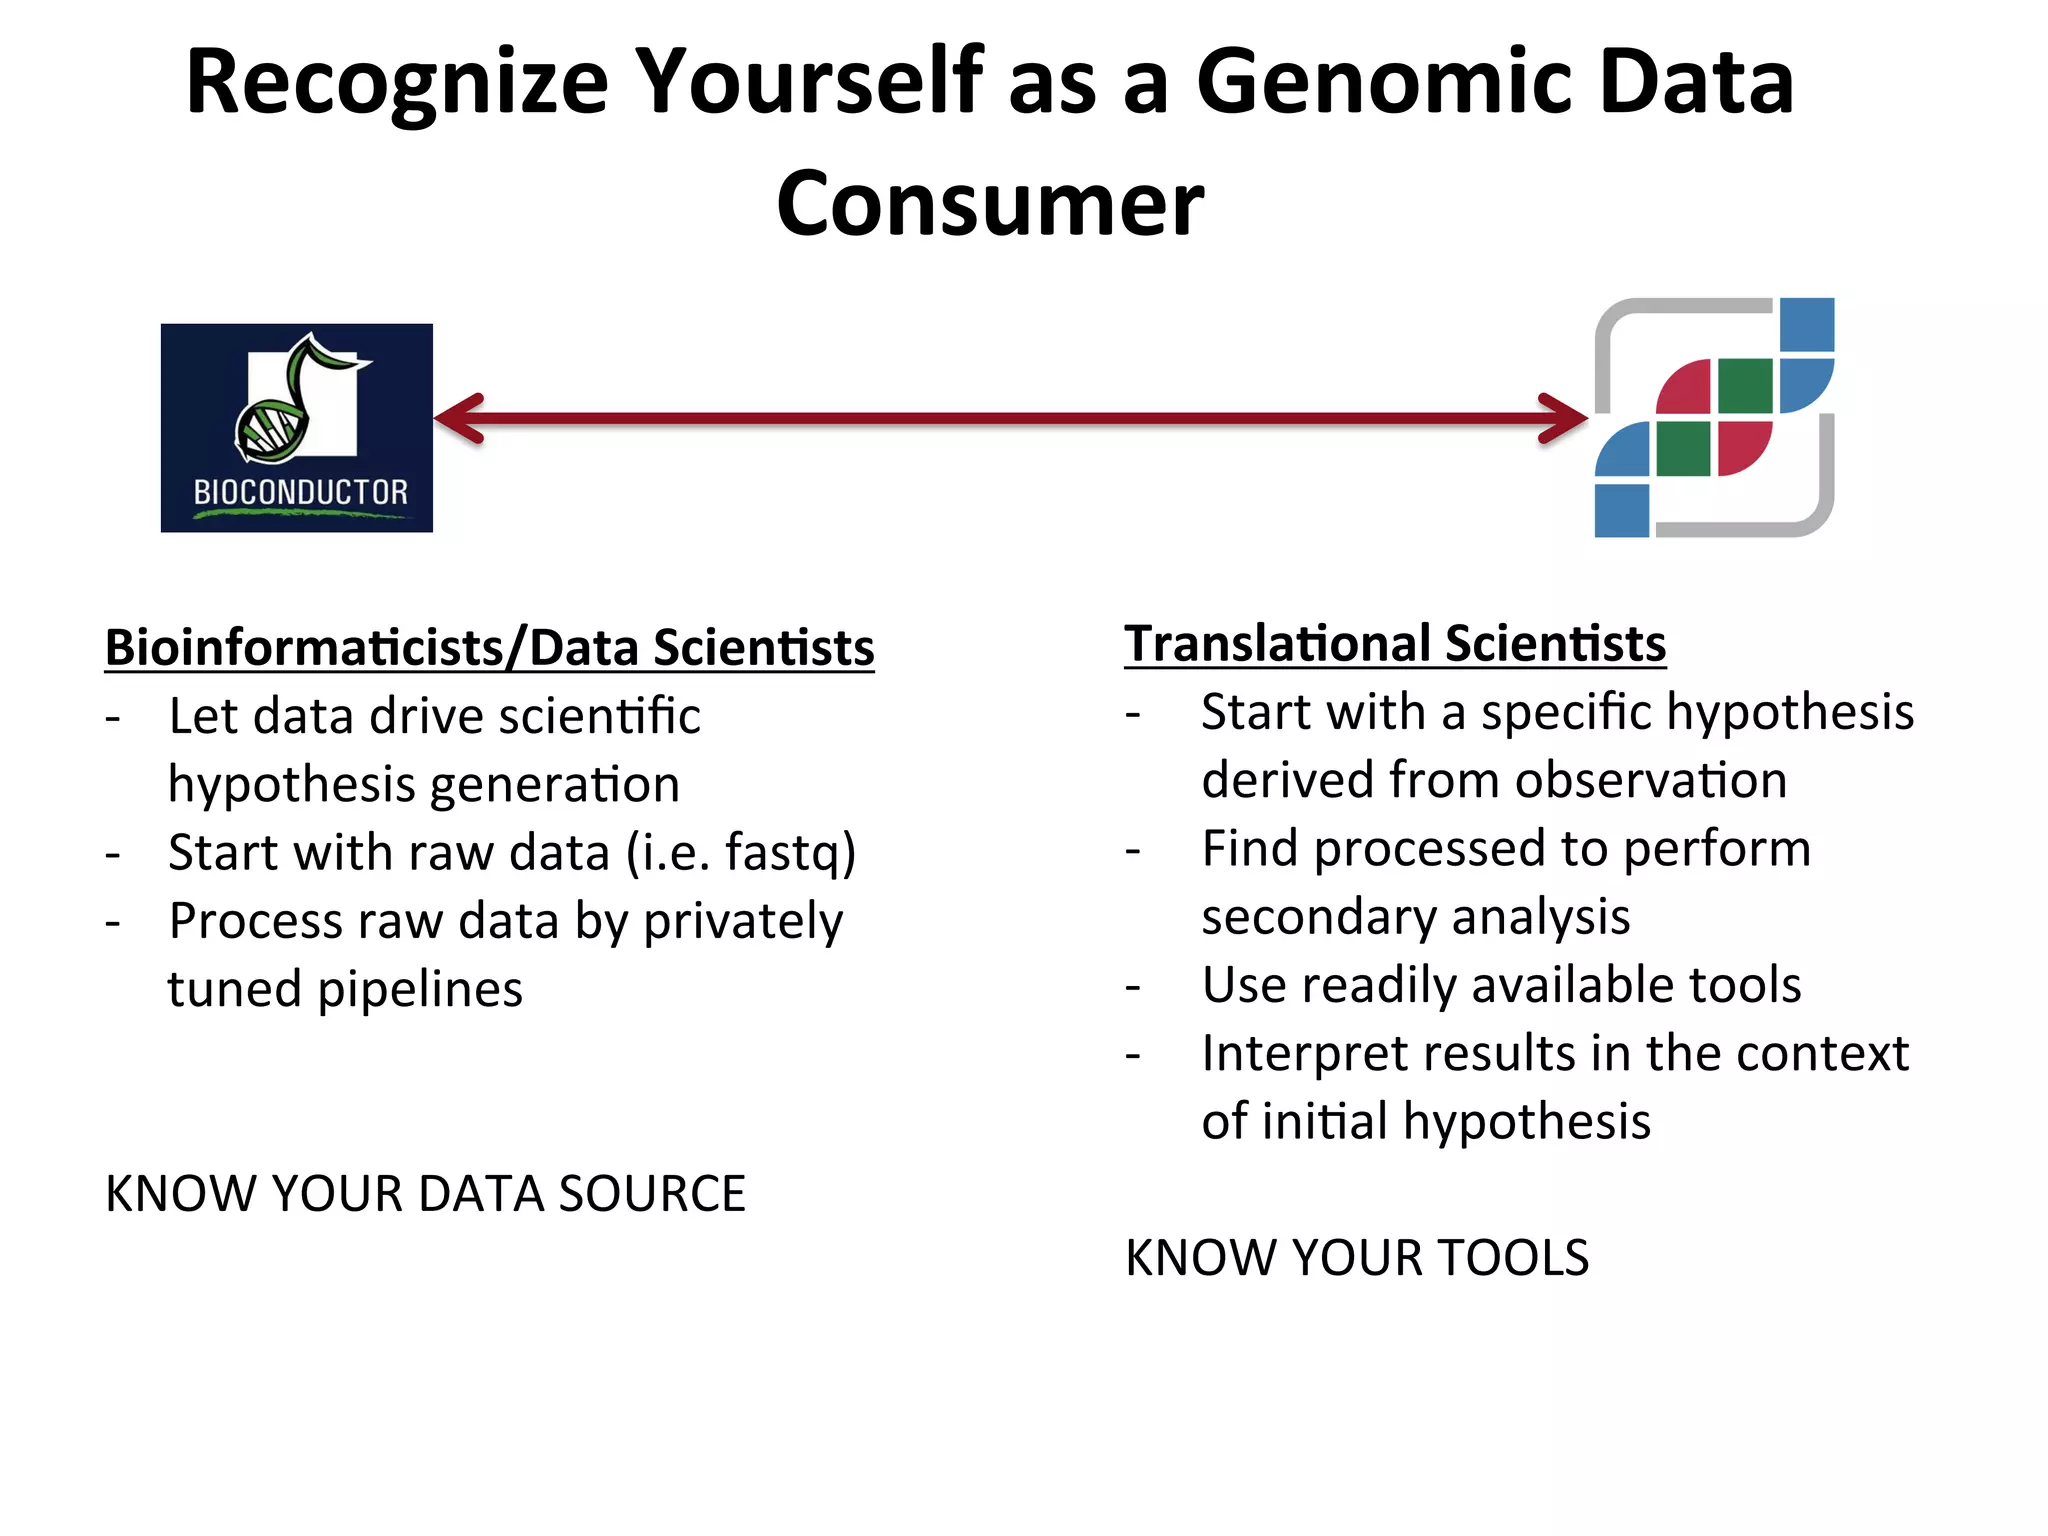
SlideShare a Scribd company logo
1 of 43
NGS	
  APPLICATIONS	
  2:	
  	
  
INTRODUCTION	
  TO	
  RNASEQ	
  ANALYSIS	
  
Overview	
  
•  Earlier:	
  libraries	
  to	
  raw	
  reads.	
  
Now	
  
•  What	
  to	
  do	
  with	
  RNA-­‐seq	
  reads?	
  
•  How	
  to	
  design	
  a	
  RNA-­‐Seq	
  
experiment?	
  
Blencowe B J et al. Genes Dev. 2009;23:1379-1386
Illumina	
  HiSeq	
  
Reads	
  are	
  ready.	
  	
  Now	
  What?	
  
bcl2fastq	
  
Big	
  Fastq	
  files	
  (2-­‐30Gb)	
  
•  Reads	
  represent	
  real	
  biology.	


•  More	
  reads	
  corresponding	
  to	
  a	
  transcript	
  indicate	
  higher	
  abundance	
  of	
  that	
  
transcript.	
  
•  Reads	
  may	
  represent	
  novel	
  transcripts	
  or	
  novel	
  arrangements	
  of	
  exons	
  that	
  are	
  
not	
  present	
  in	
  any	
  known	
  reference	
  genome.	
  
•  New	
  exon-­‐exon	
  juncIons,	
  RNA-­‐ediIng,	
  and	
  nucleoIde	
  variaIons	
  (SNPs)	
  may	
  all	
  
be	
  present	
  in	
  the	
  read	
  data.	
  
How	
  do	
  we	
  translate	
  these	
  raw	
  reads	
  into	
  biological	
  knowledge:	
  	
  start	
  with	
  
sequence	
  alignment.	
  
Reads	
  are	
  ready.	
  	
  Now	
  What?	
  
Fastq	
  
Do	
  we	
  have	
  a	
  
genome	
  reference?	
  
Yes	
  
Do	
  we	
  a	
  transcript/gene	
  
annotaIon	
  reference?	
  
Yes	
  No	
  
No	
  
Perform	
  full	
  de	
  novo	
  
transcriptome	
  construcIon	
  
Perform	
  alignment-­‐guided	
  de	
  novo	
  
transcriptome	
  assembly	
  
Align	
  to	
  the	
  genome.	
  
QuanIficaIon	
  Only:	
  accept	
  
only	
  alignments	
  that	
  
correspond	
  to	
  known	
  
transcripts	
  
Align	
  to	
  known	
  
exons	
  but	
  accept	
  
alternaIve	
  
arrangements.	
  
Align	
  to	
  known	
  
exons	
  plus	
  other	
  
regions.	
  
Like	
  microarray	
  
What	
  to	
  map	
  to?	
  
Map	
  to	
  a	
  genome	
  with	
  no	
  gene	
  annotaSon.	
  
•  Assembling	
  transcripts	
  from	
  exon	
  regions	
  is	
  difficult	
  and	
  requires	
  
complex	
  staIsIcal	
  algorithms.	
  
•  IdenIfying	
  alternaIve	
  transcript	
  isoforms	
  is	
  unreliable.	
  
•  Usually	
  this	
  is	
  best	
  for	
  a	
  novel	
  or	
  unannotated	
  genomes.	


Exons	
  ?	
  
Genome	
  ref	
  
What	
  to	
  map	
  to?	
  
Map	
  to	
  the	
  genome,	
  with	
  knowledge	
  of	
  transcript	
  annotaSons	
  
• Well	
  annotated	
  genome	
  reference	
  is	
  required.	
  
• To	
  effecively	
  map	
  to	
  exon	
  juncIons,	
  you	
  need	
  a	
  mapping	
  
algorithm	
  that	
  can	
  divide	
  the	
  sequencing	
  reads	
  and	
  map	
  porIons	
  
independently.	
  
• IdenIfying	
  alternaIve	
  transcript	
  isoforms	
  involves	
  complex	
  
algorithms.	
  
Which	
  sequence	
  mappers	
  to	
  use?	
  
•  RNASeq	
  Alignment	
  algorithm	
  must	
  be	
  
–  Fast	
  
–  Able	
  to	
  handle	
  SNPs,	
  indels,	
  and	
  sequencing	
  errors	
  
–  Maintain	
  accurate	
  quanIficaIon	


–  Allow	
  for	
  introns	
  for	
  reference	
  genome	
  alignment(spliced	
  alignment	
  
detecIon)	
  
•  Burrows	
  Wheeler	
  Transform(BWT)	
  mappers	
  
–  Fast	
  
–  Limited	
  mismatches	
  allowed	
  (<3)	
  
–  Limited	
  indel	
  detecIon	
  ability	
  
–  Examples:	
  BowIe2,	
  BWA,	
  Tophat	
  	
  
–  Use	
  cases:	
  large	
  and	
  conserved	
  genome	
  and	
  transcriptomes	
  	
  
•  Hash	
  Table	
  mappers	
  
–  Require	
  large	
  amount	
  of	
  RAM	
  for	
  indexing	
  
–  More	
  mismatches	
  allowed	
  
–  Indel	
  detecIon	
  
–  Examples:	
  GSNAP,	
  SHRiMP,	
  STAR	
  
–  Use	
  case:	
  highly	
  variable	
  or	
  smaller	
  genomes,	
  transcriptomes	


RNA-­‐Seq	
  reads	
  
Alignment	
  
Assemble	
  
Transcripts	
  
fastq	
  file	
  
SAM/BAM	
  file	
  
Transcript	
  isoforms	
   Gene	
  or	
  transcript	
  
quanSficaSon	
  
Count	
  reads	
  
HTseq	
  -­‐	
  	
  
h_p://www-­‐huber.embl.de/users/
anders/HTSeq/doc/overview.html	
  
Cufflinks	
  -­‐	
  
h_p://cufflinks.cbcb.umd.edu/	
  
Bioconductor	
  -­‐	
  
h_p://www.bioconductor.org/	
  
Trinity	
  -­‐	
  
h_p://trinityrnaseq.sourceforge.net/	
  
Cufflinks	
  -­‐	
  
h_p://cufflinks.cbcb.umd.edu/	
  
Generalized	
  Analysis	
  Workflow	
  
BowIe2,	
  BWA,	
  Tophat,	
  	
  
GSNAP,	
  SHRiMP,	
  STAR	
  	
  
RNA-­‐Seq	
  reads	
  
Align	
  to	
  the	
  genome	
  using	
  
BowIe/Tophat.	
  
Tophat	
  
Cufflinks	
  
Spliced	
  Fragments	
  align	
  to	
  
known	
  exon-­‐exon	
  juncIons.	
  
Genomic	
  mapped	
  reads	
  may	
  
idenIfy	
  novel	
  isoforms.	
  
fastq	
  file	
  
SAM/BAM	
  file	
  
Genome	
  reference	
  .fasta	
  
Gene	
  annotaSons	
  .g^	
  
Genome	
  reference	
  .fasta	
  
Gene	
  annotaSons	
  .g^	
  
Transcript	
  isoforms	
   Gene/transcript	
  
quanSficaSon	
  
Cufflinks	
  idenIfies	
  mutually	
  
exclusive	
  exons.	
  	
  Graph-­‐based	
  
analysis	
  uses	
  a	
  shortest-­‐path	
  
algorithm	
  to	
  determine	
  	
  
Tophat/Cufflinks	
  
Workflow	
  
Sequence	
  Alignment	
  Files	
  
BAM/SAM	
  alignment	
  files	
  
• SAM	
  file	
  is	
  the	
  standard	
  alignment	
  file	
  format	
  generated	
  from	
  
all	
  mappers	
  
• All	
  alignments	
  files	
  are	
  stored	
  in	
  a	
  BAM	
  file,	
  an	
  industry	
  
standard.	
  
• BAM	
  is	
  a	
  compressed	
  (binary)	
  version	
  of	
  the	
  SAM	
  file.	
  	
  BAM	
  is	
  
not	
  readable.	
  	
  It	
  can	
  be	
  indexed	
  so	
  that	
  huge	
  alignment	
  files	
  
can	
  be	
  read	
  and	
  searched	
  rapidly	
  by	
  other	
  tools	
  and	
  genome	
  
browsers.	
  
• A	
  suite	
  of	
  tools	
  (called	
  “samtools”)	
  is	
  used	
  to	
  convert	
  between	
  
SAM	
  and	
  BAM.	
  
• Samtools	
  can	
  also	
  be	
  used	
  to	
  index	
  bam	
  file	
  for	
  faster	
  
visualizaIon,	
  on	
  IGV	
  or	
  UCSC	
  Genome	
  Browser	


SAM	
  format	
  
h_p://samtools.sourceforge.net/SAM1.pdf	
  
Format	
  version	
  
Ref	
  seq	
  name	
  
Ref	
  seq	
  length	
  
Sort	
  order	
  
Cigar	
  String	
  
h_p://samtools.sourceforge.net/SAM1.pdf	
  
CIGAR	
  Strings	
  
Compact	
  IdiosyncraIc	
  Gapped	
  Alignment	
  Report	
  
DifferenSal	
  Gene	
  Expression	
  Analysis	
  
•  Given	
  samples	
  from	
  different	
  
experimental	
  condiIons,	
  find	
  
changes	
  in	
  transcriptome	
  
profiles	
  
•  Allows	
  for	
  hypothesis	
  
genera0on	
  on	
  molecular	
  
abnormaliIes	
  and	
  mechanisms	
  
that	
  may	
  contribute	
  to	
  the	
  
tumor	
  phenotype	
  
•  Provides	
  insights	
  to	
  potenIal	
  
biological	
  mechanisms	
  
associated	
  with	
  experimental/
diseased	
  condiIons	
  	
  
Sample
annotations STAR aligner
featureCounts	
  
DESeq,	
  GSEA,	
  QC	
  
HTML	
  report	
  
Standard	
  Transcriptome	
  Sequencing	
  Pipeline	
  
This	
  is	
  really	
  a	
  simple	
  sequence	
  counSng	
  
problem	
  
Data:	
  	
  NGS	
  randomly	
  sample	
  and	
  sequence	
  all	
  gene	
  
transcripts	
  from	
  samples	
  (so	
  the	
  number	
  of	
  reads	
  
correlate	
  with	
  the	
  number	
  of	
  transcripts)	


ObjecSve:	
  	
  Does	
  gene	
  X	
  has	
  more	
  copies	
  in	
  condiIon	
  Z	
  
than	
  in	
  B	
  (Z>B)?	
  	
  
X	
   Y	
   Z	
   X	
   Y	
   Z	
  
CondiSon	
  Z	
   CondiSon	
  B	
  
CounSng	
  Rules	
  for	
  RNASeq	
  
•  Count	
  mapped	
  reads,	
  not	
  base-­‐pairs	
  
•  Count	
  each	
  read	
  at	
  most	
  once	
  
•  Discard	
  a	
  read	
  if	
  
–  It	
  cannot	
  be	
  uniquely	
  mapped	
  
–  Its	
  alignment	
  overlaps	
  with	
  several	
  genes	
  
–  The	
  alignment	
  quality	
  score	
  is	
  bad	
  
–  (for	
  paired-­‐end	
  reads)	
  the	
  mates	
  do	
  not	
  map	
  to	
  the	
  
same	
  genes	
  (poten0al	
  fusion	
  genes)	
  
•  Do	
  not	
  discard	
  if	
  there	
  is	
  read	
  duplicates	
  (same	
  
reads	
  appear	
  mulIple	
  Imes)	
  
•  Keep	
  track	
  of	
  alignment	
  method	
  and	
  parameters	


What	
  kind	
  of	
  quesSons	
  can	
  be	
  answered	
  
from	
  sequence	
  count	
  data?	
  
Gene	
   	
  Healthy1	
   Health	
  2	
   Health	
  3	
   PaSent	
  1	
   PaSent	
  2	
   PaSent	
  3	
  
CCT2	
   50	
   60	
   45	
   75	
   5	
   69	
  
TP53	
   30	
   72	
   30	
   127	
   40	
   80	
  
CXCR5	
   3	
   10	
   60	
   20	
   5	
   40	
  
Gene	
  Sequence	
  Count	
  Data	
  
Is	
  gene	
  TP53	
  upregulated	
  in	
  paSent	
  samples?	
  
-­‐  Hint:	
  If	
  healthy	
  samples	
  were	
  sequenced	
  at	
  20	
  million	
  reads	
  and	
  
paIent	
  samples	
  were	
  sequenced	
  at	
  80	
  million	
  reads,	
  does	
  it	
  
change	
  the	
  answer?	


Is	
  there	
  more	
  TP53	
  transcript	
  copies	
  compare	
  to	
  
CCT2?	
  
-­‐  Hint:	
  TP53	
  transcript	
  is	
  a	
  lot	
  longer	
  than	
  CCT2	
  
Direct	
  comparison	
  of	
  read	
  counts	
  per	
  
gene	
  is	
  problemaSc	
  	
  
More	
  sequence	
  reads	
  mapped	
  to	
  a	
  transcript	
  if	
  it	
  is	
  
a)	
  Long	


b)	
  At	
  higher	
  depth	
  of	
  Coverage	
  
Read	
  Counts	
  =	
  12,	
  Depth	
  =	
  3X,	
   Read	
  Counts	
  =	
  5,	
  Depth	
  =	
  3X	
  
Read	
  Counts	
  =	
  11,	
  Depth	
  =	
  5X	
   Read	
  Counts	
  =	
  5,	
  Depth	
  =	
  3X	
  
Cannot	
  claim	
  blue	
  transcript	
  is	
  transcribed	
  at	
  a	
  higher	
  level	
  	
  
than	
  green	
  transcript	
  based	
  on	
  read	
  counts	
  
NormalizaSon	
  RNASeq	
  Count	
  Data	
  	
  
•  Data	
  NormalizaIon	
  is	
  ALWAYS	
  required	
  to	
  
compare	
  one	
  sequencing	
  result	
  to	
  another	
  
•  Bring	
  count	
  data	
  from	
  different	
  experiments	
  to	
  
the	
  same	
  scale	
  for	
  comparison	
  
•  RNASeq	
  count	
  data	
  normalizaIon	
  wants	
  to	
  adjust	
  
data	
  such	
  that:	
  
–  gene	
  with	
  different	
  lengths	
  can	
  be	
  compared	
  
–  Total	
  sequence	
  counts	
  are	
  considered	
  
RPKM:	
  Reads	
  per	
  Kilobase	
  per	
  Million	
  
Mapped	
  Reads	
  
C	
  =	
  #	
  of	
  mappable	
  reads	
  in	
  a	
  feature	
  (exon	
  or	
  transcript)	
  
N	
  =	
  #	
  of	
  mappable	
  reads	
  in	
  the	
  experiment	
  	
  
L	
  =	
  length	
  of	
  the	
  feature	
  in	
  base	
  pairs	
  
The	
  easiest	
  way	
  to	
  normalize	
  is	
  take	
  the	
  number	
  of	
  the	
  mapped	
  
reads	
  on	
  a	
  transcript	
  and	
  divide	
  by	
  the	
  length	
  of	
  the	
  transcript	
  
and	
  the	
  number	
  of	
  total	
  read	
  	
  
Nature	
  Methods	
  -­‐	
  5,	
  621	
  -­‐	
  628	
  (2008)	
  	
  
•  Generally	
  correct	
  for	
  biases	
  
•  Vulnerable	
  to	
  bias	
  by	
  a	
  few	
  highly	
  expressed	
  genes	
  driving	
  N	
  to	
  
be	
  large	
  
•  Used	
  to	
  be	
  the	
  standard,	
  but	
  not	
  anymore	
  
Other	
  NormalizaSon	
  Methods	
  
Upper	
  QuarSle	
  Method	
  
Aim:	
  Correct	
  for	
  the	
  bias	
  that	
  total	
  read	
  count	
  is	
  strongly	
  dependent	
  
on	
  a	
  few	
  highly	
  expressed	
  transcripts	
  
Method:	
  Use	
  the	
  top	
  25%	
  (upper	
  quarIle)most	
  expressed	
  
transcripts	
  as	
  scaling	
  factor	
  and	
  report	
  back	
  Normalized	
  Count	


Geometric	
  Mean	
  Method	
  (the	
  DESeq	
  method)	
  
Aim:	
  to	
  minimize	
  the	
  effect	
  of	
  majority	
  of	
  sequences	
  and	
  
concentrate	
  on	
  variaIon	
  between	
  condiIons	
  
AssumpSon:	
  	
  A	
  majority	
  of	
  transcripts	
  is	
  not	
  differenIally	
  expressed	
  
Method:	
  	
  Take	
  geometric	
  means	
  of	
  read	
  counts	
  as	
  reference	
  value	
  sj	
  
to	
  normalize	
  transcript	
  count	


Bullard	
  et	
  al.	
  BMC	
  Bioinforma0cs	
  2010,	
  11:94	
  
kij=number	
  of	
  reads	
  in	
  sample	
  j	
  assigned	
  to	
  gene	
  i	
  
v	
  =	
  sample	
  1	
  to	
  m	
  
Inferring	
  DifferenSal	
  Expression	
  (DE)	
  
Method	
   NormalizaS
on	
  
Needs	
  
replicas	
  
Input	
   StaSsScs	
  for	
  
DE	
  
Availability	
  
edgeR	
   Library	
  size	
  	
   Yes	
   Raw	
  
counts	
  
Empirical	
  
Bayesian	
  
esImaIon	
  based	
  
on	
  NegaIve	
  
binomial	
  
distribuIon	
  
R/Bioconductor	
  
DESeq	
   Library	
  size	
   No	
   Raw	
  
counts	
  
NegaIve	
  
binomial	
  
distribuIon	
  
R/Bioconductor	


baySeq	
   Library	
  size	
   Yes	
   Raw	
  
counts	
  
Empirical	
  
Bayesian	
  
esImaIon	
  based	
  
on	
  NegaIve	
  
binomial	
  
distribuIon	
  
R/Bioconductor	


LIMMA	
   Library	
  size	
   Yes	
   Raw	
  
counts	
  
Empirical	
  
Bayesian	
  
esImaIon	
  
R/Bioconductor	


CuffDiff	
   RPKM	
   No	
   RPKM	
   Log	
  raIo	
   Standalone	
  
Typical	
  DE	
  Result	
  Table	
  
Gene	
  or	
  
transcript	
  
name	
  
Mean	
  expression	
  
levels	
  
Fold	
  Change:	
  measurement	
  of	
  
changing	
  magnitude,	
  calculated	
  as	


FC=baseMeanB/baseMeanA	


Typically	
  Log2(FC)	
  is	
  reported	
  
Significance:	
  use	
  adjusted	
  P	
  
value	
  (padj)	
  instead	
  of	
  raw	
  P	
  
value	
  (pval)	
  unless	
  you	
  know	
  
what	
  you	
  are	
  doing	
  
Why	
  use	
  adjusted	
  P-­‐value	
  instead	
  of	
  raw	
  
P-­‐value?	
  
MulSple	
  Comparison	
  Problem	
  –	
  When	
  large	
  number	
  of	
  staIsIcal	
  tests	
  were	
  
performed	
  simultaneously	
  (as	
  in	
  genomic	
  analysis),	
  some	
  tests	
  will	
  
have	
  P	
  values	
  less	
  than	
  0.05	
  purely	
  by	
  chance,	
  even	
  if	
  all	
  your	
  null	
  hypotheses	
  
are	
  really	
  true.	


Benne@-­‐Salmon-­‐2009	
  
The	
  Dead	
  Thinking	
  Salmon	
  Experiment	
  
-­‐  Buy	
  a	
  whole	
  salmon	
  
-­‐  Take	
  fMRI	
  image	
  of	
  the	
  salmon,	
  which	
  
similar	
  to	
  genomic	
  analysis	
  asks	
  the	
  
quesIon	
  if	
  a	
  small	
  region	
  (voxels)	
  of	
  the	
  
brain	
  is	
  acIve	
  
-­‐  Some	
  region	
  WILL	
  BE	
  significantly	
  acIve	
  
if	
  enough	
  of	
  picture	
  and	
  	
  enough	
  of	
  
voxel	
  are	
  taken	
  
-­‐  SuggesIng	
  the	
  dead	
  salmon	
  is	
  
thinking…	
  
-­‐  Nothing	
  is	
  significant	
  if	
  p-­‐val	
  is	
  adjusted	
  
Methods	
  for	
  Adjustment:	
  	
  Bonferroni	
  correcIon,	
  FDR	
  controlling	
  procedures	
  
Heatmap	
  and	
  Hierarchical	
  Clustering	
  
•  Most	
  common	
  representaIon	
  
for	
  differenIal	
  expression	
  
analysis	
  
•  Hierarchical	
  clustering	
  on	
  both	
  
samples	
  are	
  genes	
  are	
  oven	
  
performed	
  to	
  idenIfy	
  similar	
  
samples/genes	
  
•  Can	
  be	
  generated	
  using	
  many	
  
tools,	
  such	
  as	
  R/Bioconductor	
  
heatmap	
  and	
  gplots	
  package	


FuncSonal	
  Enrichment	
  Analysis	
  
•  Use	
  gene	
  expression	
  to	
  idenIfy	
  pathways	
  or	
  gene	
  
funcIons	
  that	
  are	
  over-­‐represented	
  
•  Address	
  the	
  quesIon:	
  “What	
  biological	
  funcIons	
  
are	
  different	
  between	
  sample	
  groups?”	
  
•  Many	
  open-­‐source	
  and	
  proprietary	
  tools	
  
–  GSEA	
  (h_p://www.broadinsItute.org/gsea/index.jsp)	
  
–  DAVID	
  (h_ps://david.ncifcrf.gov)	
  
–  TopGO/GOSEQ	
  (R/Bioconductor)	
  
–  Ingenuity	
  Pathway	
  Analysis	
  (QIAGEN,	
  proprietary)	
  
•  Detailed	
  discussion	
  is	
  out	
  of	
  scope	
  for	
  this	
  course	
  
DESIGN	
  RNASEQ	
  EXPERIMENT	
  
Design	
  RNASeq	
  Experiment	
  
•  Biological	
  Comparison(s)	
  
•  Replicates	
  
•  Read	
  length	
  
•  Paired	
  End/Single	
  Read	
  
•  Read	
  depth	
  
•  Pooling	
  
Biological	
  System	
  in	
  QuesIons	
  
Simple	
  QuesSon	
  
Complex	
  QuesSon	
  
Examples:	
  
•  Cell	
  line	
  groups	
  treated	
  with	
  
different	
  condiIons	
  
•  PaIent	
  groups	
  with	
  the	
  same	
  
disease	
  treated	
  with	
  different	
  
treatment	
  
Examples:	
  
•  Matched	
  paIent	
  samples	
  from	
  both	
  
normal	
  and	
  diseased	
  Issues	
  
•  Normal	
  and	
  cancer	
  samples	
  
obtained	
  from	
  genotypically	
  diverse	
  
populaIon	
  
Experimental	
  QuesSons	
  
•  What	
  are	
  my	
  goals?	
  
–  DifferenIal	
  expression	
  analysis	
  of	
  genes?	
  
–  DifferenIal	
  expression	
  analysis	
  of	
  transcripts?	
  
–  IdenIfy	
  rare	
  transcript	
  isoforms?	
  
–  IdenIfy	
  transcript	
  polymorphism?	
  
–  IdenIfy	
  non-­‐coding	
  RNA	
  populaIons	
  such	
  as	
  miRNA,	
  
lincRNA?	
  	
  
•  What	
  are	
  the	
  characterisScs	
  of	
  systems?	
  
–  Large,	
  complex	
  genome	
  ?	
  (ie.	
  Human)	
  
–  Highly	
  heterogeneous	
  sample	
  populaIon	
  ?	
  (i.e.	
  breast	
  
tumor)	
  
–  No	
  reference	
  genome	
  or	
  transcriptome	
  ?	
  
–  High	
  degree	
  of	
  alternaIve	
  splicing?	
  
Experimental	
  QuesSons	
  
What	
  are	
  the	
  sequencing	
  opIons?	
  
How	
  much	
  money	
  to	
  spend?	
  
What	
  are	
  Single	
  Read	
  (SR)	
  and	
  Paired	
  End	
  
(PE)	
  sequencing	
  
cDNA	
  
Single	
  Read	
  (SR)	
  :	
  	
  only	
  one	
  end	
  from	
  each	
  cDNA	
  fragment	
  
is	
  sequenced	
  to	
  generate	
  one	
  read	
  per	
  fragment	
  
Paired	
  End	
  (PE)	
  :	
  the	
  cDNA	
  fragment	
  is	
  sequenced	
  from	
  
both	
  ends	
  to	
  generate	
  two	
  reads	
  per	
  fragment	
  from	
  two	
  
direcIons	
  
What	
  are	
  Single	
  Read	
  (SR)	
  and	
  Paired	
  End	
  
(PE)	
  sequencing	
  
Single	
  Read	
  (SR)	
  
-­‐  Sample	
  the	
  same	
  number	
  of	
  cDNA	
  fragment	
  as	
  PE	
  
-­‐  Generate	
  half	
  of	
  the	
  reads	
  (half	
  of	
  the	
  depth)	
  than	
  PE	
  
-­‐  Suitable	
  for	
  gene	
  expression	
  level	
  detecIon	
  	
  
-­‐  SubstanIally	
  cheaper	
  than	
  PE	
  
Paired	
  End	
  (PE)	
  
-­‐  Sample	
  the	
  same	
  number	
  of	
  cDNA	
  fragment	
  as	
  SR	
  
-­‐  Allow	
  for	
  more	
  accurate	
  detecIon	
  of	
  structural	
  variant,	
  novel	
  
isoform	
  idenIficaIon	
  and	
  quanIficaIon 	
  	
  
Reference	
  Sequence	
  
Impacts	
  of	
  Read	
  Length	
  on	
  RNASeq	
  
Longer	
  read	
  length	
  provides	
  (ie.	
  75bp	
  vs	
  50bp):	
  
-­‐  be_er	
  ability	
  to	
  assemble	
  unknown	
  transcripts	
  
-­‐  Higher	
  accuracy	
  to	
  map	
  reads	
  to	
  complex	
  regions	
  (i.e.	
  
repeats,	
  high	
  polymorphic	
  regions)	
  
-­‐  Splice	
  juncIon	
  detecIon	
  is	
  most	
  affected	
  by	
  read	
  length	
  
Is	
  long	
  read	
  length	
  (ie.	
  100bp	
  vs	
  50	
  bp)	
  always	
  give	
  bejer?	
  
-­‐  Not	
  necessarily	
  
-­‐  Long	
  reads	
  convey	
  minimal	
  to	
  no	
  advantage	
  for	
  differenIal	
  
gene	
  expression	
  analysis	
  
50	
  bp	
  
75bp	
  
50	
  bp	
  
75bp	
  
Impacts	
  of	
  Sequencing	
  Depth	
  
•  Quick	
  means	
  to	
  detect	
  more	
  genes	
  and	
  transcript	
  
variants	
  with	
  low	
  expression	
  (the	
  more	
  reads	
  you	
  
sequence,	
  the	
  more	
  genes	
  you	
  find)	
  
•  Require	
  logarithmic	
  increase	
  in	
  depth	
  for	
  linear	
  increase	
  
in	
  gene	
  detected	
  
X	
   Y	
   Z	
   X	
   Y	
   Z	
  
RNASeq	
  1,	
  30	
  million	
  reads	
   RNASeq	
  2,	
  10	
  million	
  reads	
  
Number	
  of	
  reads	
  needed	
  for	
  an	
  
experiment	
  	
  
•  Different	
  RNA	
  sequencing	
  require	
  different	
  number	
  of	
  reads	
  
•  More	
  genes	
  are	
  detected	
  with	
  higher	
  sequencing	
  depth	
  
•  However,	
  the	
  increase	
  of	
  detected	
  genes	
  reduces	
  substanIally	
  
•  Understand	
  your	
  sequencing	
  system	
  before	
  deciding	
  on	
  depth	
  
•  Can	
  always	
  increase	
  depth	
  by	
  addiIonal	
  sequencing	
  on	
  the	
  same	
  
library	
  
–  Unlike	
  microarray	
  there	
  is	
  very	
  limited	
  batch	
  effect	
  for	
  RNASeq	
  
Differen0al	
  expression	
  in	
  RNA-­‐seq:	
  A	
  ma@er	
  
of	
  depth.	
  Genome	
  Res.	
  2011.	
  	
  
Experimental	
  Design	
  
•  Technical	
  replicates	
  
–  Not	
  needed:	
  	
  RNASeq	
  have	
  low	
  technical	
  variaIon	
  
•  Minimize	
  batch	
  effects	
  
•  Biological	
  replicates	
  
–  Not	
  needed	
  for	
  novel	
  transcript	
  idenIficaIon	
  and	
  
transcriptome	
  assembly	
  
–  EssenIal	
  for	
  differenIal	
  expression	
  analysis	
  
–  Difficult	
  to	
  esImate	
  the	
  minimum	
  number	
  
•  3+	
  for	
  cell	
  lines	
  
•  5+	
  for	
  inbred	
  lines	
  (i.e.	
  mouse,	
  model	
  organsims)	
  
•  20+	
  for	
  human	
  samples	
  	
  (usually	
  unachievable)	
  
–  Must	
  have	
  3+	
  to	
  perform	
  staIsIcal	
  analysis	
  
Experimental	
  Design	
  
•  Pooling	
  samples	
  
– Limited	
  RNA	
  obtainable	
  
•  Tumor	
  samples	
  from	
  hard	
  to	
  reach	
  Issue	
  type	
  (i.e.	
  
brain)	
  
– Novel	
  transcriptome	
  assembly	
  
– Don’t	
  do	
  it	
  unless	
  you	
  know	
  what	
  you	
  are	
  doing	
  
QuesSons	
  to	
  ask	
  when	
  gekng	
  raw	
  
RNASeq	
  data	
  back	
  
•  How	
  was	
  the	
  RNA	
  extracted?	
  
•  How	
  was	
  RNASeq	
  library	
  constructed?	
  
•  Which	
  playorm	
  was	
  the	
  library	
  sequenced	
  on?	
  
•  How	
  long	
  was	
  the	
  read	
  length?	
  
•  Was	
  sequencing	
  done	
  with	
  single	
  read	
  or	
  
paired	
  end?	
  
•  How	
  many	
  reads	
  were	
  sequenced	
  per	
  sample?	
  
•  Where	
  is	
  the	
  QC	
  report?	
  
Check	
  list	
  for	
  gekng	
  RNASeq	
  DE	
  analysis	
  
results	
  back	
  
q 	
  Fastq	
  files	
  
q 	
  FastQC	
  Report	
  
q 	
  BAM	
  files	
  
q 	
  RNASeq	
  QC	
  Report	
  (Not	
  discussed)	
  
q Table	
  of	
  DifferenIally	
  Expressed	
  Genes/	
  
Transcripts	
  
q 	
  Heatmaps	
  
q 	
  FuncIonal	
  Enrichment	
  Analysis	
  Table	
  
Recognize	
  Yourself	
  as	
  a	
  Genomic	
  Data	
  
Consumer	
  
BioinformaScists/Data	
  ScienSsts	
  
-­‐  Let	
  data	
  drive	
  scienIfic	
  
hypothesis	
  generaIon	
  
-­‐  Start	
  with	
  raw	
  data	
  (i.e.	
  fastq)	
  
-­‐  Process	
  raw	
  data	
  by	
  privately	
  
tuned	
  pipelines	


KNOW	
  YOUR	
  DATA	
  SOURCE	


TranslaSonal	
  ScienSsts	
  
-­‐  Start	
  with	
  a	
  specific	
  hypothesis	
  
derived	
  from	
  observaIon	
  
-­‐  Find	
  processed	
  to	
  perform	
  
secondary	
  analysis	
  
-­‐  Use	
  readily	
  available	
  tools	
  
-­‐  Interpret	
  results	
  in	
  the	
  context	
  
of	
  iniIal	
  hypothesis	
  
KNOW	
  YOUR	
  TOOLS	
  
THE	
  END	
  

More Related Content

What's hot

CRISPR Screening: the What, Why and How
CRISPR Screening: the What, Why and HowCRISPR Screening: the What, Why and How
CRISPR Screening: the What, Why and HowHorizonDiscovery
 
Next generation sequencing
Next generation sequencingNext generation sequencing
Next generation sequencingDayananda Salam
 
De novo genome assembly - T.Seemann - IMB winter school 2016 - brisbane, au ...
De novo genome assembly  - T.Seemann - IMB winter school 2016 - brisbane, au ...De novo genome assembly  - T.Seemann - IMB winter school 2016 - brisbane, au ...
De novo genome assembly - T.Seemann - IMB winter school 2016 - brisbane, au ...Torsten Seemann
 
Next generation sequencing methods (final edit)
Next generation sequencing methods (final edit)Next generation sequencing methods (final edit)
Next generation sequencing methods (final edit)Mrinal Vashisth
 
Genotyping by Sequencing
Genotyping by SequencingGenotyping by Sequencing
Genotyping by SequencingSenthil Natesan
 
Transcriptomics: A Tool for Plant Disease Management
Transcriptomics: A Tool for Plant Disease ManagementTranscriptomics: A Tool for Plant Disease Management
Transcriptomics: A Tool for Plant Disease ManagementSHIVANI PATHAK
 
Introduction to Next-Generation Sequencing (NGS) Technology
Introduction to Next-Generation Sequencing (NGS) TechnologyIntroduction to Next-Generation Sequencing (NGS) Technology
Introduction to Next-Generation Sequencing (NGS) TechnologyQIAGEN
 
Single cell RNA sequencing; Methods and applications
Single cell RNA sequencing; Methods and applicationsSingle cell RNA sequencing; Methods and applications
Single cell RNA sequencing; Methods and applicationsfaraharooj
 
RNA sequencing: advances and opportunities
RNA sequencing: advances and opportunities RNA sequencing: advances and opportunities
RNA sequencing: advances and opportunities Paolo Dametto
 
NGS data formats and analyses
NGS data formats and analysesNGS data formats and analyses
NGS data formats and analysesrjorton
 
2016. daisuke tsugama. next generation sequencing (ngs) for plant research
2016. daisuke tsugama. next generation sequencing (ngs) for plant research2016. daisuke tsugama. next generation sequencing (ngs) for plant research
2016. daisuke tsugama. next generation sequencing (ngs) for plant researchFOODCROPS
 
Overview of Genome Assembly Algorithms
Overview of Genome Assembly AlgorithmsOverview of Genome Assembly Algorithms
Overview of Genome Assembly AlgorithmsNtino Krampis
 

What's hot (20)

CRISPR Screening: the What, Why and How
CRISPR Screening: the What, Why and HowCRISPR Screening: the What, Why and How
CRISPR Screening: the What, Why and How
 
Genome Assembly 2018
Genome Assembly 2018Genome Assembly 2018
Genome Assembly 2018
 
Next generation sequencing
Next generation sequencingNext generation sequencing
Next generation sequencing
 
De novo genome assembly - T.Seemann - IMB winter school 2016 - brisbane, au ...
De novo genome assembly  - T.Seemann - IMB winter school 2016 - brisbane, au ...De novo genome assembly  - T.Seemann - IMB winter school 2016 - brisbane, au ...
De novo genome assembly - T.Seemann - IMB winter school 2016 - brisbane, au ...
 
RNA-seq Analysis
RNA-seq AnalysisRNA-seq Analysis
RNA-seq Analysis
 
Next generation sequencing methods (final edit)
Next generation sequencing methods (final edit)Next generation sequencing methods (final edit)
Next generation sequencing methods (final edit)
 
Genotyping by Sequencing
Genotyping by SequencingGenotyping by Sequencing
Genotyping by Sequencing
 
Transcriptomics: A Tool for Plant Disease Management
Transcriptomics: A Tool for Plant Disease ManagementTranscriptomics: A Tool for Plant Disease Management
Transcriptomics: A Tool for Plant Disease Management
 
Introduction to Next-Generation Sequencing (NGS) Technology
Introduction to Next-Generation Sequencing (NGS) TechnologyIntroduction to Next-Generation Sequencing (NGS) Technology
Introduction to Next-Generation Sequencing (NGS) Technology
 
Single cell RNA sequencing; Methods and applications
Single cell RNA sequencing; Methods and applicationsSingle cell RNA sequencing; Methods and applications
Single cell RNA sequencing; Methods and applications
 
PHYLOGENETICS WITH MEGA
PHYLOGENETICS WITH MEGAPHYLOGENETICS WITH MEGA
PHYLOGENETICS WITH MEGA
 
Genome editing
Genome editingGenome editing
Genome editing
 
RNAseq Analysis
RNAseq AnalysisRNAseq Analysis
RNAseq Analysis
 
RNA sequencing: advances and opportunities
RNA sequencing: advances and opportunities RNA sequencing: advances and opportunities
RNA sequencing: advances and opportunities
 
NEXT GENERATION SEQUENCING
NEXT GENERATION SEQUENCINGNEXT GENERATION SEQUENCING
NEXT GENERATION SEQUENCING
 
Introduction to bioinformatics
Introduction to bioinformaticsIntroduction to bioinformatics
Introduction to bioinformatics
 
Genome assembly
Genome assemblyGenome assembly
Genome assembly
 
NGS data formats and analyses
NGS data formats and analysesNGS data formats and analyses
NGS data formats and analyses
 
2016. daisuke tsugama. next generation sequencing (ngs) for plant research
2016. daisuke tsugama. next generation sequencing (ngs) for plant research2016. daisuke tsugama. next generation sequencing (ngs) for plant research
2016. daisuke tsugama. next generation sequencing (ngs) for plant research
 
Overview of Genome Assembly Algorithms
Overview of Genome Assembly AlgorithmsOverview of Genome Assembly Algorithms
Overview of Genome Assembly Algorithms
 

Viewers also liked

Comparison between RNASeq and Microarray for Gene Expression Analysis
Comparison between RNASeq and Microarray for Gene Expression AnalysisComparison between RNASeq and Microarray for Gene Expression Analysis
Comparison between RNASeq and Microarray for Gene Expression AnalysisYaoyu Wang
 
Rnaseq basics ngs_application1
Rnaseq basics ngs_application1Rnaseq basics ngs_application1
Rnaseq basics ngs_application1Yaoyu Wang
 
Introduction to RNA-seq and RNA-seq Data Analysis (UEB-UAT Bioinformatics Cou...
Introduction to RNA-seq and RNA-seq Data Analysis (UEB-UAT Bioinformatics Cou...Introduction to RNA-seq and RNA-seq Data Analysis (UEB-UAT Bioinformatics Cou...
Introduction to RNA-seq and RNA-seq Data Analysis (UEB-UAT Bioinformatics Cou...VHIR Vall d’Hebron Institut de Recerca
 
Catalyzing Plant Science Research with RNA-seq
Catalyzing Plant Science Research with RNA-seqCatalyzing Plant Science Research with RNA-seq
Catalyzing Plant Science Research with RNA-seqManjappa Ganiger
 
Transcript detection in RNAseq
Transcript detection in RNAseqTranscript detection in RNAseq
Transcript detection in RNAseqDenis C. Bauer
 
New insights into the human genome by encode 14.12.12
New insights into the human genome by encode 14.12.12New insights into the human genome by encode 14.12.12
New insights into the human genome by encode 14.12.12Ranjani Reddy
 
Analysis of Single-Cell Sequencing Data by CLC/Ingenuity: Single Cell Analysi...
Analysis of Single-Cell Sequencing Data by CLC/Ingenuity: Single Cell Analysi...Analysis of Single-Cell Sequencing Data by CLC/Ingenuity: Single Cell Analysi...
Analysis of Single-Cell Sequencing Data by CLC/Ingenuity: Single Cell Analysi...QIAGEN
 
Introduction to Galaxy and RNA-Seq
Introduction to Galaxy and RNA-SeqIntroduction to Galaxy and RNA-Seq
Introduction to Galaxy and RNA-SeqEnis Afgan
 
New insights into the human genome by ENCODE project
New insights into the human genome by ENCODE project New insights into the human genome by ENCODE project
New insights into the human genome by ENCODE project Senthil Natesan
 
Sequencing: The Next Generation 2015
Sequencing: The Next Generation 2015Sequencing: The Next Generation 2015
Sequencing: The Next Generation 2015Surya Saha
 
Part 1 of RNA-seq for DE analysis: Defining the goal
Part 1 of RNA-seq for DE analysis: Defining the goalPart 1 of RNA-seq for DE analysis: Defining the goal
Part 1 of RNA-seq for DE analysis: Defining the goalJoachim Jacob
 
RNA Sequencing from Single Cell
RNA Sequencing from Single CellRNA Sequencing from Single Cell
RNA Sequencing from Single CellQIAGEN
 
RNA-seq: Mapping and quality control - part 3
RNA-seq: Mapping and quality control - part 3RNA-seq: Mapping and quality control - part 3
RNA-seq: Mapping and quality control - part 3BITS
 
Introduction to NGS
Introduction to NGSIntroduction to NGS
Introduction to NGScursoNGS
 

Viewers also liked (20)

Comparison between RNASeq and Microarray for Gene Expression Analysis
Comparison between RNASeq and Microarray for Gene Expression AnalysisComparison between RNASeq and Microarray for Gene Expression Analysis
Comparison between RNASeq and Microarray for Gene Expression Analysis
 
Rnaseq basics ngs_application1
Rnaseq basics ngs_application1Rnaseq basics ngs_application1
Rnaseq basics ngs_application1
 
Introduction to RNA-seq and RNA-seq Data Analysis (UEB-UAT Bioinformatics Cou...
Introduction to RNA-seq and RNA-seq Data Analysis (UEB-UAT Bioinformatics Cou...Introduction to RNA-seq and RNA-seq Data Analysis (UEB-UAT Bioinformatics Cou...
Introduction to RNA-seq and RNA-seq Data Analysis (UEB-UAT Bioinformatics Cou...
 
Catalyzing Plant Science Research with RNA-seq
Catalyzing Plant Science Research with RNA-seqCatalyzing Plant Science Research with RNA-seq
Catalyzing Plant Science Research with RNA-seq
 
Rna seq
Rna seq Rna seq
Rna seq
 
Transcript detection in RNAseq
Transcript detection in RNAseqTranscript detection in RNAseq
Transcript detection in RNAseq
 
New insights into the human genome by encode 14.12.12
New insights into the human genome by encode 14.12.12New insights into the human genome by encode 14.12.12
New insights into the human genome by encode 14.12.12
 
sequencing-methods-review
sequencing-methods-reviewsequencing-methods-review
sequencing-methods-review
 
Analysis of Single-Cell Sequencing Data by CLC/Ingenuity: Single Cell Analysi...
Analysis of Single-Cell Sequencing Data by CLC/Ingenuity: Single Cell Analysi...Analysis of Single-Cell Sequencing Data by CLC/Ingenuity: Single Cell Analysi...
Analysis of Single-Cell Sequencing Data by CLC/Ingenuity: Single Cell Analysi...
 
ChIP-seq
ChIP-seqChIP-seq
ChIP-seq
 
Introduction to Galaxy and RNA-Seq
Introduction to Galaxy and RNA-SeqIntroduction to Galaxy and RNA-Seq
Introduction to Galaxy and RNA-Seq
 
New insights into the human genome by ENCODE project
New insights into the human genome by ENCODE project New insights into the human genome by ENCODE project
New insights into the human genome by ENCODE project
 
ChipSeq Data Analysis
ChipSeq Data AnalysisChipSeq Data Analysis
ChipSeq Data Analysis
 
Sequencing: The Next Generation 2015
Sequencing: The Next Generation 2015Sequencing: The Next Generation 2015
Sequencing: The Next Generation 2015
 
Part 1 of RNA-seq for DE analysis: Defining the goal
Part 1 of RNA-seq for DE analysis: Defining the goalPart 1 of RNA-seq for DE analysis: Defining the goal
Part 1 of RNA-seq for DE analysis: Defining the goal
 
RNA Sequencing from Single Cell
RNA Sequencing from Single CellRNA Sequencing from Single Cell
RNA Sequencing from Single Cell
 
RNA-seq: Mapping and quality control - part 3
RNA-seq: Mapping and quality control - part 3RNA-seq: Mapping and quality control - part 3
RNA-seq: Mapping and quality control - part 3
 
Illumina Sequencing
Illumina SequencingIllumina Sequencing
Illumina Sequencing
 
Application of Genome-Wide Association Study (GWAS) and transcriptomics to st...
Application of Genome-Wide Association Study (GWAS) and transcriptomics to st...Application of Genome-Wide Association Study (GWAS) and transcriptomics to st...
Application of Genome-Wide Association Study (GWAS) and transcriptomics to st...
 
Introduction to NGS
Introduction to NGSIntroduction to NGS
Introduction to NGS
 

Similar to RNA-Seq Analysis: An Introduction to Mapping, Quantification, and Differential Expression

RNA-Seq_Presentation
RNA-Seq_PresentationRNA-Seq_Presentation
RNA-Seq_PresentationToyin23
 
Knowing Your NGS Upstream: Alignment and Variants
Knowing Your NGS Upstream: Alignment and VariantsKnowing Your NGS Upstream: Alignment and Variants
Knowing Your NGS Upstream: Alignment and VariantsGolden Helix Inc
 
Assembly and gene_prediction
Assembly and gene_predictionAssembly and gene_prediction
Assembly and gene_predictionBas van Breukelen
 
RNA-seq quality control and pre-processing
RNA-seq quality control and pre-processingRNA-seq quality control and pre-processing
RNA-seq quality control and pre-processingmikaelhuss
 
Apollo Introduction for the Chestnut Research Community
Apollo Introduction for the Chestnut Research CommunityApollo Introduction for the Chestnut Research Community
Apollo Introduction for the Chestnut Research CommunityMonica Munoz-Torres
 
Eccmid meet the-expert
Eccmid meet the-expertEccmid meet the-expert
Eccmid meet the-expertNick Loman
 
20100516 bioinformatics kapushesky_lecture08
20100516 bioinformatics kapushesky_lecture0820100516 bioinformatics kapushesky_lecture08
20100516 bioinformatics kapushesky_lecture08Computer Science Club
 
Bioinformatics t8-go-hmm wim-vancriekinge_v2013
Bioinformatics t8-go-hmm wim-vancriekinge_v2013Bioinformatics t8-go-hmm wim-vancriekinge_v2013
Bioinformatics t8-go-hmm wim-vancriekinge_v2013Prof. Wim Van Criekinge
 
Apollo : A workshop for the Manakin Research Coordination Network
Apollo: A workshop for the Manakin Research Coordination NetworkApollo: A workshop for the Manakin Research Coordination Network
Apollo : A workshop for the Manakin Research Coordination NetworkMonica Munoz-Torres
 
Bioinformaatics for M.Sc. Biotecchnology.pptx
Bioinformaatics for M.Sc. Biotecchnology.pptxBioinformaatics for M.Sc. Biotecchnology.pptx
Bioinformaatics for M.Sc. Biotecchnology.pptxRanjan Jyoti Sarma
 
Dgaston dec-06-2012
Dgaston dec-06-2012Dgaston dec-06-2012
Dgaston dec-06-2012Dan Gaston
 
RNA-seq: general concept, goal and experimental design - part 1
RNA-seq: general concept, goal and experimental design - part 1RNA-seq: general concept, goal and experimental design - part 1
RNA-seq: general concept, goal and experimental design - part 1BITS
 
Exploring DNA/RNA-Seq Analysis Results with Golden Helix GenomeBrowse and SVS
Exploring DNA/RNA-Seq Analysis Results with Golden Helix GenomeBrowse and SVSExploring DNA/RNA-Seq Analysis Results with Golden Helix GenomeBrowse and SVS
Exploring DNA/RNA-Seq Analysis Results with Golden Helix GenomeBrowse and SVSGolden Helix Inc
 
Processing Raw scRNA-Seq Sequencing Data
Processing Raw scRNA-Seq Sequencing DataProcessing Raw scRNA-Seq Sequencing Data
Processing Raw scRNA-Seq Sequencing DataAlireza Doustmohammadi
 

Similar to RNA-Seq Analysis: An Introduction to Mapping, Quantification, and Differential Expression (20)

RNA-Seq_Presentation
RNA-Seq_PresentationRNA-Seq_Presentation
RNA-Seq_Presentation
 
EiB Seminar from Antoni Miñarro, Ph.D
EiB Seminar from Antoni Miñarro, Ph.DEiB Seminar from Antoni Miñarro, Ph.D
EiB Seminar from Antoni Miñarro, Ph.D
 
EiB Seminar from Antoni Miñarro, Ph.D
EiB Seminar from Antoni Miñarro, Ph.DEiB Seminar from Antoni Miñarro, Ph.D
EiB Seminar from Antoni Miñarro, Ph.D
 
Knowing Your NGS Upstream: Alignment and Variants
Knowing Your NGS Upstream: Alignment and VariantsKnowing Your NGS Upstream: Alignment and Variants
Knowing Your NGS Upstream: Alignment and Variants
 
Assembly and gene_prediction
Assembly and gene_predictionAssembly and gene_prediction
Assembly and gene_prediction
 
RNA-seq quality control and pre-processing
RNA-seq quality control and pre-processingRNA-seq quality control and pre-processing
RNA-seq quality control and pre-processing
 
20140711 4 e_tseng_ercc2.0_workshop
20140711 4 e_tseng_ercc2.0_workshop20140711 4 e_tseng_ercc2.0_workshop
20140711 4 e_tseng_ercc2.0_workshop
 
Apollo Introduction for the Chestnut Research Community
Apollo Introduction for the Chestnut Research CommunityApollo Introduction for the Chestnut Research Community
Apollo Introduction for the Chestnut Research Community
 
Eccmid meet the-expert
Eccmid meet the-expertEccmid meet the-expert
Eccmid meet the-expert
 
Bioinformatics t8-go-hmm v2014
Bioinformatics t8-go-hmm v2014Bioinformatics t8-go-hmm v2014
Bioinformatics t8-go-hmm v2014
 
20100516 bioinformatics kapushesky_lecture08
20100516 bioinformatics kapushesky_lecture0820100516 bioinformatics kapushesky_lecture08
20100516 bioinformatics kapushesky_lecture08
 
Iplant pag
Iplant pagIplant pag
Iplant pag
 
Bioinformatica t4-alignments
Bioinformatica t4-alignmentsBioinformatica t4-alignments
Bioinformatica t4-alignments
 
Bioinformatics t8-go-hmm wim-vancriekinge_v2013
Bioinformatics t8-go-hmm wim-vancriekinge_v2013Bioinformatics t8-go-hmm wim-vancriekinge_v2013
Bioinformatics t8-go-hmm wim-vancriekinge_v2013
 
Apollo : A workshop for the Manakin Research Coordination Network
Apollo: A workshop for the Manakin Research Coordination NetworkApollo: A workshop for the Manakin Research Coordination Network
Apollo : A workshop for the Manakin Research Coordination Network
 
Bioinformaatics for M.Sc. Biotecchnology.pptx
Bioinformaatics for M.Sc. Biotecchnology.pptxBioinformaatics for M.Sc. Biotecchnology.pptx
Bioinformaatics for M.Sc. Biotecchnology.pptx
 
Dgaston dec-06-2012
Dgaston dec-06-2012Dgaston dec-06-2012
Dgaston dec-06-2012
 
RNA-seq: general concept, goal and experimental design - part 1
RNA-seq: general concept, goal and experimental design - part 1RNA-seq: general concept, goal and experimental design - part 1
RNA-seq: general concept, goal and experimental design - part 1
 
Exploring DNA/RNA-Seq Analysis Results with Golden Helix GenomeBrowse and SVS
Exploring DNA/RNA-Seq Analysis Results with Golden Helix GenomeBrowse and SVSExploring DNA/RNA-Seq Analysis Results with Golden Helix GenomeBrowse and SVS
Exploring DNA/RNA-Seq Analysis Results with Golden Helix GenomeBrowse and SVS
 
Processing Raw scRNA-Seq Sequencing Data
Processing Raw scRNA-Seq Sequencing DataProcessing Raw scRNA-Seq Sequencing Data
Processing Raw scRNA-Seq Sequencing Data
 

Recently uploaded

Install Stable Diffusion in windows machine
Install Stable Diffusion in windows machineInstall Stable Diffusion in windows machine
Install Stable Diffusion in windows machinePadma Pradeep
 
AI as an Interface for Commercial Buildings
AI as an Interface for Commercial BuildingsAI as an Interface for Commercial Buildings
AI as an Interface for Commercial BuildingsMemoori
 
CloudStudio User manual (basic edition):
CloudStudio User manual (basic edition):CloudStudio User manual (basic edition):
CloudStudio User manual (basic edition):comworks
 
Neo4j - How KGs are shaping the future of Generative AI at AWS Summit London ...
Neo4j - How KGs are shaping the future of Generative AI at AWS Summit London ...Neo4j - How KGs are shaping the future of Generative AI at AWS Summit London ...
Neo4j - How KGs are shaping the future of Generative AI at AWS Summit London ...Neo4j
 
Enhancing Worker Digital Experience: A Hands-on Workshop for Partners
Enhancing Worker Digital Experience: A Hands-on Workshop for PartnersEnhancing Worker Digital Experience: A Hands-on Workshop for Partners
Enhancing Worker Digital Experience: A Hands-on Workshop for PartnersThousandEyes
 
Injustice - Developers Among Us (SciFiDevCon 2024)
Injustice - Developers Among Us (SciFiDevCon 2024)Injustice - Developers Among Us (SciFiDevCon 2024)
Injustice - Developers Among Us (SciFiDevCon 2024)Allon Mureinik
 
Benefits Of Flutter Compared To Other Frameworks
Benefits Of Flutter Compared To Other FrameworksBenefits Of Flutter Compared To Other Frameworks
Benefits Of Flutter Compared To Other FrameworksSoftradix Technologies
 
How to Remove Document Management Hurdles with X-Docs?
How to Remove Document Management Hurdles with X-Docs?How to Remove Document Management Hurdles with X-Docs?
How to Remove Document Management Hurdles with X-Docs?XfilesPro
 
08448380779 Call Girls In Friends Colony Women Seeking Men
08448380779 Call Girls In Friends Colony Women Seeking Men08448380779 Call Girls In Friends Colony Women Seeking Men
08448380779 Call Girls In Friends Colony Women Seeking MenDelhi Call girls
 
Unblocking The Main Thread Solving ANRs and Frozen Frames
Unblocking The Main Thread Solving ANRs and Frozen FramesUnblocking The Main Thread Solving ANRs and Frozen Frames
Unblocking The Main Thread Solving ANRs and Frozen FramesSinan KOZAK
 
Breaking the Kubernetes Kill Chain: Host Path Mount
Breaking the Kubernetes Kill Chain: Host Path MountBreaking the Kubernetes Kill Chain: Host Path Mount
Breaking the Kubernetes Kill Chain: Host Path MountPuma Security, LLC
 
Next-generation AAM aircraft unveiled by Supernal, S-A2
Next-generation AAM aircraft unveiled by Supernal, S-A2Next-generation AAM aircraft unveiled by Supernal, S-A2
Next-generation AAM aircraft unveiled by Supernal, S-A2Hyundai Motor Group
 
SIEMENS: RAPUNZEL – A Tale About Knowledge Graph
SIEMENS: RAPUNZEL – A Tale About Knowledge GraphSIEMENS: RAPUNZEL – A Tale About Knowledge Graph
SIEMENS: RAPUNZEL – A Tale About Knowledge GraphNeo4j
 
Pigging Solutions in Pet Food Manufacturing
Pigging Solutions in Pet Food ManufacturingPigging Solutions in Pet Food Manufacturing
Pigging Solutions in Pet Food ManufacturingPigging Solutions
 
Transcript: #StandardsGoals for 2024: What’s new for BISAC - Tech Forum 2024
Transcript: #StandardsGoals for 2024: What’s new for BISAC - Tech Forum 2024Transcript: #StandardsGoals for 2024: What’s new for BISAC - Tech Forum 2024
Transcript: #StandardsGoals for 2024: What’s new for BISAC - Tech Forum 2024BookNet Canada
 
My Hashitalk Indonesia April 2024 Presentation
My Hashitalk Indonesia April 2024 PresentationMy Hashitalk Indonesia April 2024 Presentation
My Hashitalk Indonesia April 2024 PresentationRidwan Fadjar
 
Tech-Forward - Achieving Business Readiness For Copilot in Microsoft 365
Tech-Forward - Achieving Business Readiness For Copilot in Microsoft 365Tech-Forward - Achieving Business Readiness For Copilot in Microsoft 365
Tech-Forward - Achieving Business Readiness For Copilot in Microsoft 3652toLead Limited
 
Automating Business Process via MuleSoft Composer | Bangalore MuleSoft Meetup...
Automating Business Process via MuleSoft Composer | Bangalore MuleSoft Meetup...Automating Business Process via MuleSoft Composer | Bangalore MuleSoft Meetup...
Automating Business Process via MuleSoft Composer | Bangalore MuleSoft Meetup...shyamraj55
 
Presentation on how to chat with PDF using ChatGPT code interpreter
Presentation on how to chat with PDF using ChatGPT code interpreterPresentation on how to chat with PDF using ChatGPT code interpreter
Presentation on how to chat with PDF using ChatGPT code interpreternaman860154
 
SQL Database Design For Developers at php[tek] 2024
SQL Database Design For Developers at php[tek] 2024SQL Database Design For Developers at php[tek] 2024
SQL Database Design For Developers at php[tek] 2024Scott Keck-Warren
 

Recently uploaded (20)

Install Stable Diffusion in windows machine
Install Stable Diffusion in windows machineInstall Stable Diffusion in windows machine
Install Stable Diffusion in windows machine
 
AI as an Interface for Commercial Buildings
AI as an Interface for Commercial BuildingsAI as an Interface for Commercial Buildings
AI as an Interface for Commercial Buildings
 
CloudStudio User manual (basic edition):
CloudStudio User manual (basic edition):CloudStudio User manual (basic edition):
CloudStudio User manual (basic edition):
 
Neo4j - How KGs are shaping the future of Generative AI at AWS Summit London ...
Neo4j - How KGs are shaping the future of Generative AI at AWS Summit London ...Neo4j - How KGs are shaping the future of Generative AI at AWS Summit London ...
Neo4j - How KGs are shaping the future of Generative AI at AWS Summit London ...
 
Enhancing Worker Digital Experience: A Hands-on Workshop for Partners
Enhancing Worker Digital Experience: A Hands-on Workshop for PartnersEnhancing Worker Digital Experience: A Hands-on Workshop for Partners
Enhancing Worker Digital Experience: A Hands-on Workshop for Partners
 
Injustice - Developers Among Us (SciFiDevCon 2024)
Injustice - Developers Among Us (SciFiDevCon 2024)Injustice - Developers Among Us (SciFiDevCon 2024)
Injustice - Developers Among Us (SciFiDevCon 2024)
 
Benefits Of Flutter Compared To Other Frameworks
Benefits Of Flutter Compared To Other FrameworksBenefits Of Flutter Compared To Other Frameworks
Benefits Of Flutter Compared To Other Frameworks
 
How to Remove Document Management Hurdles with X-Docs?
How to Remove Document Management Hurdles with X-Docs?How to Remove Document Management Hurdles with X-Docs?
How to Remove Document Management Hurdles with X-Docs?
 
08448380779 Call Girls In Friends Colony Women Seeking Men
08448380779 Call Girls In Friends Colony Women Seeking Men08448380779 Call Girls In Friends Colony Women Seeking Men
08448380779 Call Girls In Friends Colony Women Seeking Men
 
Unblocking The Main Thread Solving ANRs and Frozen Frames
Unblocking The Main Thread Solving ANRs and Frozen FramesUnblocking The Main Thread Solving ANRs and Frozen Frames
Unblocking The Main Thread Solving ANRs and Frozen Frames
 
Breaking the Kubernetes Kill Chain: Host Path Mount
Breaking the Kubernetes Kill Chain: Host Path MountBreaking the Kubernetes Kill Chain: Host Path Mount
Breaking the Kubernetes Kill Chain: Host Path Mount
 
Next-generation AAM aircraft unveiled by Supernal, S-A2
Next-generation AAM aircraft unveiled by Supernal, S-A2Next-generation AAM aircraft unveiled by Supernal, S-A2
Next-generation AAM aircraft unveiled by Supernal, S-A2
 
SIEMENS: RAPUNZEL – A Tale About Knowledge Graph
SIEMENS: RAPUNZEL – A Tale About Knowledge GraphSIEMENS: RAPUNZEL – A Tale About Knowledge Graph
SIEMENS: RAPUNZEL – A Tale About Knowledge Graph
 
Pigging Solutions in Pet Food Manufacturing
Pigging Solutions in Pet Food ManufacturingPigging Solutions in Pet Food Manufacturing
Pigging Solutions in Pet Food Manufacturing
 
Transcript: #StandardsGoals for 2024: What’s new for BISAC - Tech Forum 2024
Transcript: #StandardsGoals for 2024: What’s new for BISAC - Tech Forum 2024Transcript: #StandardsGoals for 2024: What’s new for BISAC - Tech Forum 2024
Transcript: #StandardsGoals for 2024: What’s new for BISAC - Tech Forum 2024
 
My Hashitalk Indonesia April 2024 Presentation
My Hashitalk Indonesia April 2024 PresentationMy Hashitalk Indonesia April 2024 Presentation
My Hashitalk Indonesia April 2024 Presentation
 
Tech-Forward - Achieving Business Readiness For Copilot in Microsoft 365
Tech-Forward - Achieving Business Readiness For Copilot in Microsoft 365Tech-Forward - Achieving Business Readiness For Copilot in Microsoft 365
Tech-Forward - Achieving Business Readiness For Copilot in Microsoft 365
 
Automating Business Process via MuleSoft Composer | Bangalore MuleSoft Meetup...
Automating Business Process via MuleSoft Composer | Bangalore MuleSoft Meetup...Automating Business Process via MuleSoft Composer | Bangalore MuleSoft Meetup...
Automating Business Process via MuleSoft Composer | Bangalore MuleSoft Meetup...
 
Presentation on how to chat with PDF using ChatGPT code interpreter
Presentation on how to chat with PDF using ChatGPT code interpreterPresentation on how to chat with PDF using ChatGPT code interpreter
Presentation on how to chat with PDF using ChatGPT code interpreter
 
SQL Database Design For Developers at php[tek] 2024
SQL Database Design For Developers at php[tek] 2024SQL Database Design For Developers at php[tek] 2024
SQL Database Design For Developers at php[tek] 2024
 

RNA-Seq Analysis: An Introduction to Mapping, Quantification, and Differential Expression

  • 1. NGS  APPLICATIONS  2:     INTRODUCTION  TO  RNASEQ  ANALYSIS  
  • 2. Overview   •  Earlier:  libraries  to  raw  reads.   Now   •  What  to  do  with  RNA-­‐seq  reads?   •  How  to  design  a  RNA-­‐Seq   experiment?  
  • 3. Blencowe B J et al. Genes Dev. 2009;23:1379-1386 Illumina  HiSeq  
  • 4. Reads  are  ready.    Now  What?   bcl2fastq   Big  Fastq  files  (2-­‐30Gb)   •  Reads  represent  real  biology.       •  More  reads  corresponding  to  a  transcript  indicate  higher  abundance  of  that   transcript.   •  Reads  may  represent  novel  transcripts  or  novel  arrangements  of  exons  that  are   not  present  in  any  known  reference  genome.   •  New  exon-­‐exon  juncIons,  RNA-­‐ediIng,  and  nucleoIde  variaIons  (SNPs)  may  all   be  present  in  the  read  data.   How  do  we  translate  these  raw  reads  into  biological  knowledge:    start  with   sequence  alignment.  
  • 5. Reads  are  ready.    Now  What?   Fastq   Do  we  have  a   genome  reference?   Yes   Do  we  a  transcript/gene   annotaIon  reference?   Yes  No   No   Perform  full  de  novo   transcriptome  construcIon   Perform  alignment-­‐guided  de  novo   transcriptome  assembly   Align  to  the  genome.   QuanIficaIon  Only:  accept   only  alignments  that   correspond  to  known   transcripts   Align  to  known   exons  but  accept   alternaIve   arrangements.   Align  to  known   exons  plus  other   regions.   Like  microarray  
  • 6. What  to  map  to?   Map  to  a  genome  with  no  gene  annotaSon.   •  Assembling  transcripts  from  exon  regions  is  difficult  and  requires   complex  staIsIcal  algorithms.   •  IdenIfying  alternaIve  transcript  isoforms  is  unreliable.   •  Usually  this  is  best  for  a  novel  or  unannotated  genomes.       Exons  ?   Genome  ref  
  • 7. What  to  map  to?   Map  to  the  genome,  with  knowledge  of  transcript  annotaSons   • Well  annotated  genome  reference  is  required.   • To  effecively  map  to  exon  juncIons,  you  need  a  mapping   algorithm  that  can  divide  the  sequencing  reads  and  map  porIons   independently.   • IdenIfying  alternaIve  transcript  isoforms  involves  complex   algorithms.  
  • 8. Which  sequence  mappers  to  use?   •  RNASeq  Alignment  algorithm  must  be   –  Fast   –  Able  to  handle  SNPs,  indels,  and  sequencing  errors   –  Maintain  accurate  quanIficaIon       –  Allow  for  introns  for  reference  genome  alignment(spliced  alignment   detecIon)   •  Burrows  Wheeler  Transform(BWT)  mappers   –  Fast   –  Limited  mismatches  allowed  (<3)   –  Limited  indel  detecIon  ability   –  Examples:  BowIe2,  BWA,  Tophat     –  Use  cases:  large  and  conserved  genome  and  transcriptomes     •  Hash  Table  mappers   –  Require  large  amount  of  RAM  for  indexing   –  More  mismatches  allowed   –  Indel  detecIon   –  Examples:  GSNAP,  SHRiMP,  STAR   –  Use  case:  highly  variable  or  smaller  genomes,  transcriptomes    
  • 9. RNA-­‐Seq  reads   Alignment   Assemble   Transcripts   fastq  file   SAM/BAM  file   Transcript  isoforms   Gene  or  transcript   quanSficaSon   Count  reads   HTseq  -­‐     h_p://www-­‐huber.embl.de/users/ anders/HTSeq/doc/overview.html   Cufflinks  -­‐   h_p://cufflinks.cbcb.umd.edu/   Bioconductor  -­‐   h_p://www.bioconductor.org/   Trinity  -­‐   h_p://trinityrnaseq.sourceforge.net/   Cufflinks  -­‐   h_p://cufflinks.cbcb.umd.edu/   Generalized  Analysis  Workflow   BowIe2,  BWA,  Tophat,     GSNAP,  SHRiMP,  STAR    
  • 10. RNA-­‐Seq  reads   Align  to  the  genome  using   BowIe/Tophat.   Tophat   Cufflinks   Spliced  Fragments  align  to   known  exon-­‐exon  juncIons.   Genomic  mapped  reads  may   idenIfy  novel  isoforms.   fastq  file   SAM/BAM  file   Genome  reference  .fasta   Gene  annotaSons  .g^   Genome  reference  .fasta   Gene  annotaSons  .g^   Transcript  isoforms   Gene/transcript   quanSficaSon   Cufflinks  idenIfies  mutually   exclusive  exons.    Graph-­‐based   analysis  uses  a  shortest-­‐path   algorithm  to  determine     Tophat/Cufflinks   Workflow  
  • 11. Sequence  Alignment  Files   BAM/SAM  alignment  files   • SAM  file  is  the  standard  alignment  file  format  generated  from   all  mappers   • All  alignments  files  are  stored  in  a  BAM  file,  an  industry   standard.   • BAM  is  a  compressed  (binary)  version  of  the  SAM  file.    BAM  is   not  readable.    It  can  be  indexed  so  that  huge  alignment  files   can  be  read  and  searched  rapidly  by  other  tools  and  genome   browsers.   • A  suite  of  tools  (called  “samtools”)  is  used  to  convert  between   SAM  and  BAM.   • Samtools  can  also  be  used  to  index  bam  file  for  faster   visualizaIon,  on  IGV  or  UCSC  Genome  Browser    
  • 12. SAM  format   h_p://samtools.sourceforge.net/SAM1.pdf   Format  version   Ref  seq  name   Ref  seq  length   Sort  order   Cigar  String  
  • 13. h_p://samtools.sourceforge.net/SAM1.pdf   CIGAR  Strings   Compact  IdiosyncraIc  Gapped  Alignment  Report  
  • 14. DifferenSal  Gene  Expression  Analysis   •  Given  samples  from  different   experimental  condiIons,  find   changes  in  transcriptome   profiles   •  Allows  for  hypothesis   genera0on  on  molecular   abnormaliIes  and  mechanisms   that  may  contribute  to  the   tumor  phenotype   •  Provides  insights  to  potenIal   biological  mechanisms   associated  with  experimental/ diseased  condiIons    
  • 15. Sample annotations STAR aligner featureCounts   DESeq,  GSEA,  QC   HTML  report   Standard  Transcriptome  Sequencing  Pipeline  
  • 16. This  is  really  a  simple  sequence  counSng   problem   Data:    NGS  randomly  sample  and  sequence  all  gene   transcripts  from  samples  (so  the  number  of  reads   correlate  with  the  number  of  transcripts)     ObjecSve:    Does  gene  X  has  more  copies  in  condiIon  Z   than  in  B  (Z>B)?     X   Y   Z   X   Y   Z   CondiSon  Z   CondiSon  B  
  • 17. CounSng  Rules  for  RNASeq   •  Count  mapped  reads,  not  base-­‐pairs   •  Count  each  read  at  most  once   •  Discard  a  read  if   –  It  cannot  be  uniquely  mapped   –  Its  alignment  overlaps  with  several  genes   –  The  alignment  quality  score  is  bad   –  (for  paired-­‐end  reads)  the  mates  do  not  map  to  the   same  genes  (poten0al  fusion  genes)   •  Do  not  discard  if  there  is  read  duplicates  (same   reads  appear  mulIple  Imes)   •  Keep  track  of  alignment  method  and  parameters    
  • 18. What  kind  of  quesSons  can  be  answered   from  sequence  count  data?   Gene    Healthy1   Health  2   Health  3   PaSent  1   PaSent  2   PaSent  3   CCT2   50   60   45   75   5   69   TP53   30   72   30   127   40   80   CXCR5   3   10   60   20   5   40   Gene  Sequence  Count  Data   Is  gene  TP53  upregulated  in  paSent  samples?   -­‐  Hint:  If  healthy  samples  were  sequenced  at  20  million  reads  and   paIent  samples  were  sequenced  at  80  million  reads,  does  it   change  the  answer?     Is  there  more  TP53  transcript  copies  compare  to   CCT2?   -­‐  Hint:  TP53  transcript  is  a  lot  longer  than  CCT2  
  • 19. Direct  comparison  of  read  counts  per   gene  is  problemaSc     More  sequence  reads  mapped  to  a  transcript  if  it  is   a)  Long       b)  At  higher  depth  of  Coverage   Read  Counts  =  12,  Depth  =  3X,   Read  Counts  =  5,  Depth  =  3X   Read  Counts  =  11,  Depth  =  5X   Read  Counts  =  5,  Depth  =  3X   Cannot  claim  blue  transcript  is  transcribed  at  a  higher  level     than  green  transcript  based  on  read  counts  
  • 20. NormalizaSon  RNASeq  Count  Data     •  Data  NormalizaIon  is  ALWAYS  required  to   compare  one  sequencing  result  to  another   •  Bring  count  data  from  different  experiments  to   the  same  scale  for  comparison   •  RNASeq  count  data  normalizaIon  wants  to  adjust   data  such  that:   –  gene  with  different  lengths  can  be  compared   –  Total  sequence  counts  are  considered  
  • 21. RPKM:  Reads  per  Kilobase  per  Million   Mapped  Reads   C  =  #  of  mappable  reads  in  a  feature  (exon  or  transcript)   N  =  #  of  mappable  reads  in  the  experiment     L  =  length  of  the  feature  in  base  pairs   The  easiest  way  to  normalize  is  take  the  number  of  the  mapped   reads  on  a  transcript  and  divide  by  the  length  of  the  transcript   and  the  number  of  total  read     Nature  Methods  -­‐  5,  621  -­‐  628  (2008)     •  Generally  correct  for  biases   •  Vulnerable  to  bias  by  a  few  highly  expressed  genes  driving  N  to   be  large   •  Used  to  be  the  standard,  but  not  anymore  
  • 22. Other  NormalizaSon  Methods   Upper  QuarSle  Method   Aim:  Correct  for  the  bias  that  total  read  count  is  strongly  dependent   on  a  few  highly  expressed  transcripts   Method:  Use  the  top  25%  (upper  quarIle)most  expressed   transcripts  as  scaling  factor  and  report  back  Normalized  Count     Geometric  Mean  Method  (the  DESeq  method)   Aim:  to  minimize  the  effect  of  majority  of  sequences  and   concentrate  on  variaIon  between  condiIons   AssumpSon:    A  majority  of  transcripts  is  not  differenIally  expressed   Method:    Take  geometric  means  of  read  counts  as  reference  value  sj   to  normalize  transcript  count       Bullard  et  al.  BMC  Bioinforma0cs  2010,  11:94   kij=number  of  reads  in  sample  j  assigned  to  gene  i   v  =  sample  1  to  m  
  • 23. Inferring  DifferenSal  Expression  (DE)   Method   NormalizaS on   Needs   replicas   Input   StaSsScs  for   DE   Availability   edgeR   Library  size     Yes   Raw   counts   Empirical   Bayesian   esImaIon  based   on  NegaIve   binomial   distribuIon   R/Bioconductor   DESeq   Library  size   No   Raw   counts   NegaIve   binomial   distribuIon   R/Bioconductor     baySeq   Library  size   Yes   Raw   counts   Empirical   Bayesian   esImaIon  based   on  NegaIve   binomial   distribuIon   R/Bioconductor     LIMMA   Library  size   Yes   Raw   counts   Empirical   Bayesian   esImaIon   R/Bioconductor     CuffDiff   RPKM   No   RPKM   Log  raIo   Standalone  
  • 24. Typical  DE  Result  Table   Gene  or   transcript   name   Mean  expression   levels   Fold  Change:  measurement  of   changing  magnitude,  calculated  as     FC=baseMeanB/baseMeanA     Typically  Log2(FC)  is  reported   Significance:  use  adjusted  P   value  (padj)  instead  of  raw  P   value  (pval)  unless  you  know   what  you  are  doing  
  • 25. Why  use  adjusted  P-­‐value  instead  of  raw   P-­‐value?   MulSple  Comparison  Problem  –  When  large  number  of  staIsIcal  tests  were   performed  simultaneously  (as  in  genomic  analysis),  some  tests  will   have  P  values  less  than  0.05  purely  by  chance,  even  if  all  your  null  hypotheses   are  really  true.       Benne@-­‐Salmon-­‐2009   The  Dead  Thinking  Salmon  Experiment   -­‐  Buy  a  whole  salmon   -­‐  Take  fMRI  image  of  the  salmon,  which   similar  to  genomic  analysis  asks  the   quesIon  if  a  small  region  (voxels)  of  the   brain  is  acIve   -­‐  Some  region  WILL  BE  significantly  acIve   if  enough  of  picture  and    enough  of   voxel  are  taken   -­‐  SuggesIng  the  dead  salmon  is   thinking…   -­‐  Nothing  is  significant  if  p-­‐val  is  adjusted   Methods  for  Adjustment:    Bonferroni  correcIon,  FDR  controlling  procedures  
  • 26. Heatmap  and  Hierarchical  Clustering   •  Most  common  representaIon   for  differenIal  expression   analysis   •  Hierarchical  clustering  on  both   samples  are  genes  are  oven   performed  to  idenIfy  similar   samples/genes   •  Can  be  generated  using  many   tools,  such  as  R/Bioconductor   heatmap  and  gplots  package    
  • 27. FuncSonal  Enrichment  Analysis   •  Use  gene  expression  to  idenIfy  pathways  or  gene   funcIons  that  are  over-­‐represented   •  Address  the  quesIon:  “What  biological  funcIons   are  different  between  sample  groups?”   •  Many  open-­‐source  and  proprietary  tools   –  GSEA  (h_p://www.broadinsItute.org/gsea/index.jsp)   –  DAVID  (h_ps://david.ncifcrf.gov)   –  TopGO/GOSEQ  (R/Bioconductor)   –  Ingenuity  Pathway  Analysis  (QIAGEN,  proprietary)   •  Detailed  discussion  is  out  of  scope  for  this  course  
  • 29. Design  RNASeq  Experiment   •  Biological  Comparison(s)   •  Replicates   •  Read  length   •  Paired  End/Single  Read   •  Read  depth   •  Pooling  
  • 30. Biological  System  in  QuesIons   Simple  QuesSon   Complex  QuesSon   Examples:   •  Cell  line  groups  treated  with   different  condiIons   •  PaIent  groups  with  the  same   disease  treated  with  different   treatment   Examples:   •  Matched  paIent  samples  from  both   normal  and  diseased  Issues   •  Normal  and  cancer  samples   obtained  from  genotypically  diverse   populaIon  
  • 31. Experimental  QuesSons   •  What  are  my  goals?   –  DifferenIal  expression  analysis  of  genes?   –  DifferenIal  expression  analysis  of  transcripts?   –  IdenIfy  rare  transcript  isoforms?   –  IdenIfy  transcript  polymorphism?   –  IdenIfy  non-­‐coding  RNA  populaIons  such  as  miRNA,   lincRNA?     •  What  are  the  characterisScs  of  systems?   –  Large,  complex  genome  ?  (ie.  Human)   –  Highly  heterogeneous  sample  populaIon  ?  (i.e.  breast   tumor)   –  No  reference  genome  or  transcriptome  ?   –  High  degree  of  alternaIve  splicing?  
  • 32. Experimental  QuesSons   What  are  the  sequencing  opIons?   How  much  money  to  spend?  
  • 33. What  are  Single  Read  (SR)  and  Paired  End   (PE)  sequencing   cDNA   Single  Read  (SR)  :    only  one  end  from  each  cDNA  fragment   is  sequenced  to  generate  one  read  per  fragment   Paired  End  (PE)  :  the  cDNA  fragment  is  sequenced  from   both  ends  to  generate  two  reads  per  fragment  from  two   direcIons  
  • 34. What  are  Single  Read  (SR)  and  Paired  End   (PE)  sequencing   Single  Read  (SR)   -­‐  Sample  the  same  number  of  cDNA  fragment  as  PE   -­‐  Generate  half  of  the  reads  (half  of  the  depth)  than  PE   -­‐  Suitable  for  gene  expression  level  detecIon     -­‐  SubstanIally  cheaper  than  PE   Paired  End  (PE)   -­‐  Sample  the  same  number  of  cDNA  fragment  as  SR   -­‐  Allow  for  more  accurate  detecIon  of  structural  variant,  novel   isoform  idenIficaIon  and  quanIficaIon     Reference  Sequence  
  • 35. Impacts  of  Read  Length  on  RNASeq   Longer  read  length  provides  (ie.  75bp  vs  50bp):   -­‐  be_er  ability  to  assemble  unknown  transcripts   -­‐  Higher  accuracy  to  map  reads  to  complex  regions  (i.e.   repeats,  high  polymorphic  regions)   -­‐  Splice  juncIon  detecIon  is  most  affected  by  read  length   Is  long  read  length  (ie.  100bp  vs  50  bp)  always  give  bejer?   -­‐  Not  necessarily   -­‐  Long  reads  convey  minimal  to  no  advantage  for  differenIal   gene  expression  analysis   50  bp   75bp   50  bp   75bp  
  • 36. Impacts  of  Sequencing  Depth   •  Quick  means  to  detect  more  genes  and  transcript   variants  with  low  expression  (the  more  reads  you   sequence,  the  more  genes  you  find)   •  Require  logarithmic  increase  in  depth  for  linear  increase   in  gene  detected   X   Y   Z   X   Y   Z   RNASeq  1,  30  million  reads   RNASeq  2,  10  million  reads  
  • 37. Number  of  reads  needed  for  an   experiment     •  Different  RNA  sequencing  require  different  number  of  reads   •  More  genes  are  detected  with  higher  sequencing  depth   •  However,  the  increase  of  detected  genes  reduces  substanIally   •  Understand  your  sequencing  system  before  deciding  on  depth   •  Can  always  increase  depth  by  addiIonal  sequencing  on  the  same   library   –  Unlike  microarray  there  is  very  limited  batch  effect  for  RNASeq   Differen0al  expression  in  RNA-­‐seq:  A  ma@er   of  depth.  Genome  Res.  2011.    
  • 38. Experimental  Design   •  Technical  replicates   –  Not  needed:    RNASeq  have  low  technical  variaIon   •  Minimize  batch  effects   •  Biological  replicates   –  Not  needed  for  novel  transcript  idenIficaIon  and   transcriptome  assembly   –  EssenIal  for  differenIal  expression  analysis   –  Difficult  to  esImate  the  minimum  number   •  3+  for  cell  lines   •  5+  for  inbred  lines  (i.e.  mouse,  model  organsims)   •  20+  for  human  samples    (usually  unachievable)   –  Must  have  3+  to  perform  staIsIcal  analysis  
  • 39. Experimental  Design   •  Pooling  samples   – Limited  RNA  obtainable   •  Tumor  samples  from  hard  to  reach  Issue  type  (i.e.   brain)   – Novel  transcriptome  assembly   – Don’t  do  it  unless  you  know  what  you  are  doing  
  • 40. QuesSons  to  ask  when  gekng  raw   RNASeq  data  back   •  How  was  the  RNA  extracted?   •  How  was  RNASeq  library  constructed?   •  Which  playorm  was  the  library  sequenced  on?   •  How  long  was  the  read  length?   •  Was  sequencing  done  with  single  read  or   paired  end?   •  How  many  reads  were  sequenced  per  sample?   •  Where  is  the  QC  report?  
  • 41. Check  list  for  gekng  RNASeq  DE  analysis   results  back   q   Fastq  files   q   FastQC  Report   q   BAM  files   q   RNASeq  QC  Report  (Not  discussed)   q Table  of  DifferenIally  Expressed  Genes/   Transcripts   q   Heatmaps   q   FuncIonal  Enrichment  Analysis  Table  
  • 42. Recognize  Yourself  as  a  Genomic  Data   Consumer   BioinformaScists/Data  ScienSsts   -­‐  Let  data  drive  scienIfic   hypothesis  generaIon   -­‐  Start  with  raw  data  (i.e.  fastq)   -­‐  Process  raw  data  by  privately   tuned  pipelines     KNOW  YOUR  DATA  SOURCE     TranslaSonal  ScienSsts   -­‐  Start  with  a  specific  hypothesis   derived  from  observaIon   -­‐  Find  processed  to  perform   secondary  analysis   -­‐  Use  readily  available  tools   -­‐  Interpret  results  in  the  context   of  iniIal  hypothesis   KNOW  YOUR  TOOLS