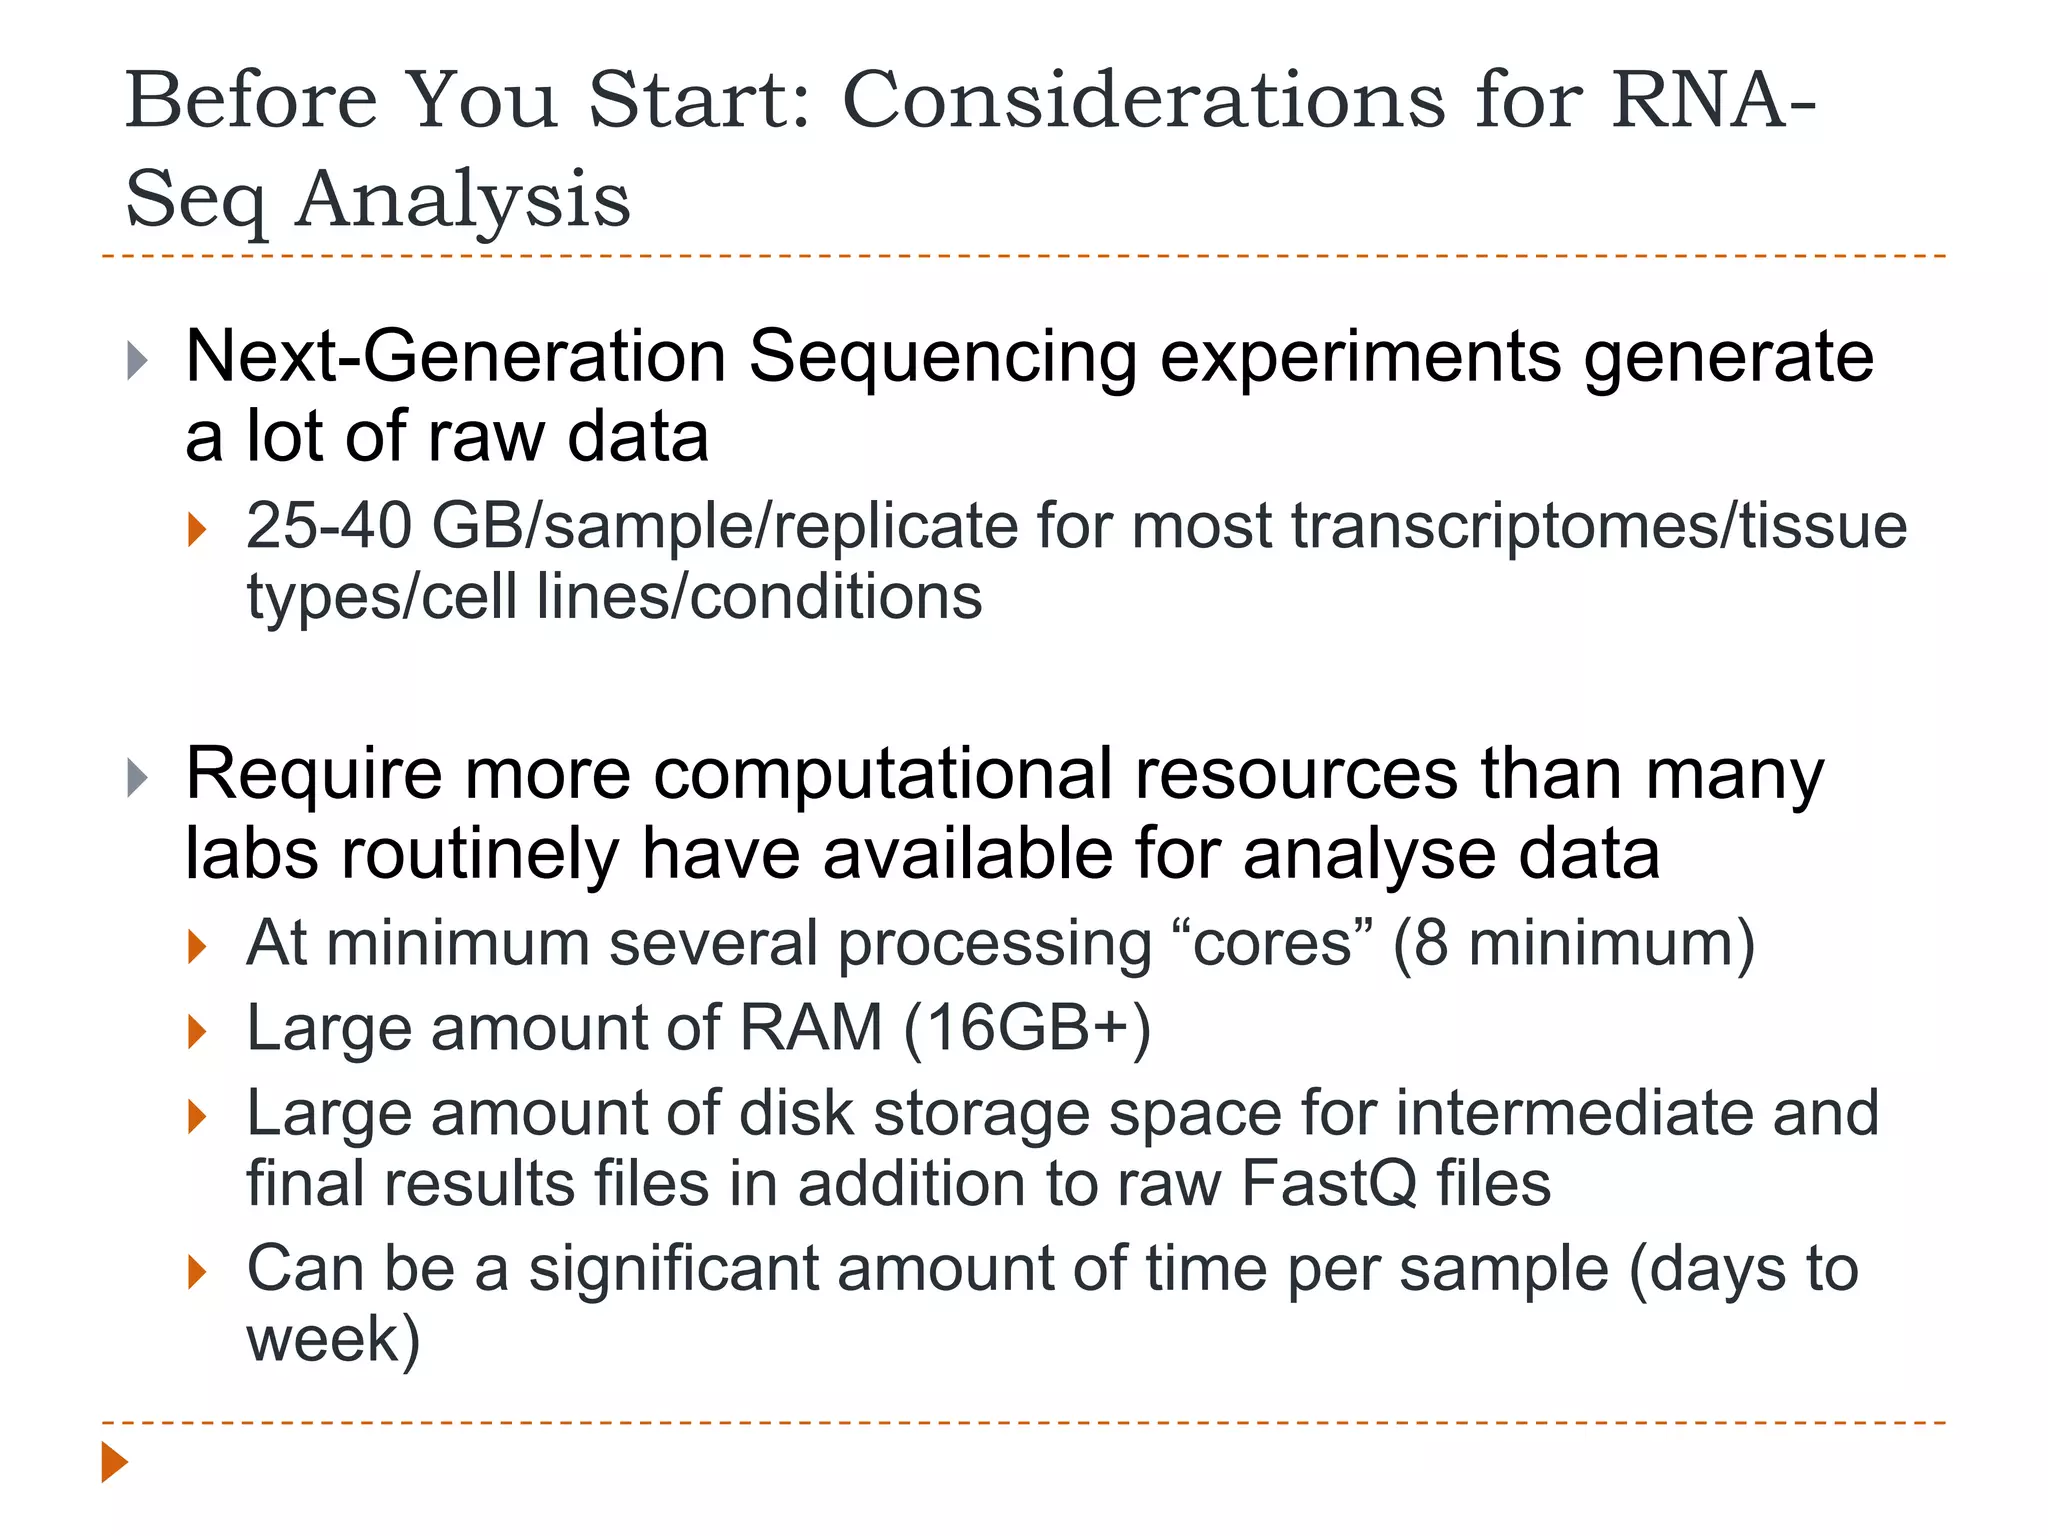
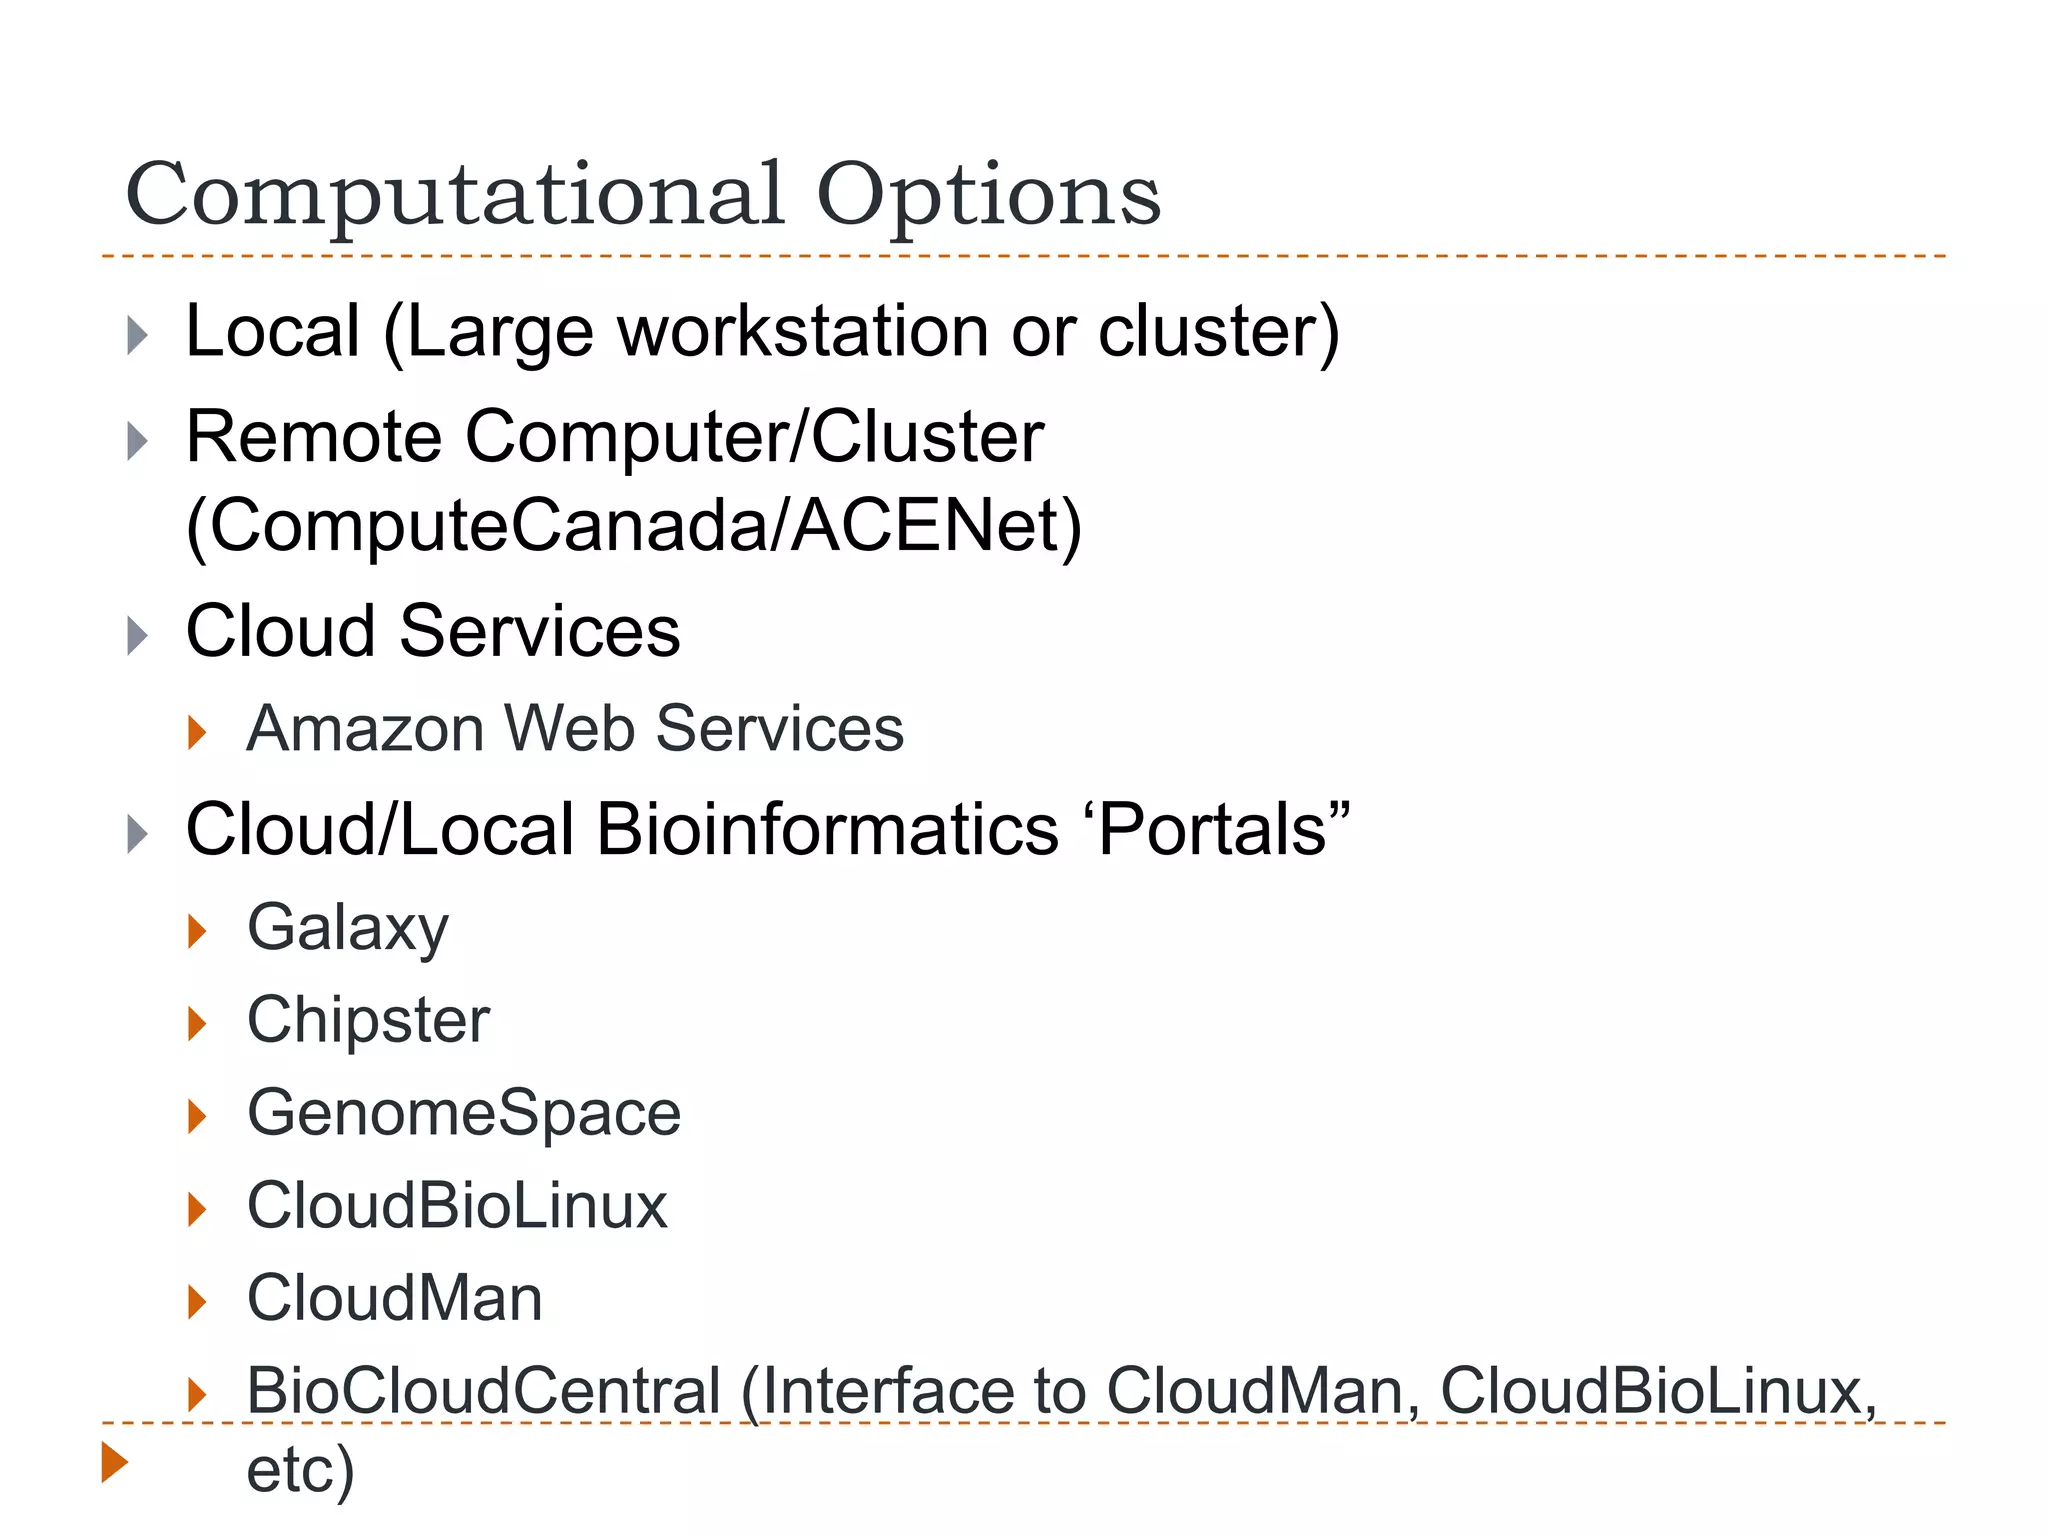
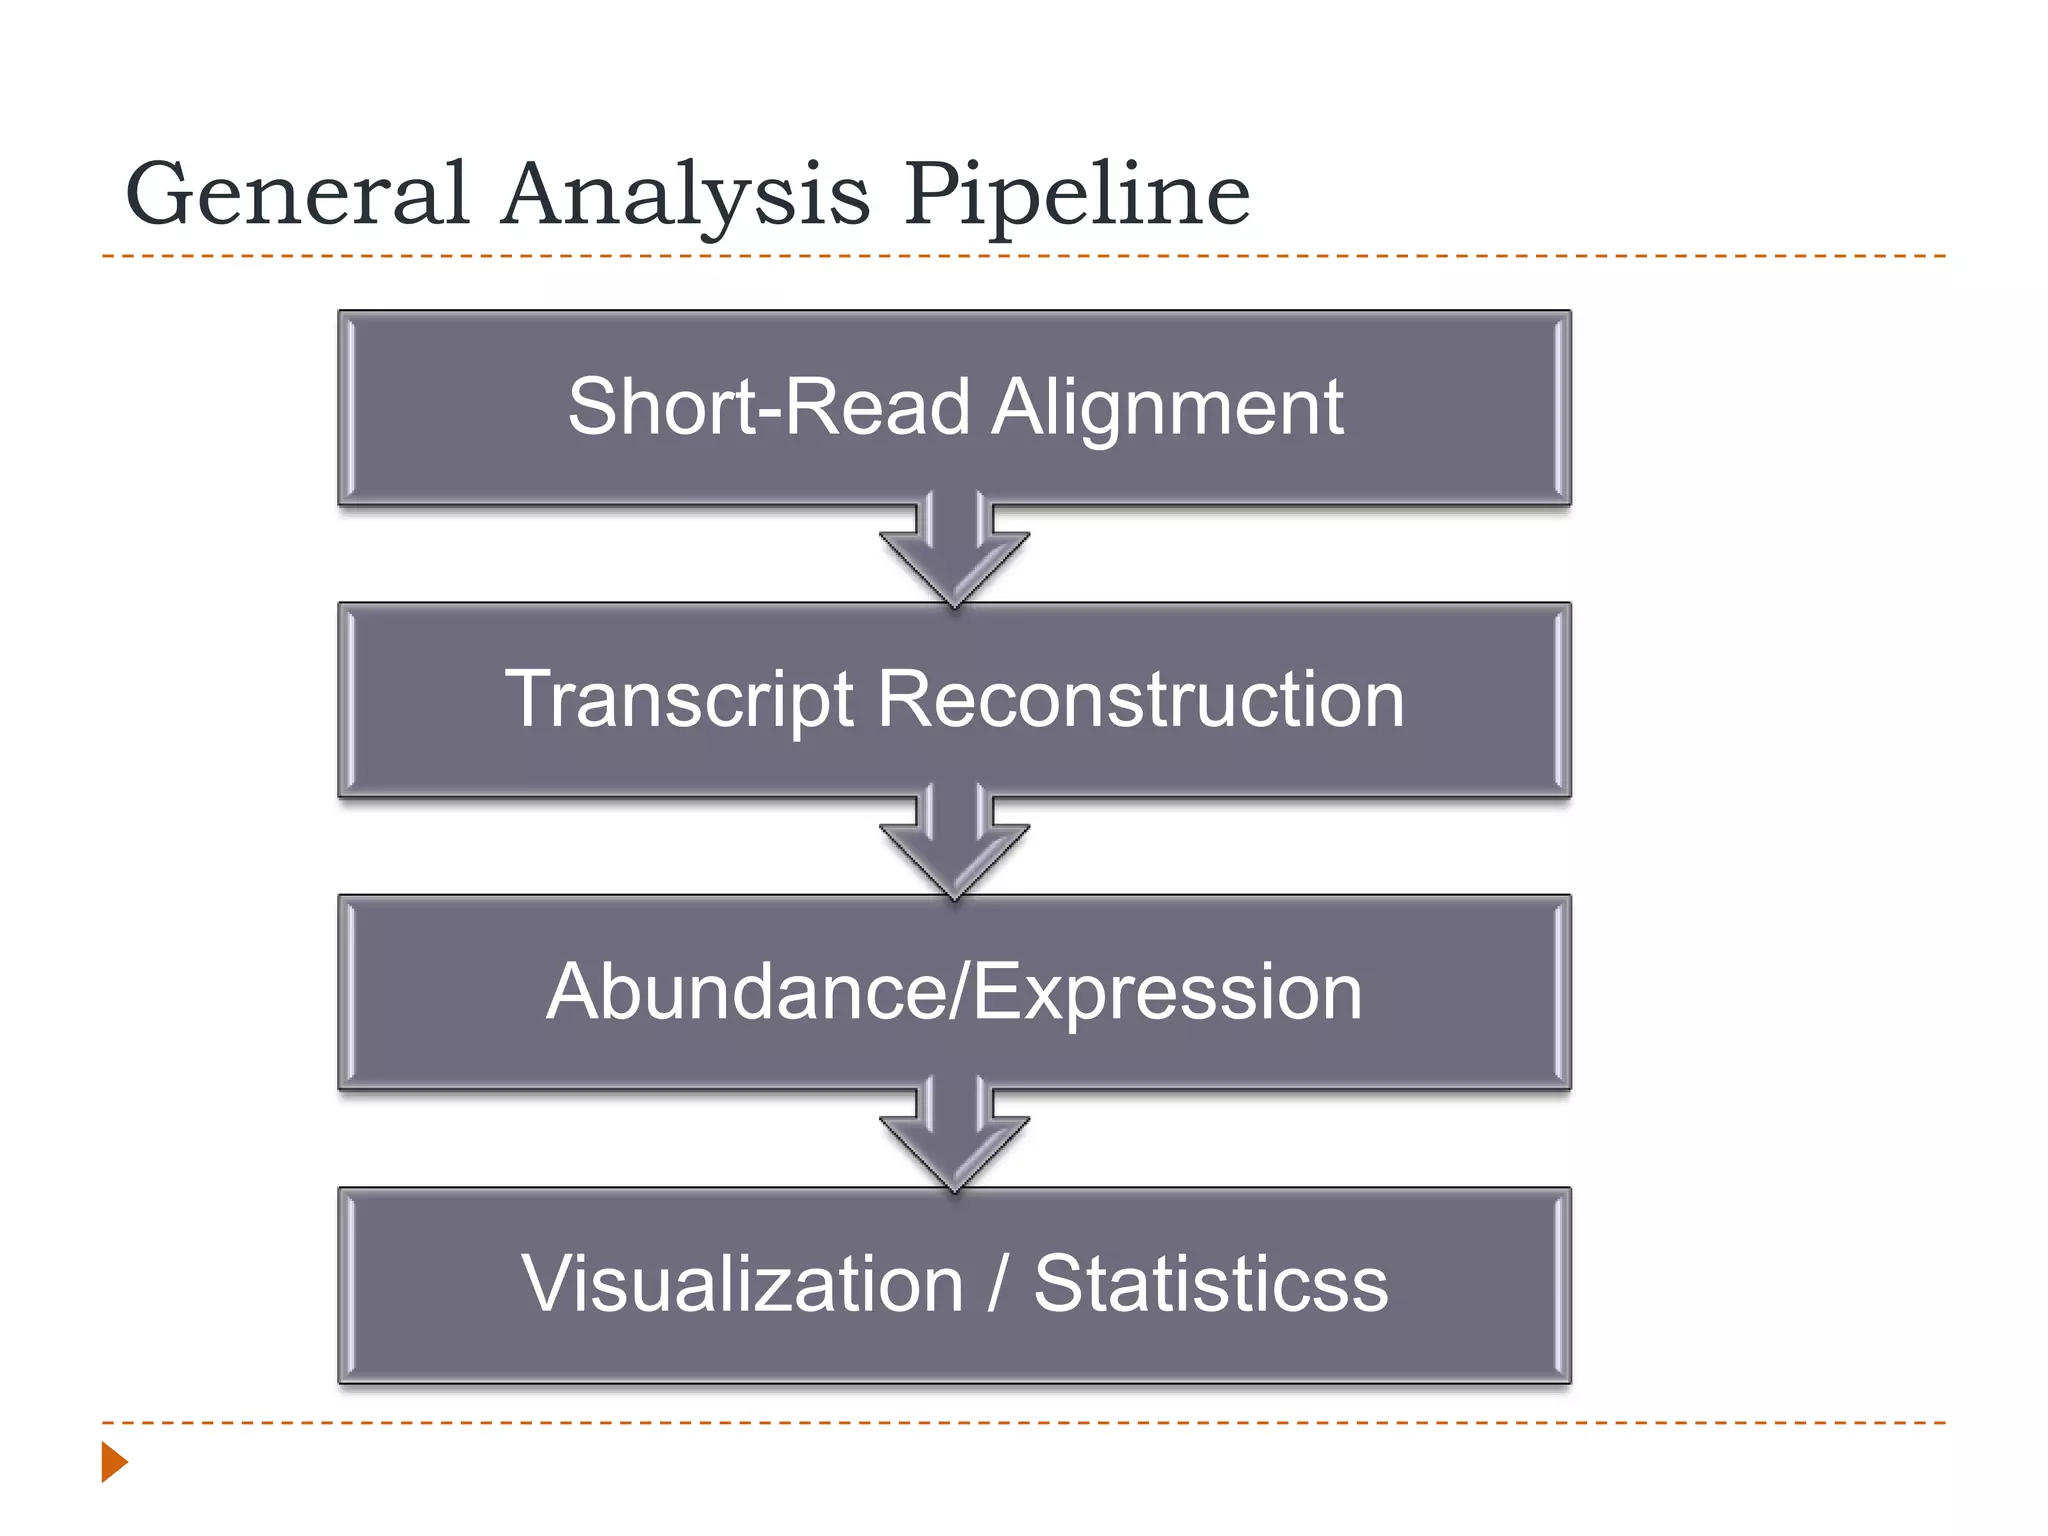
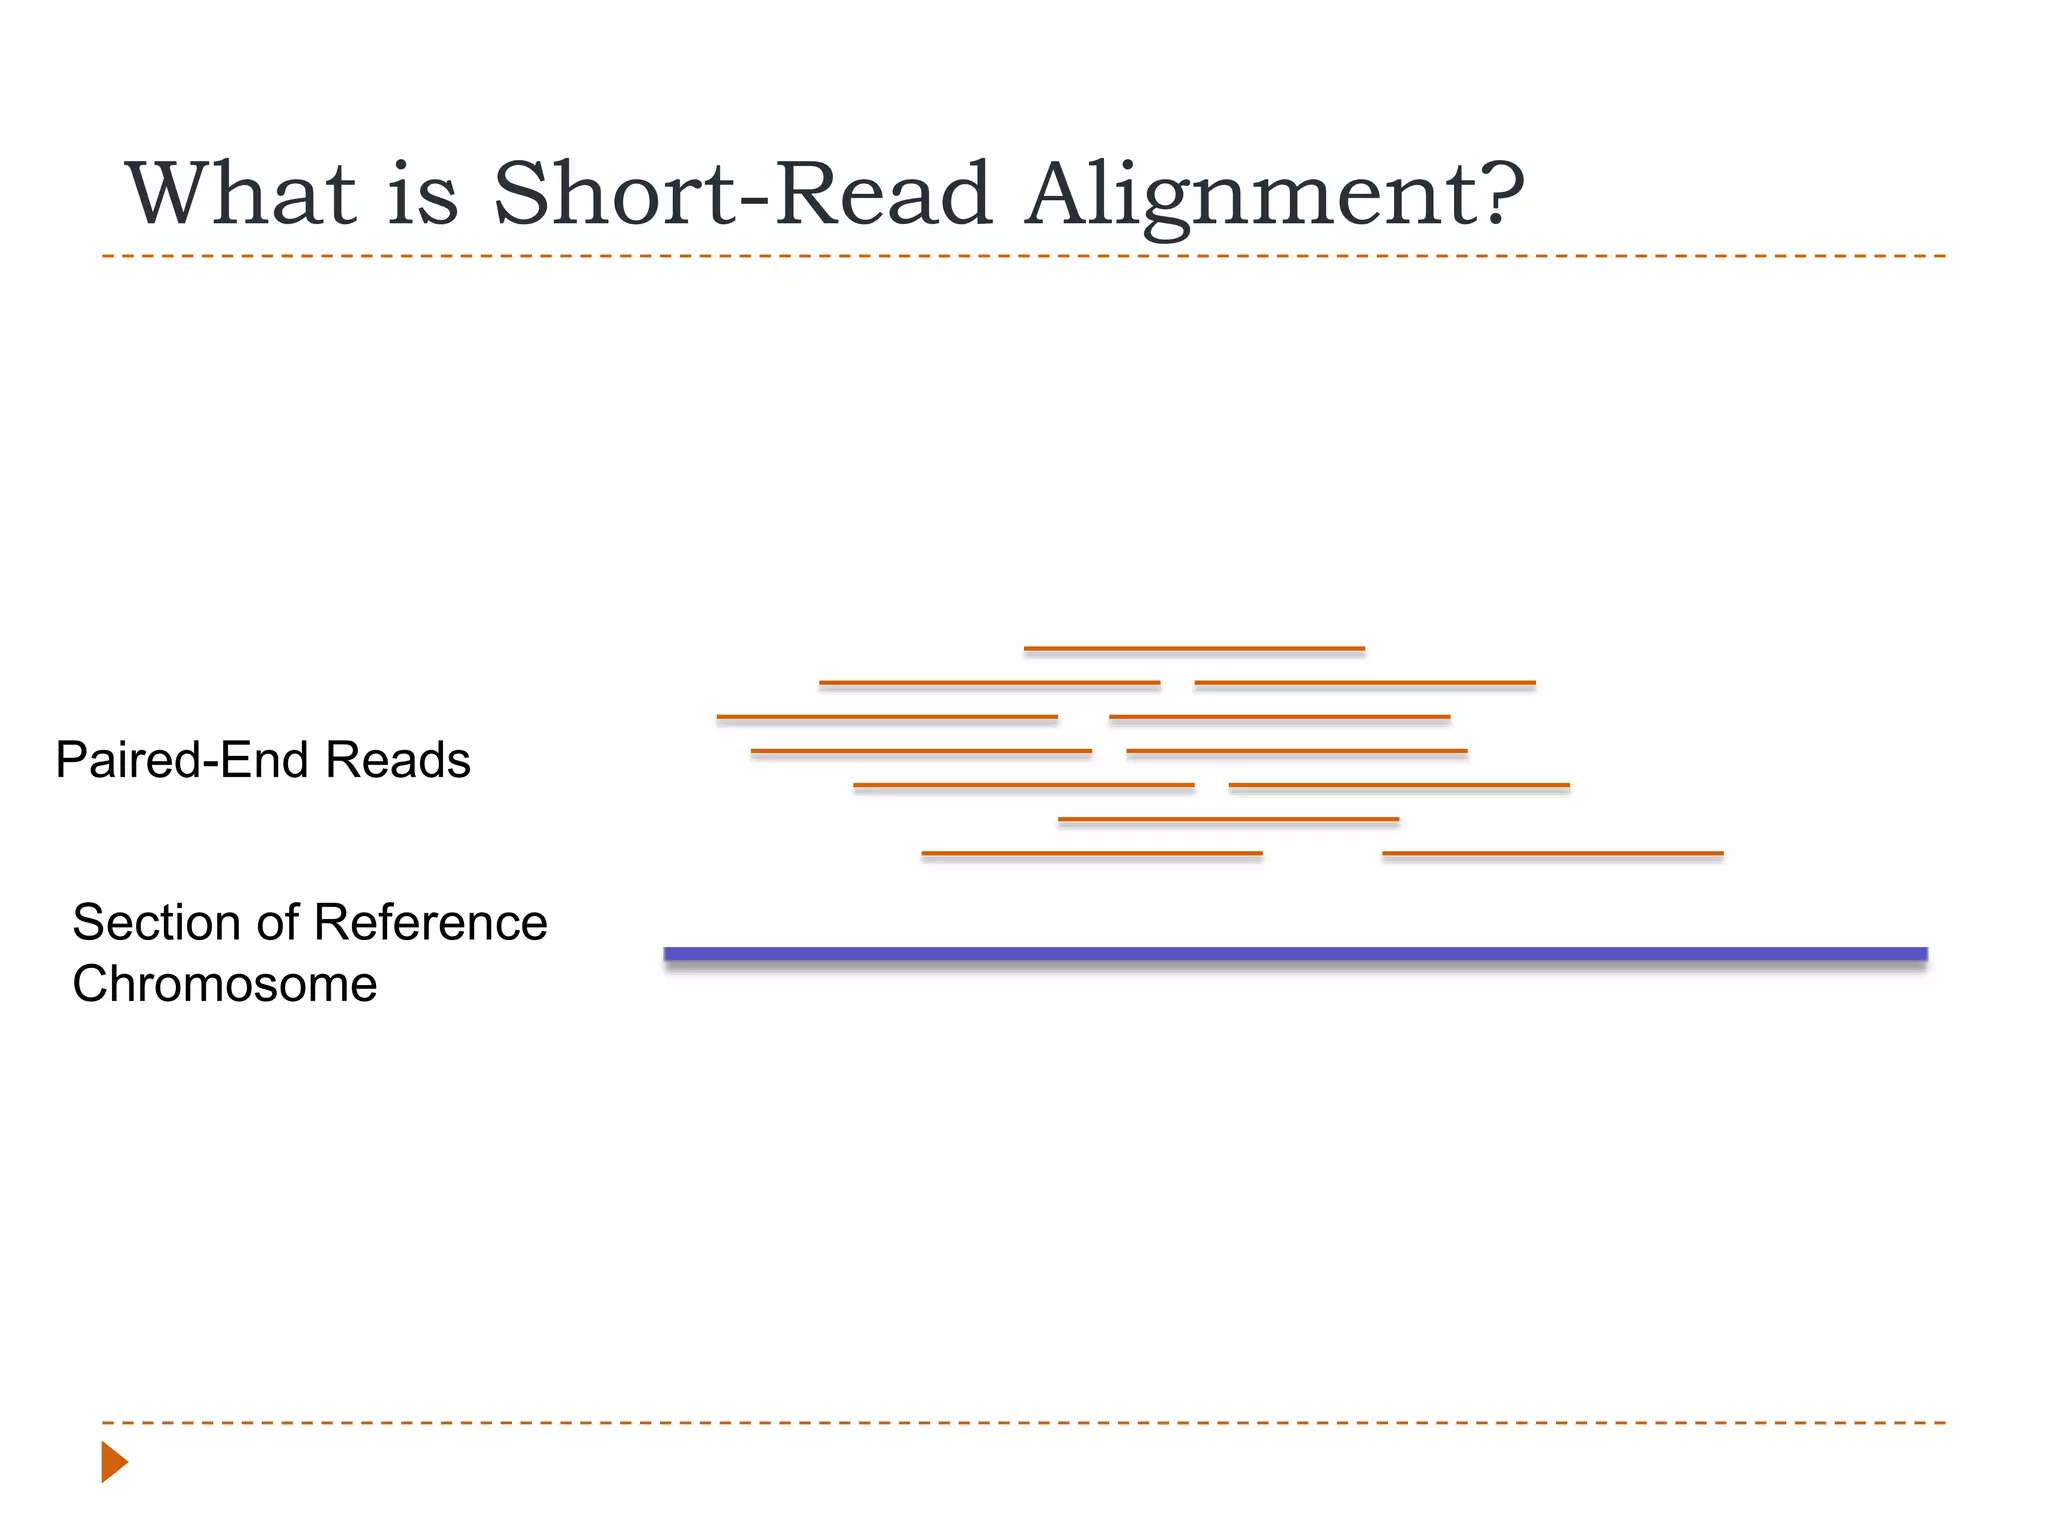
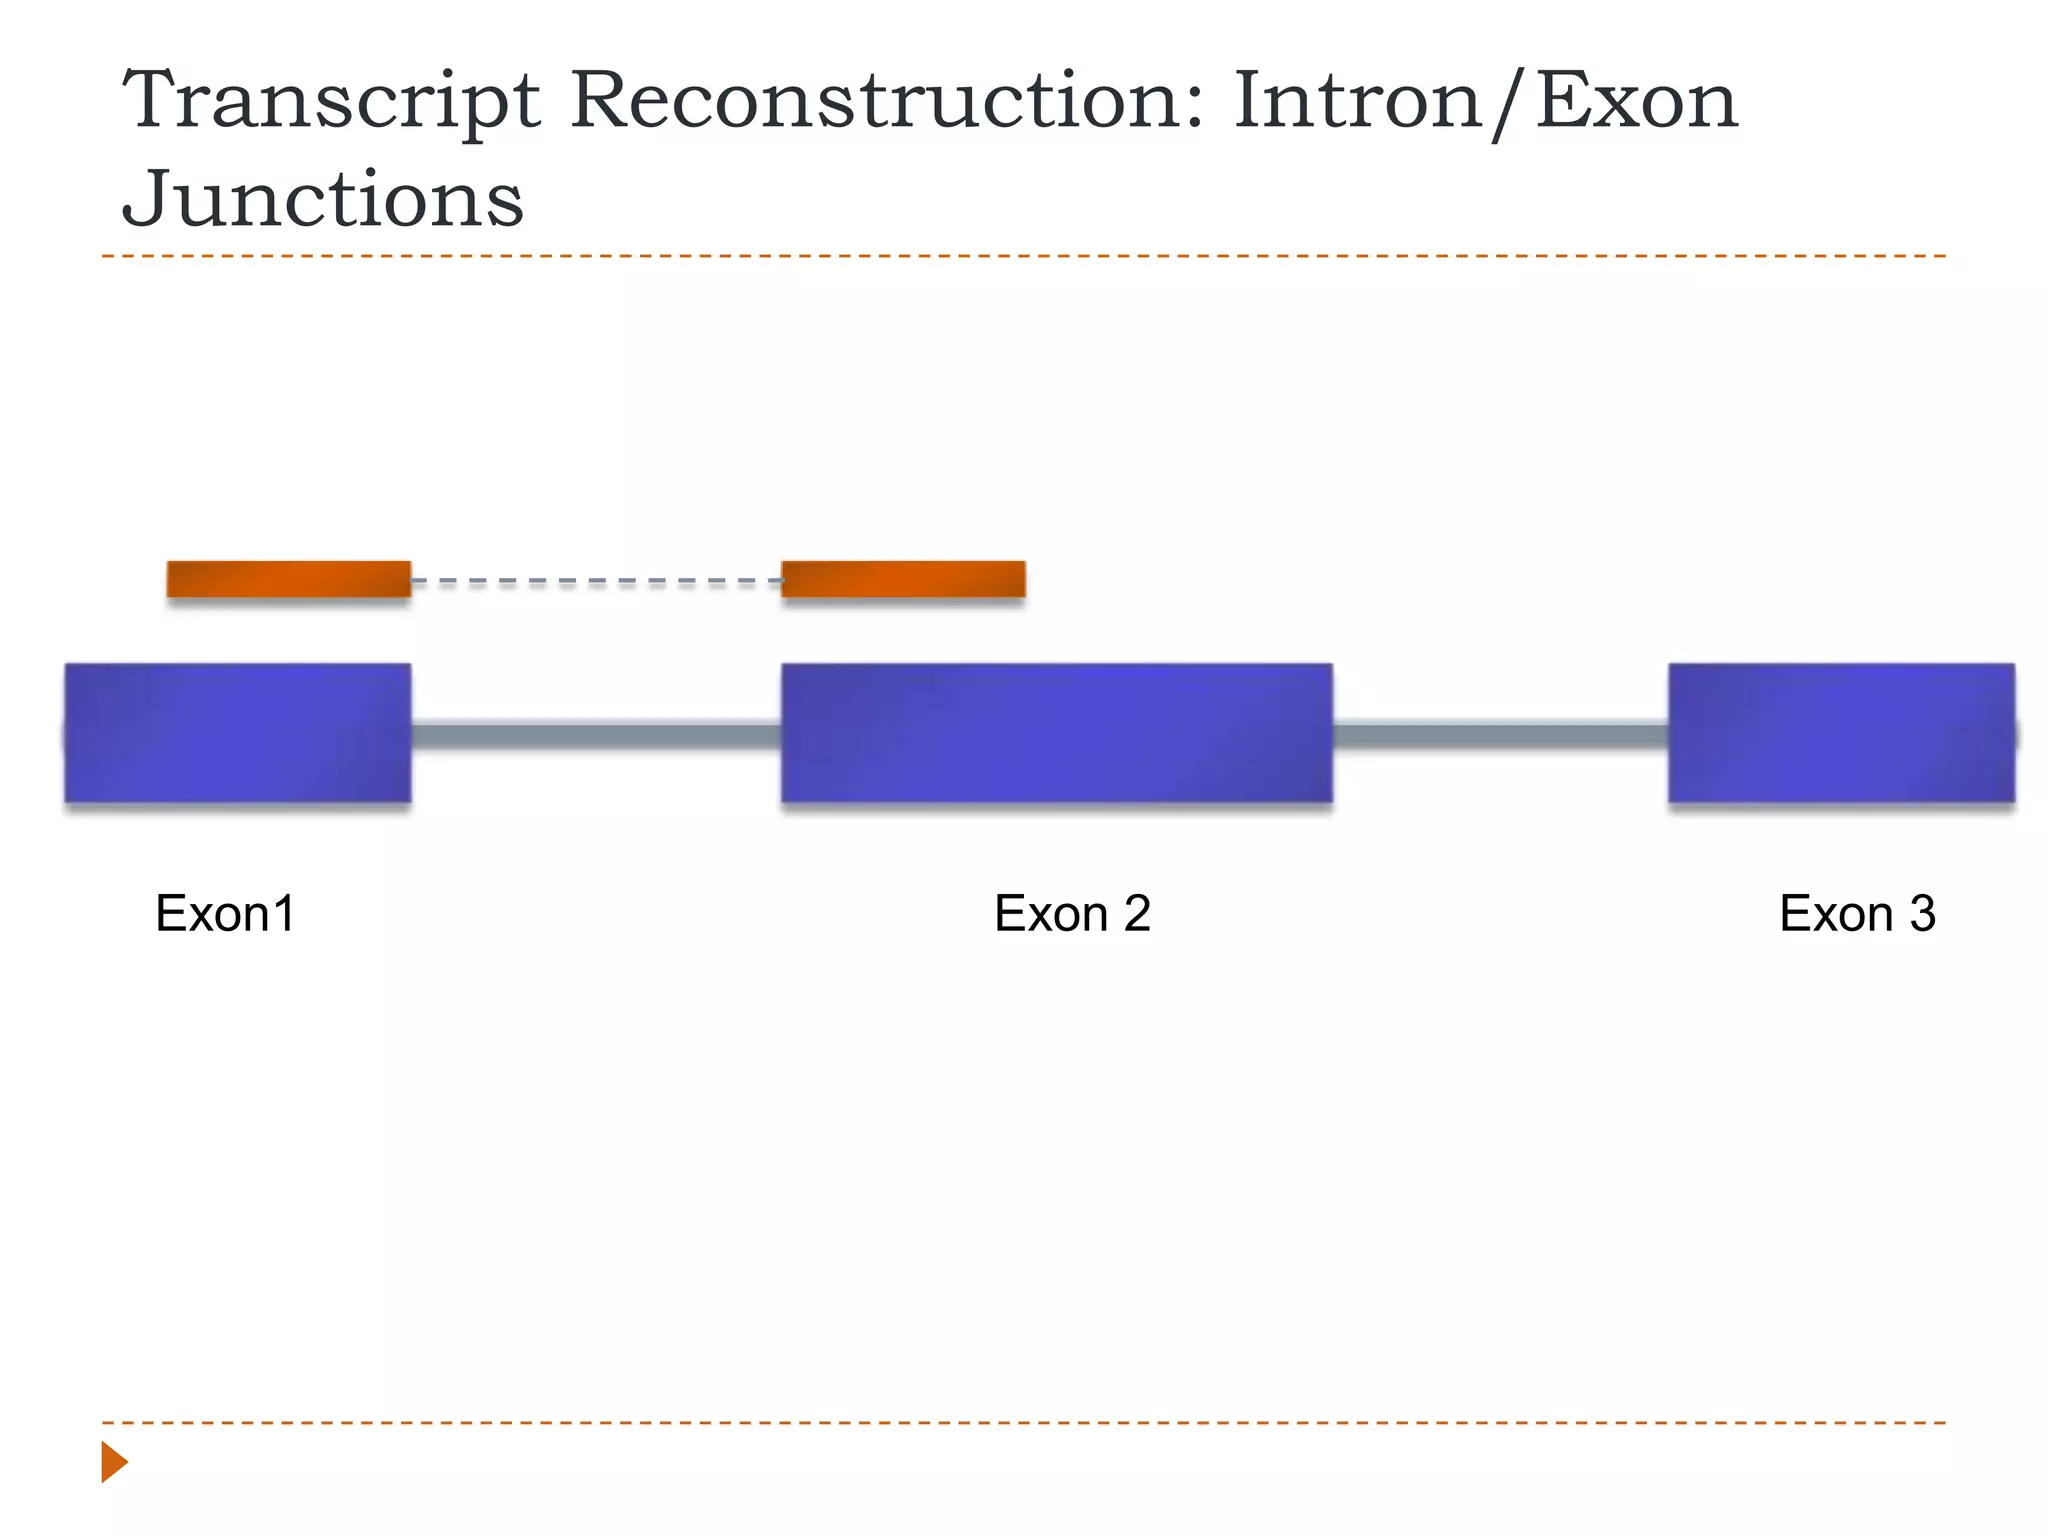
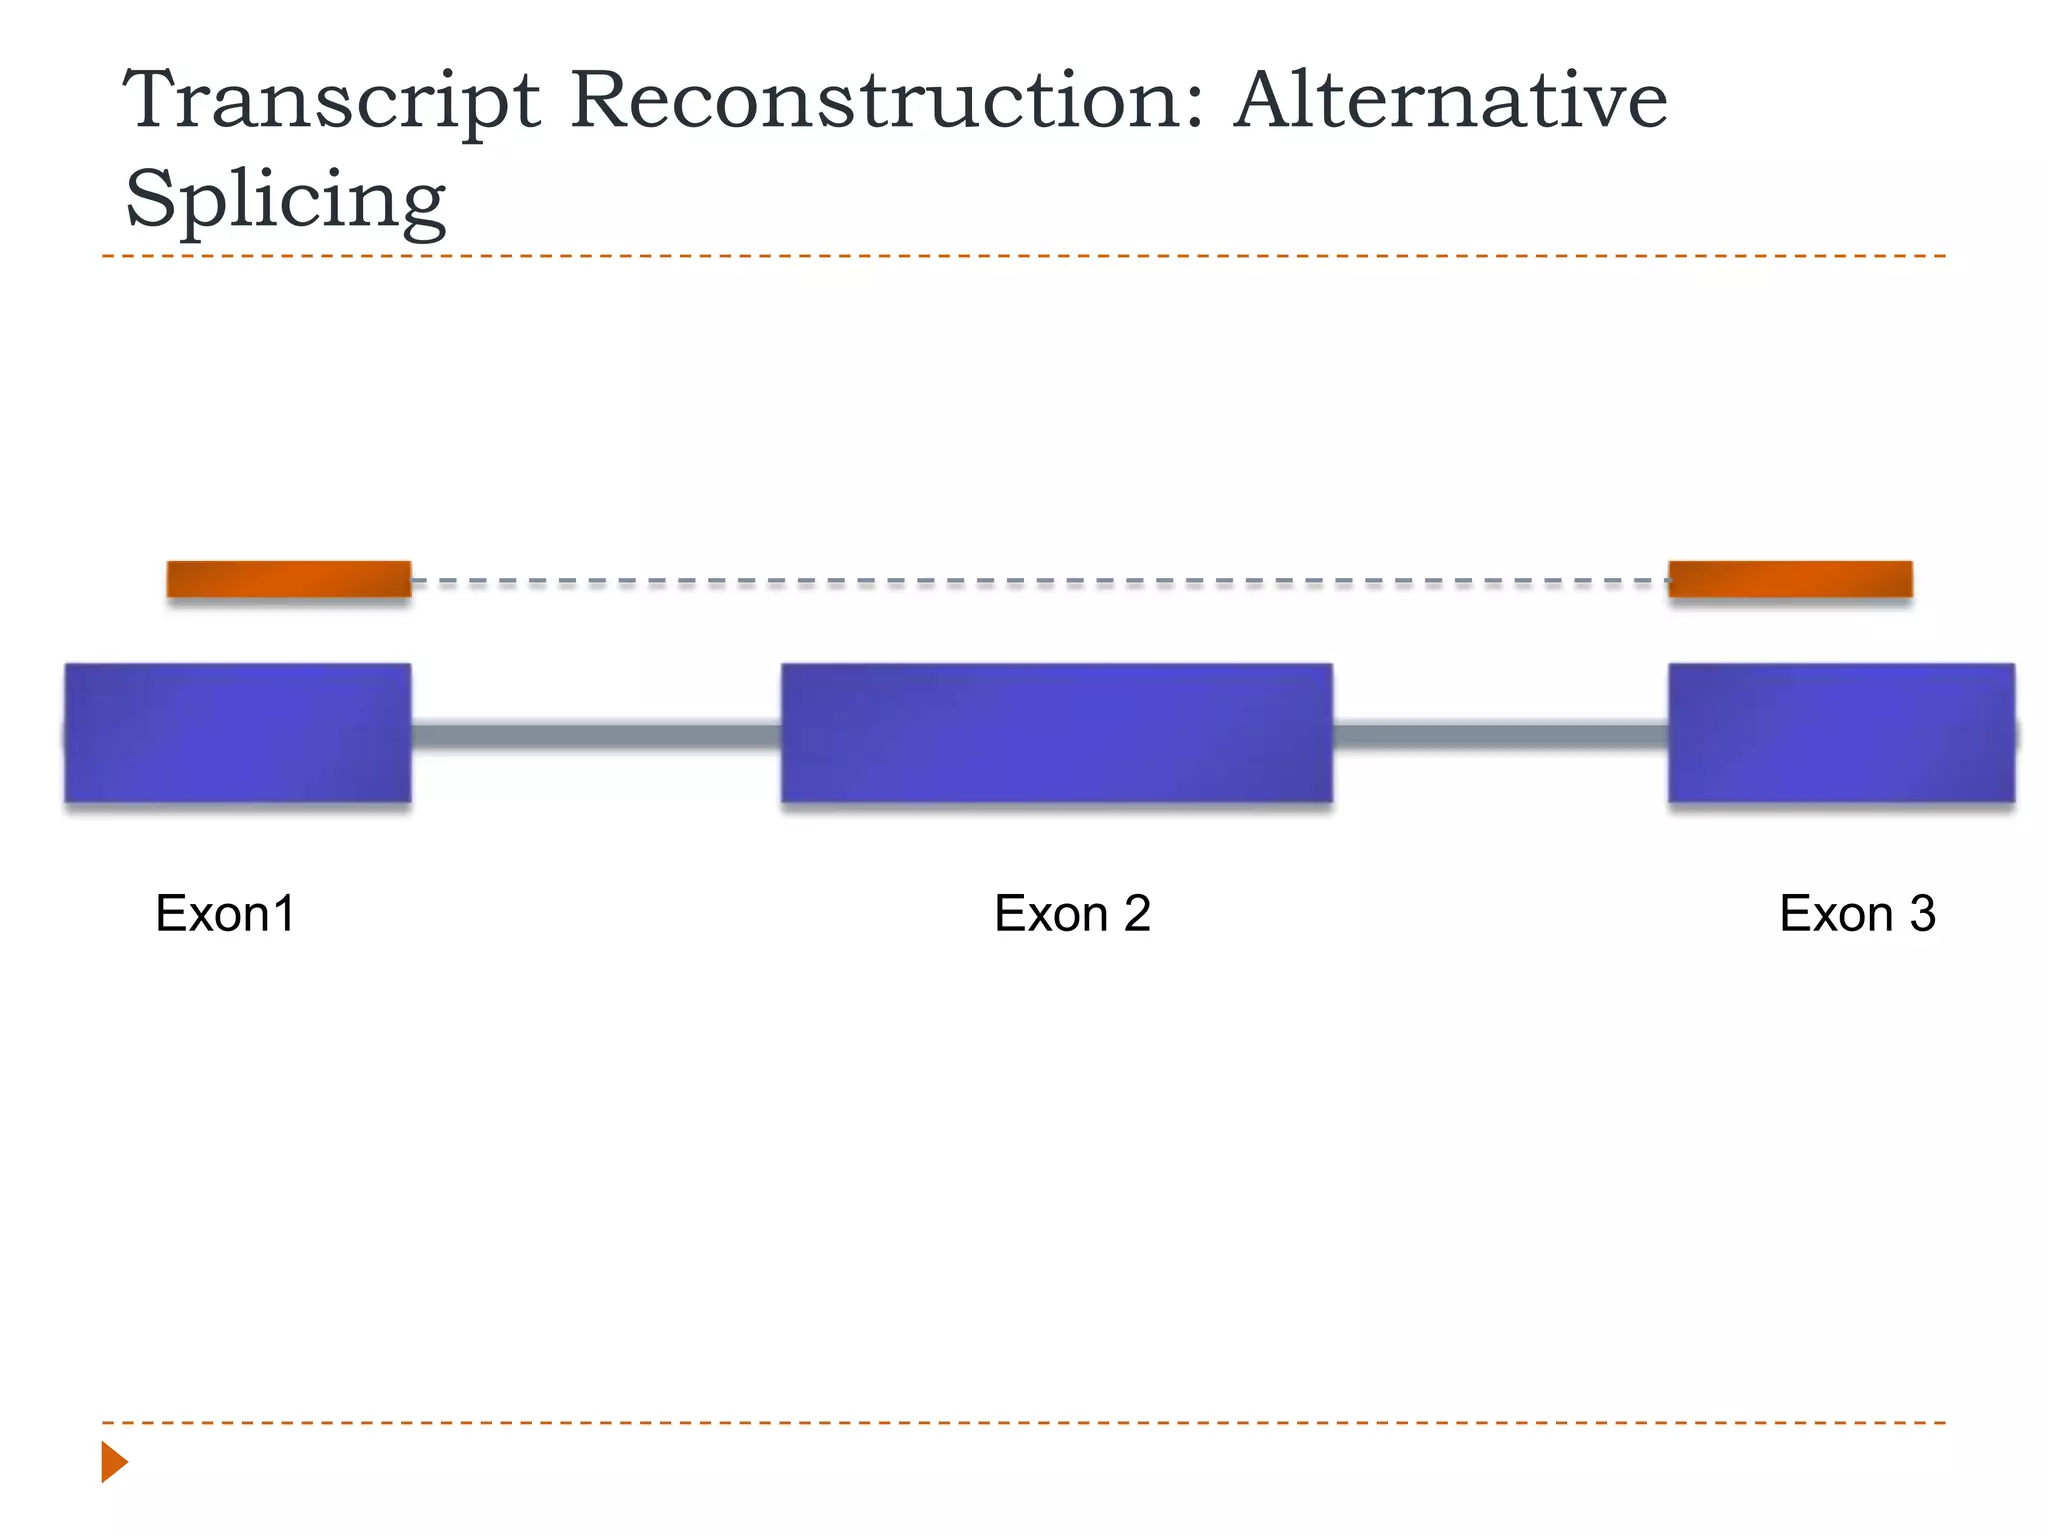
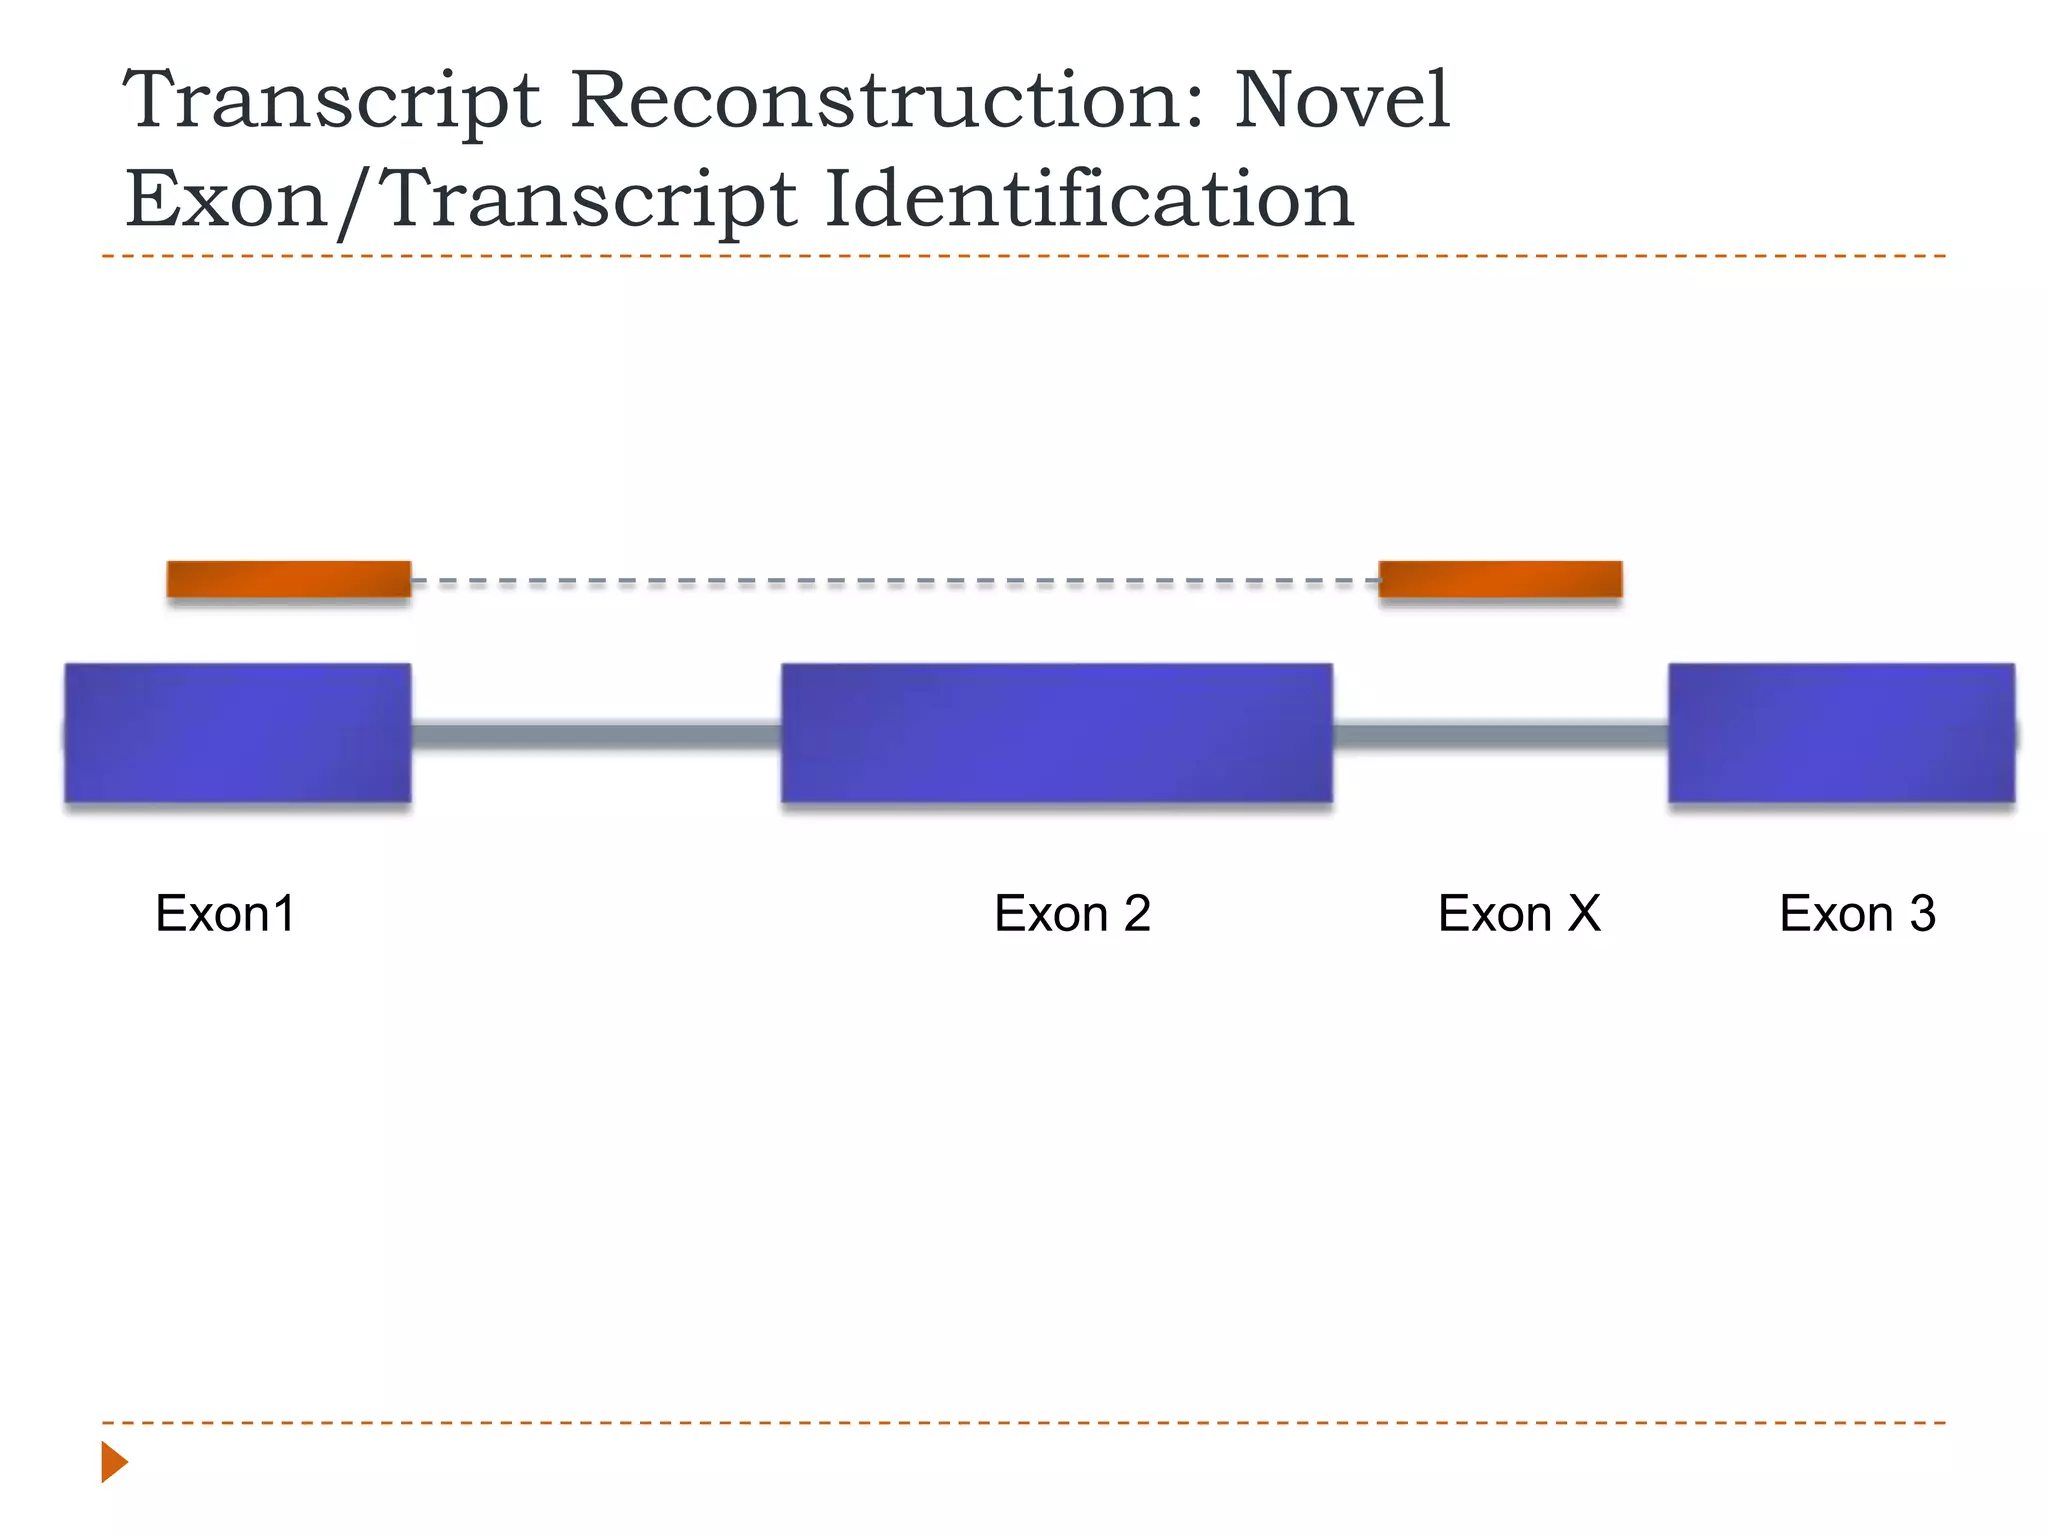
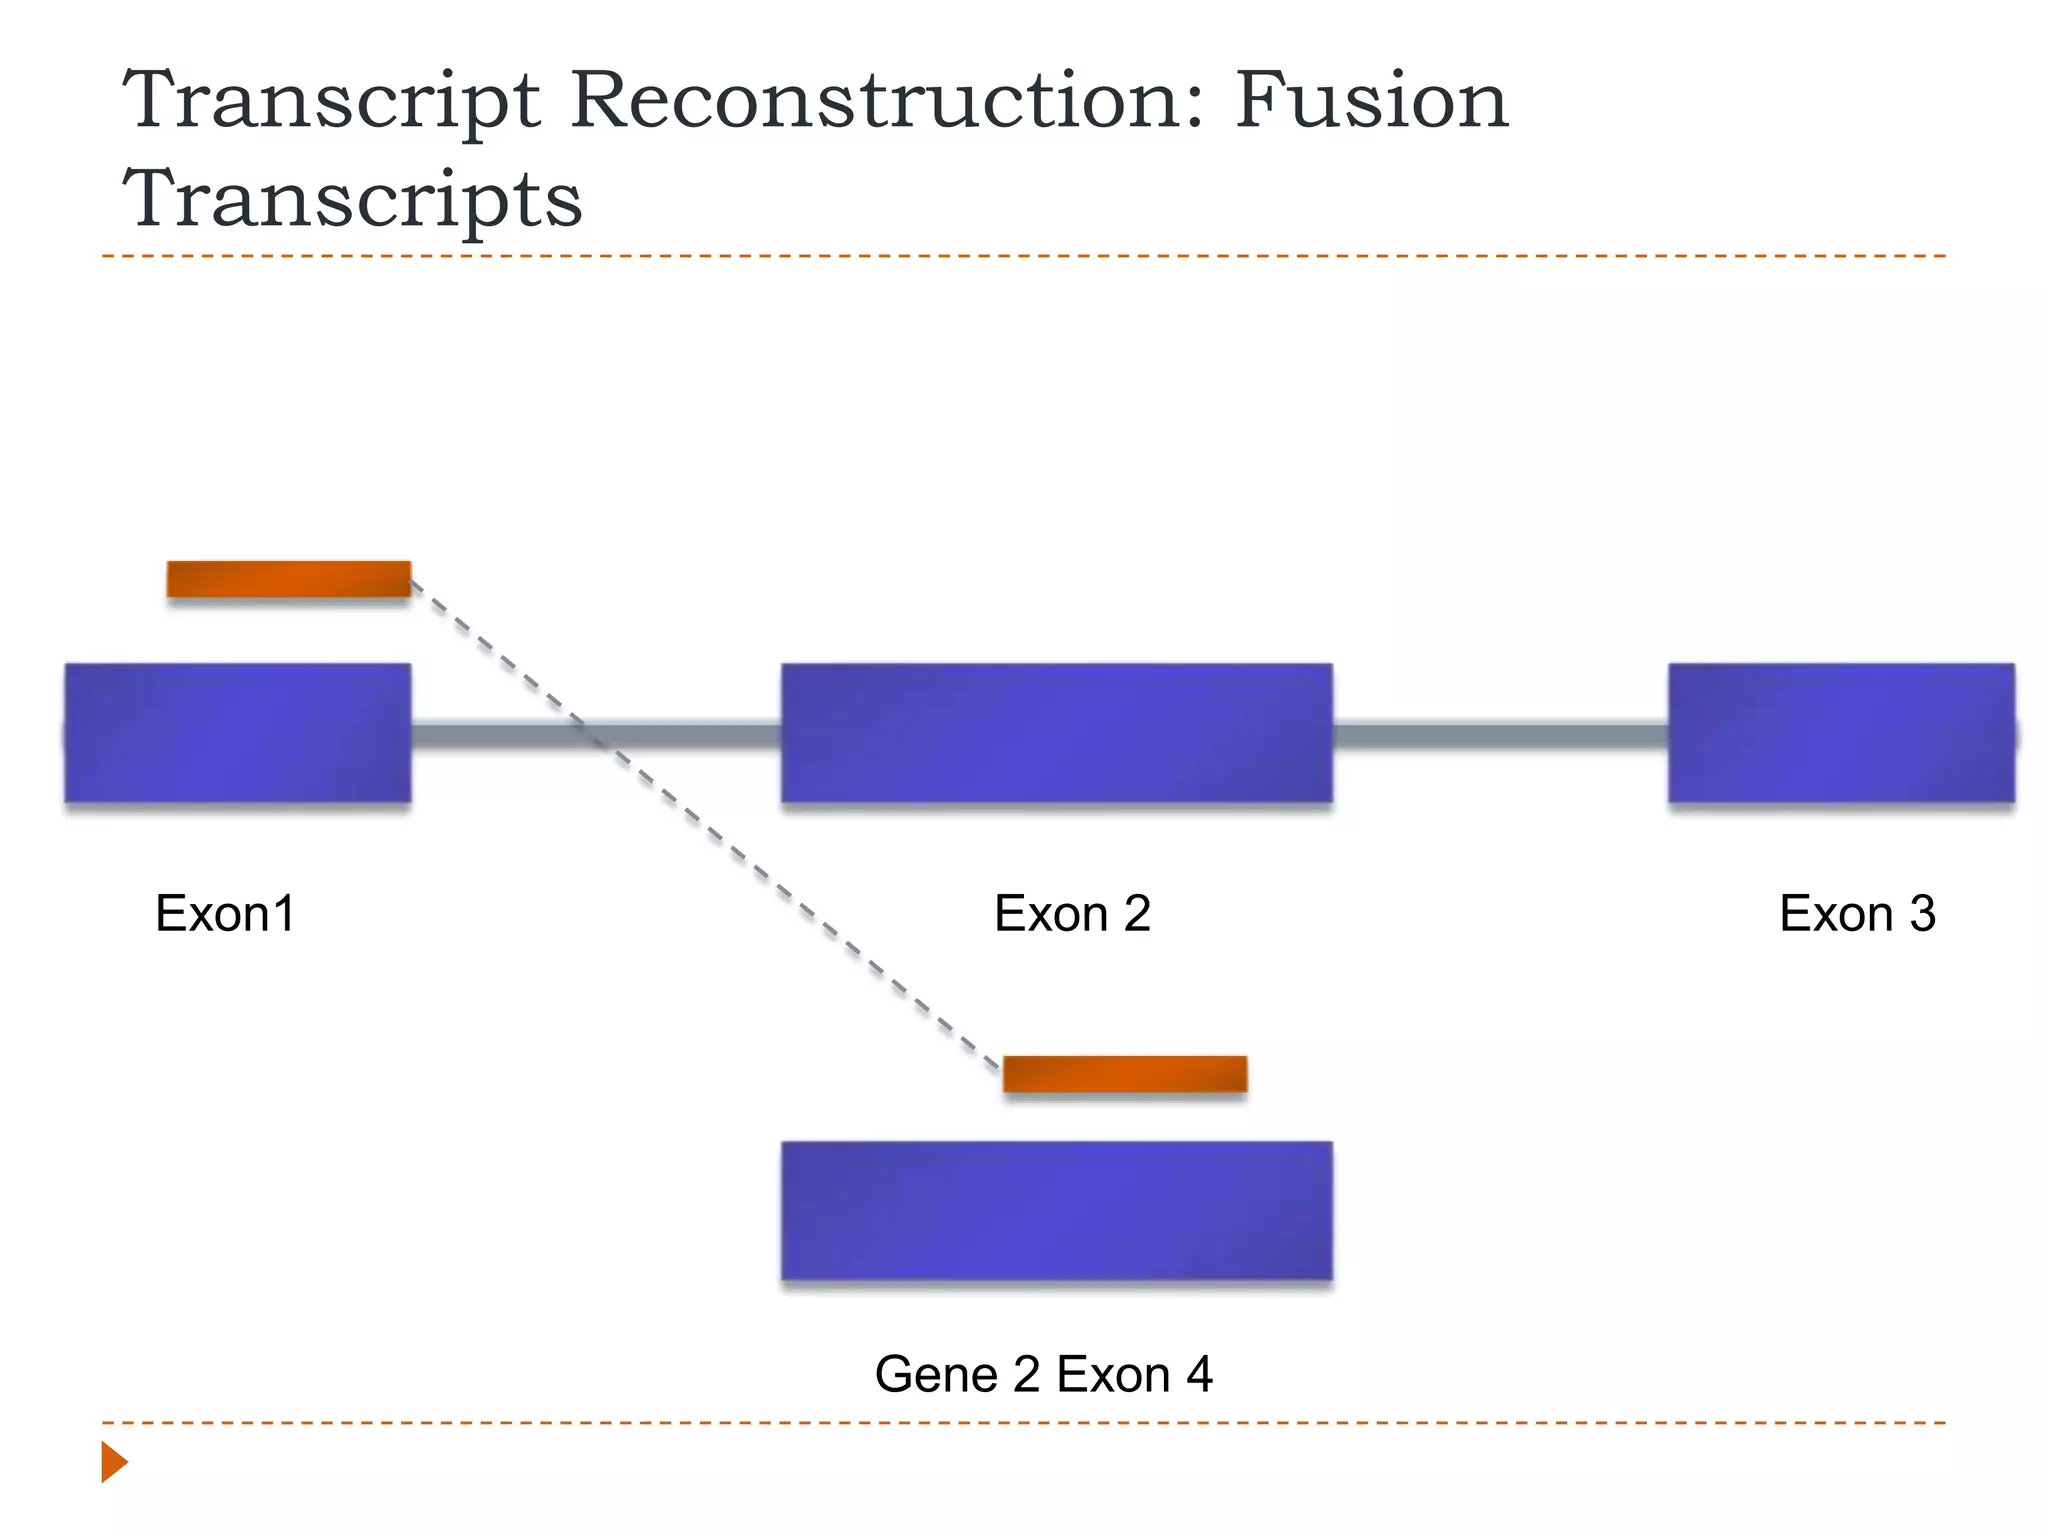
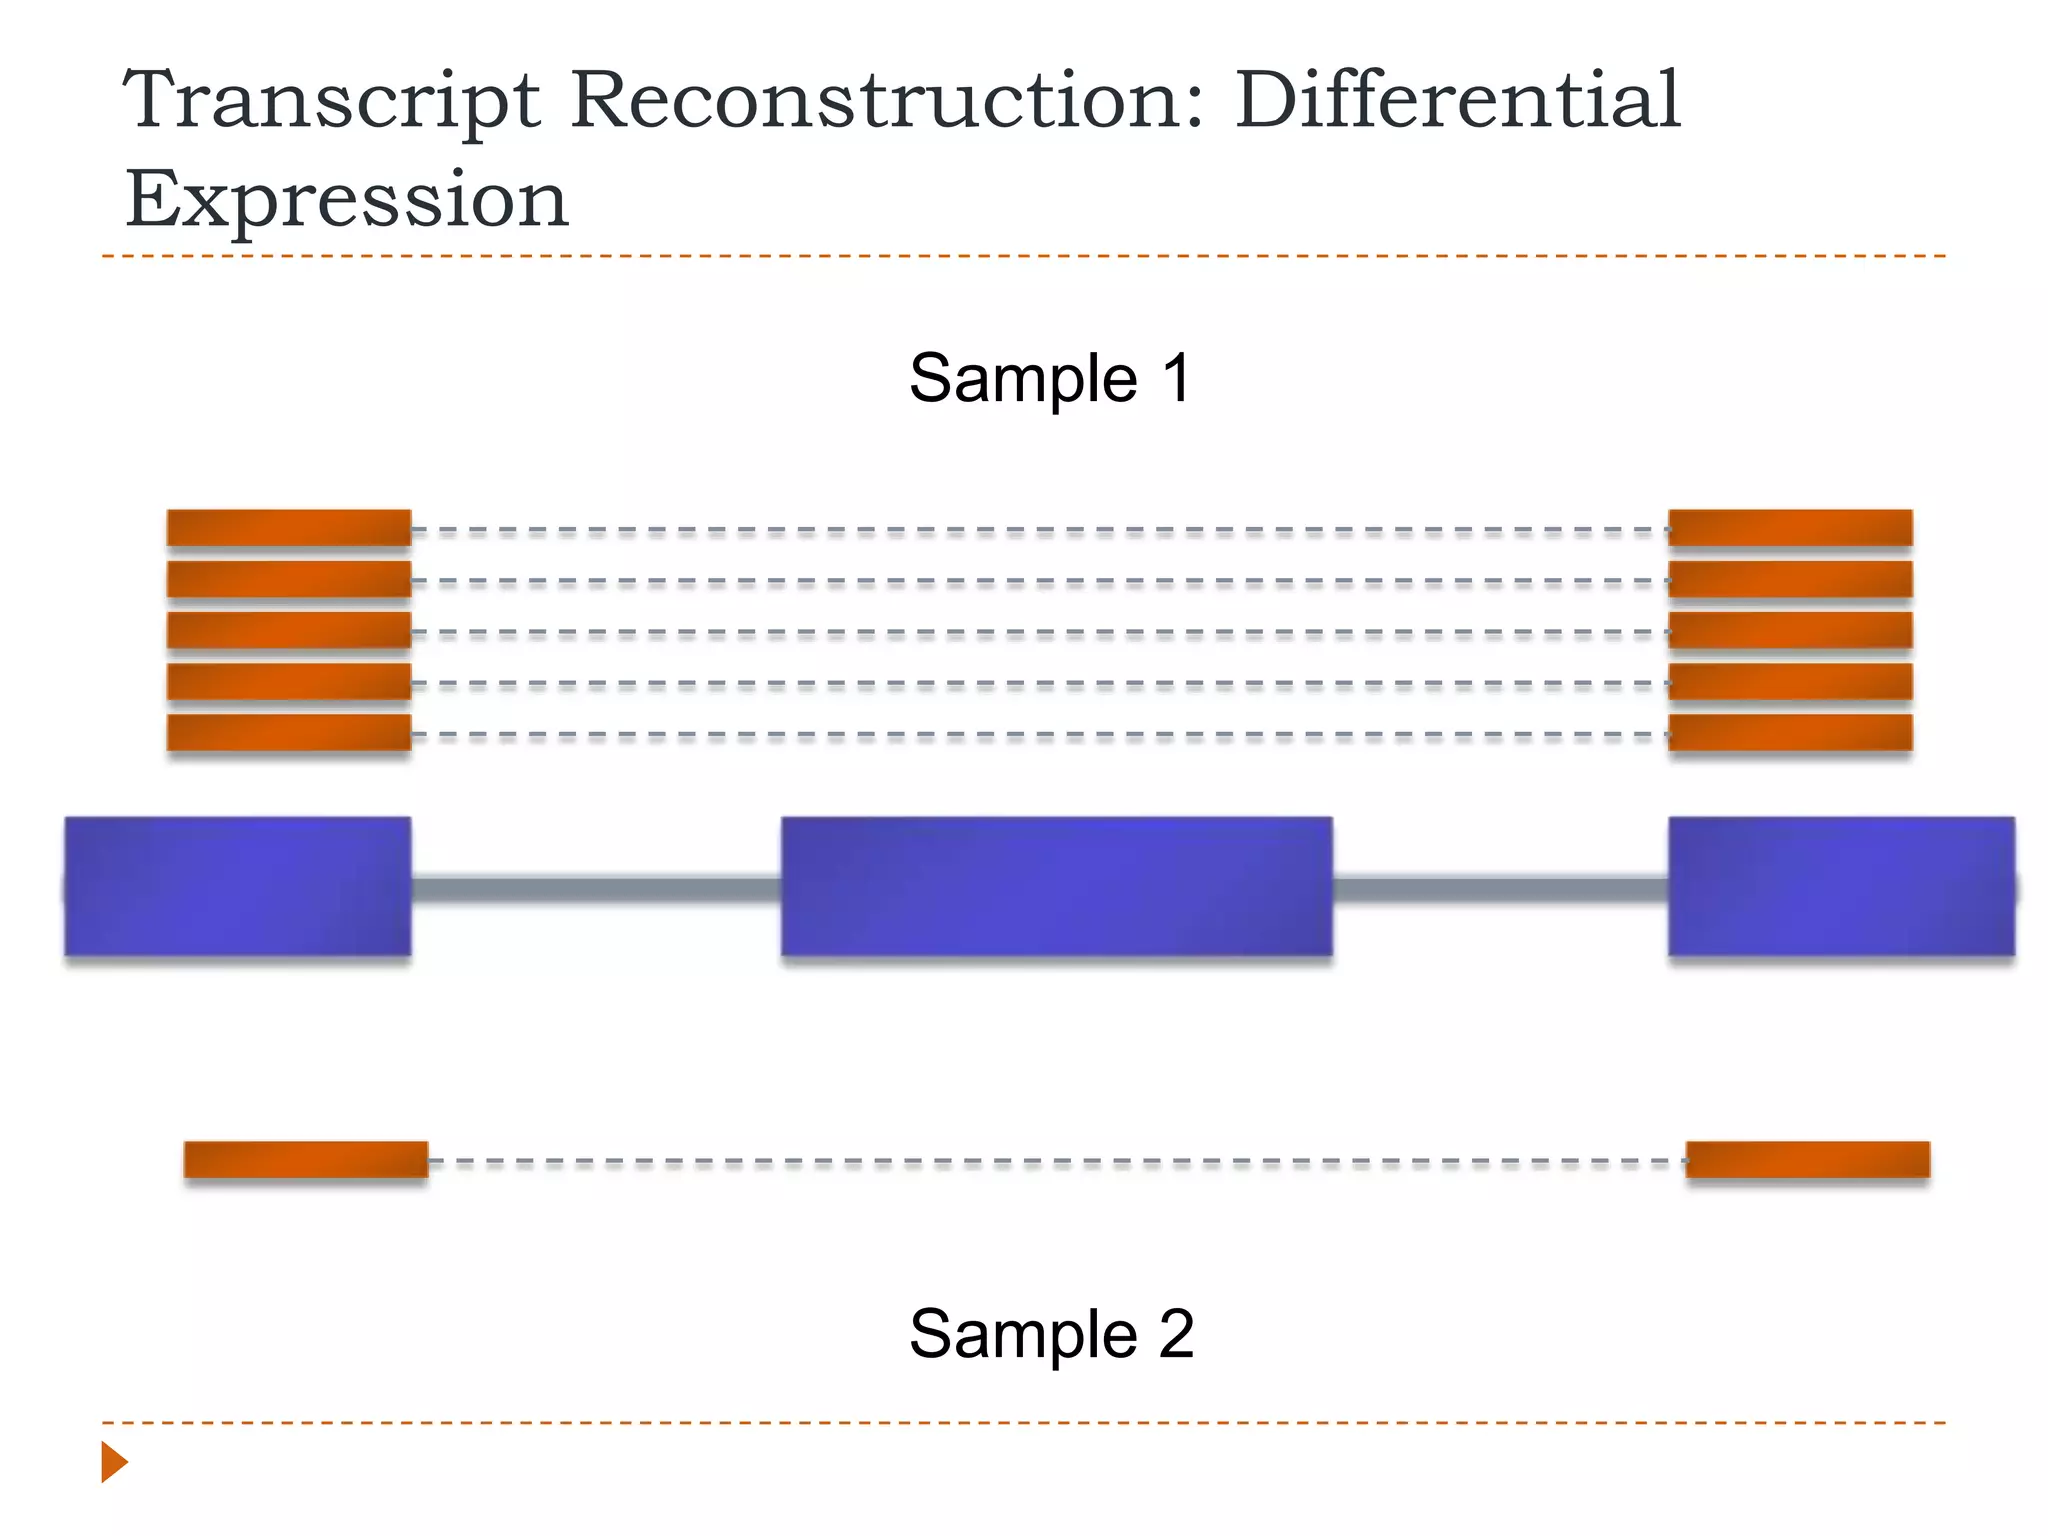
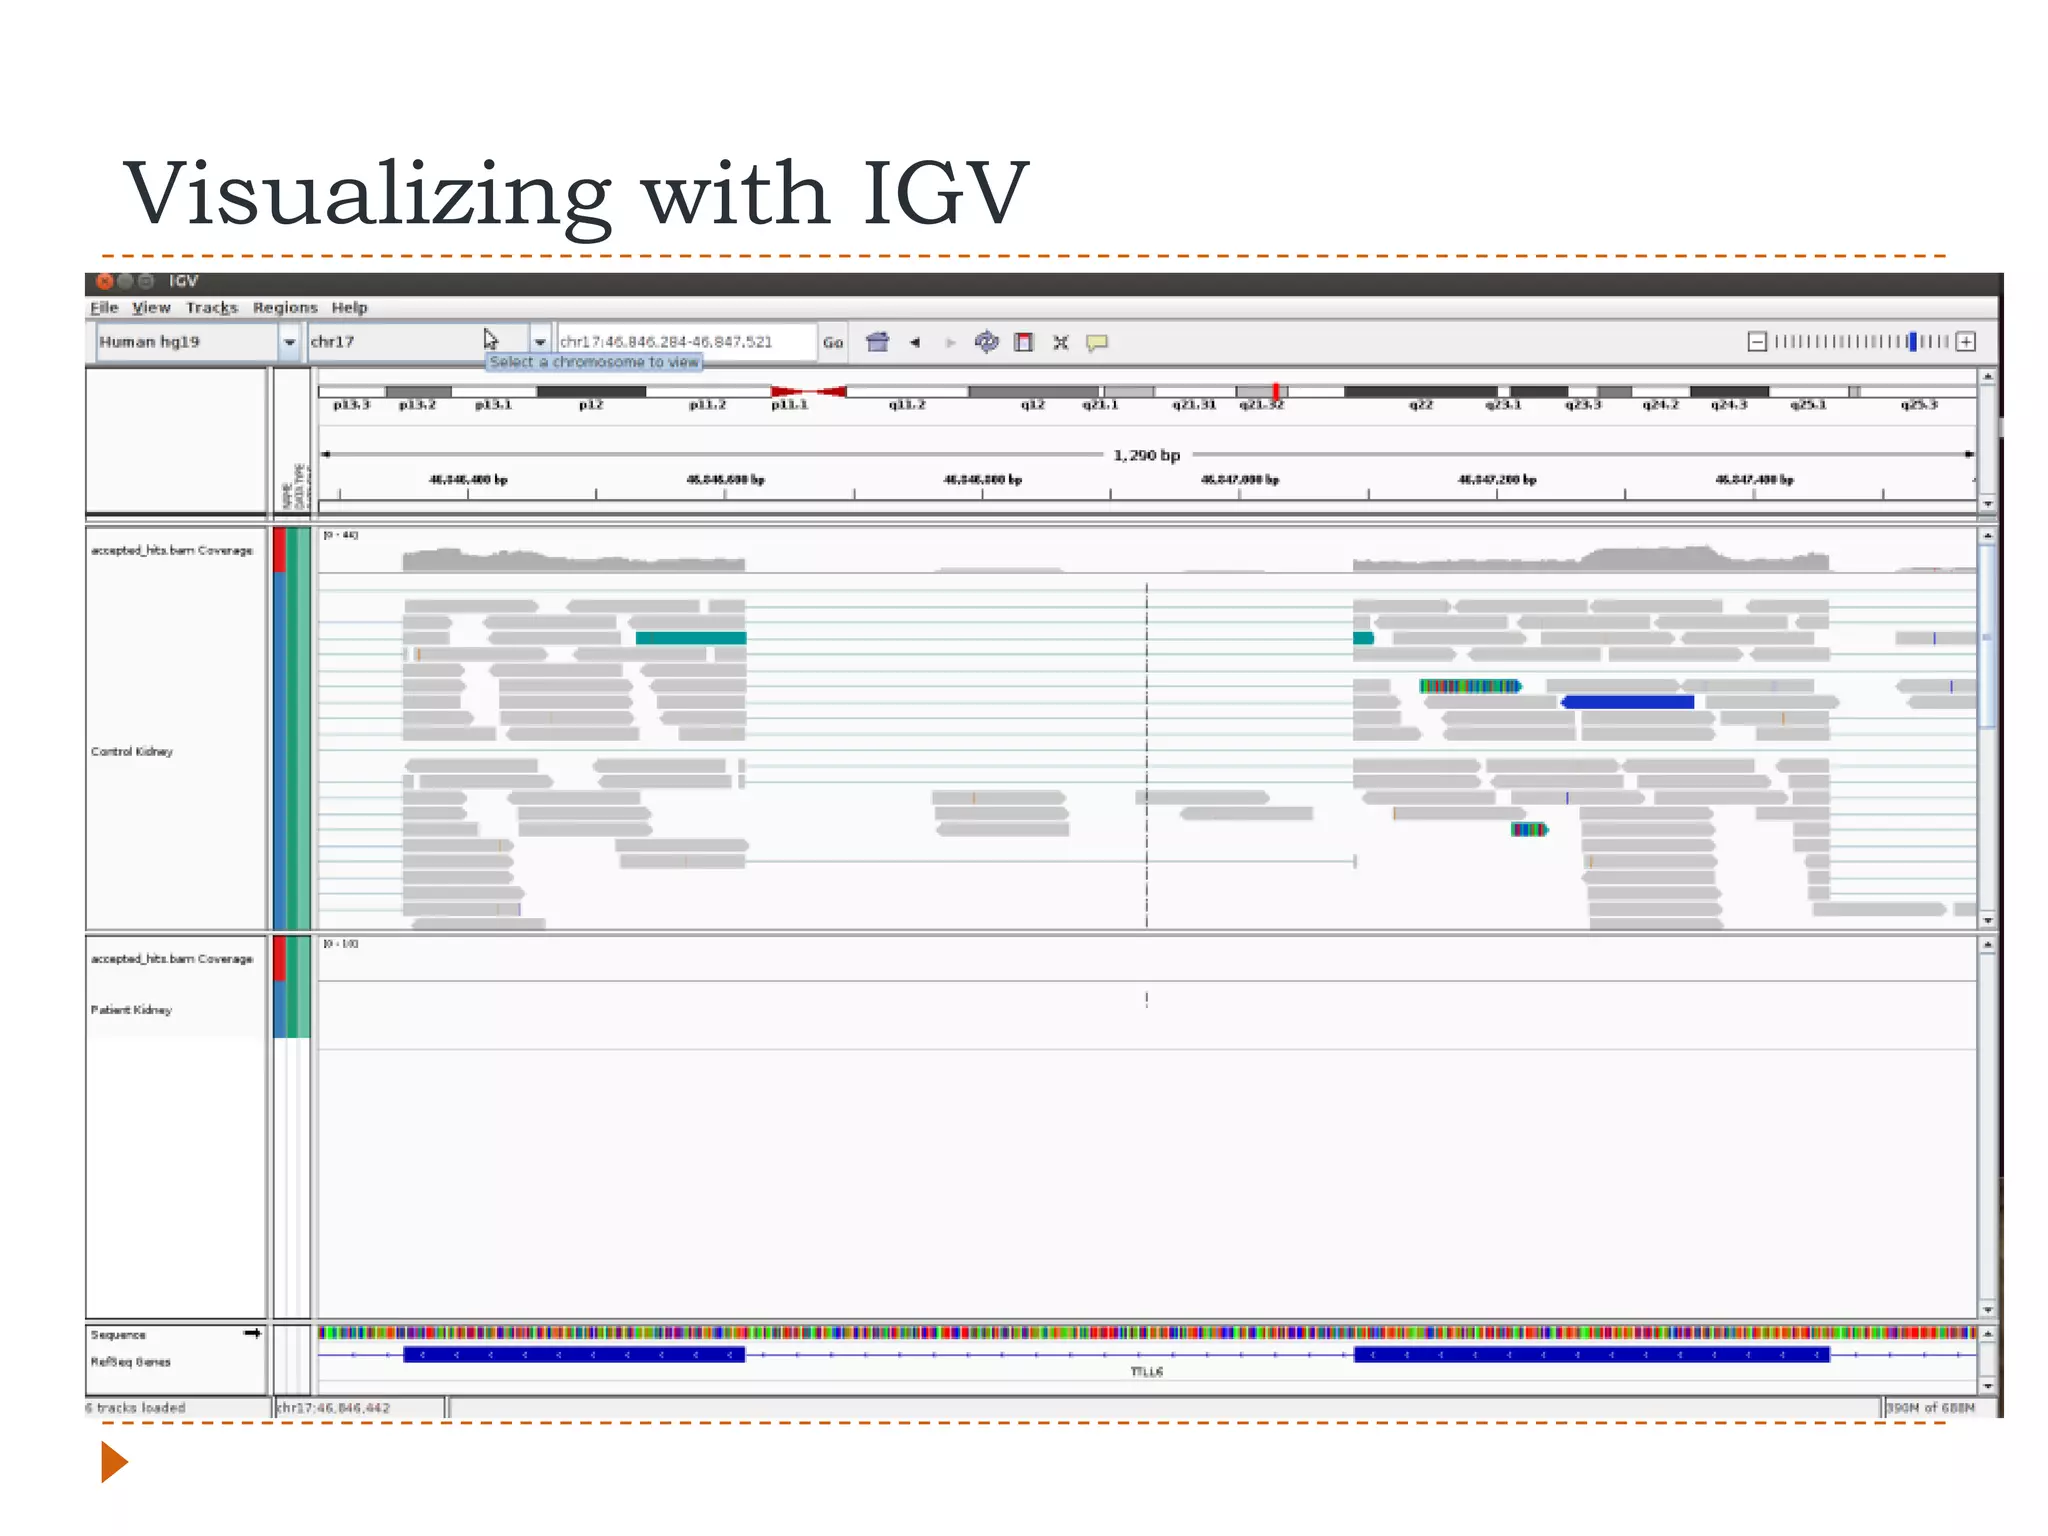
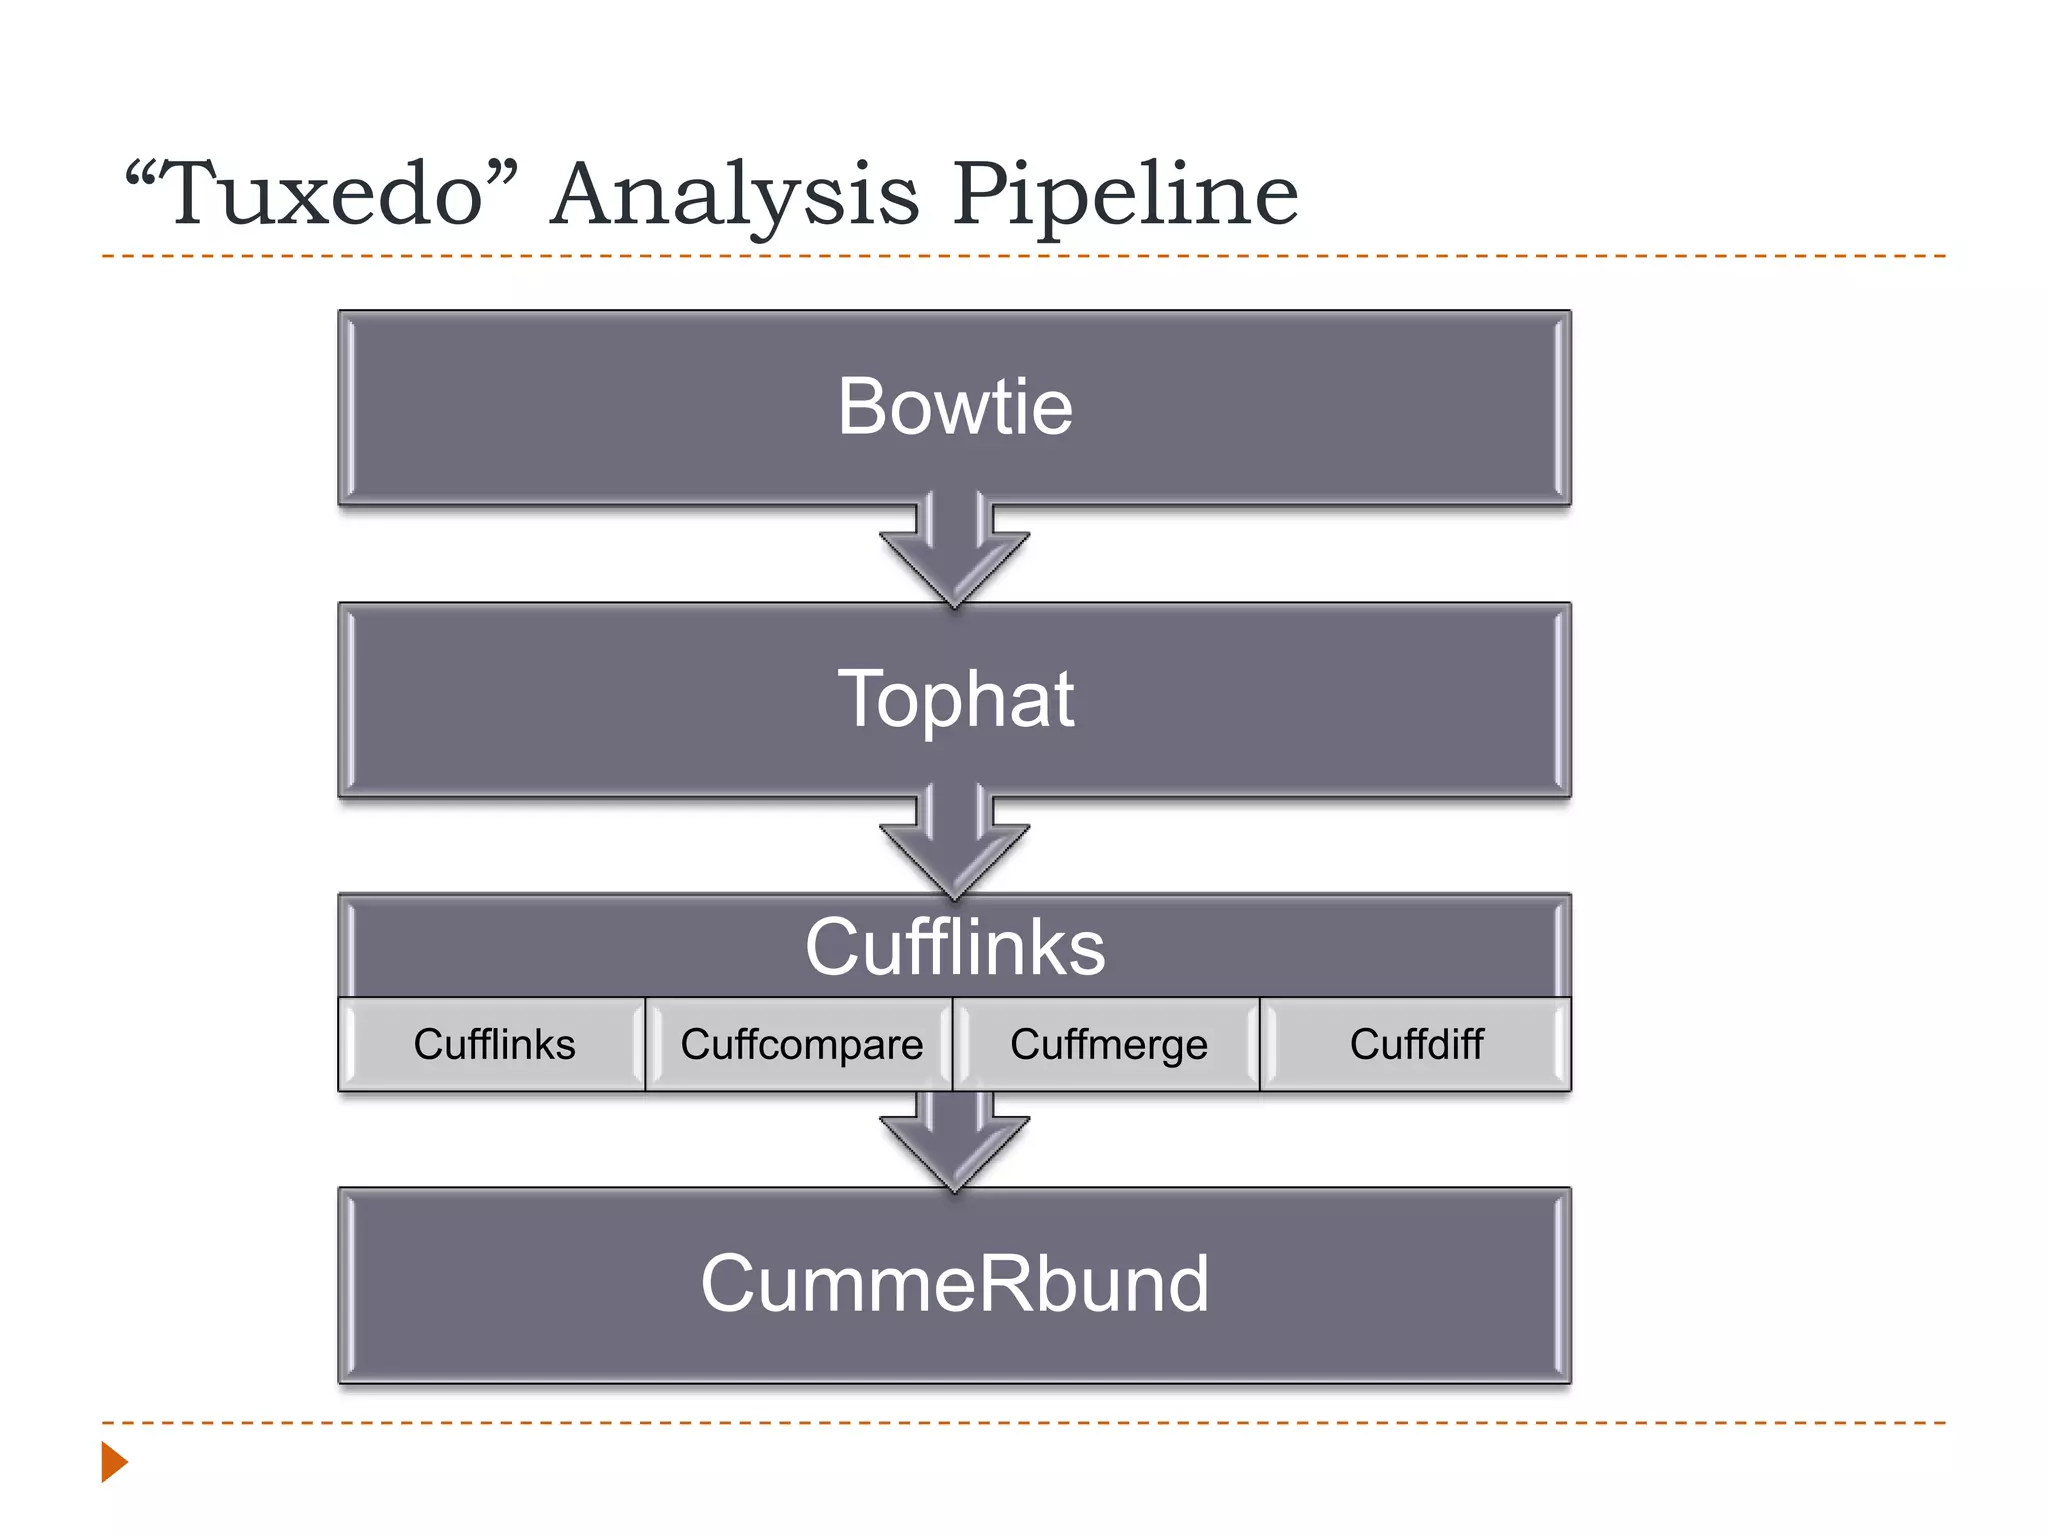
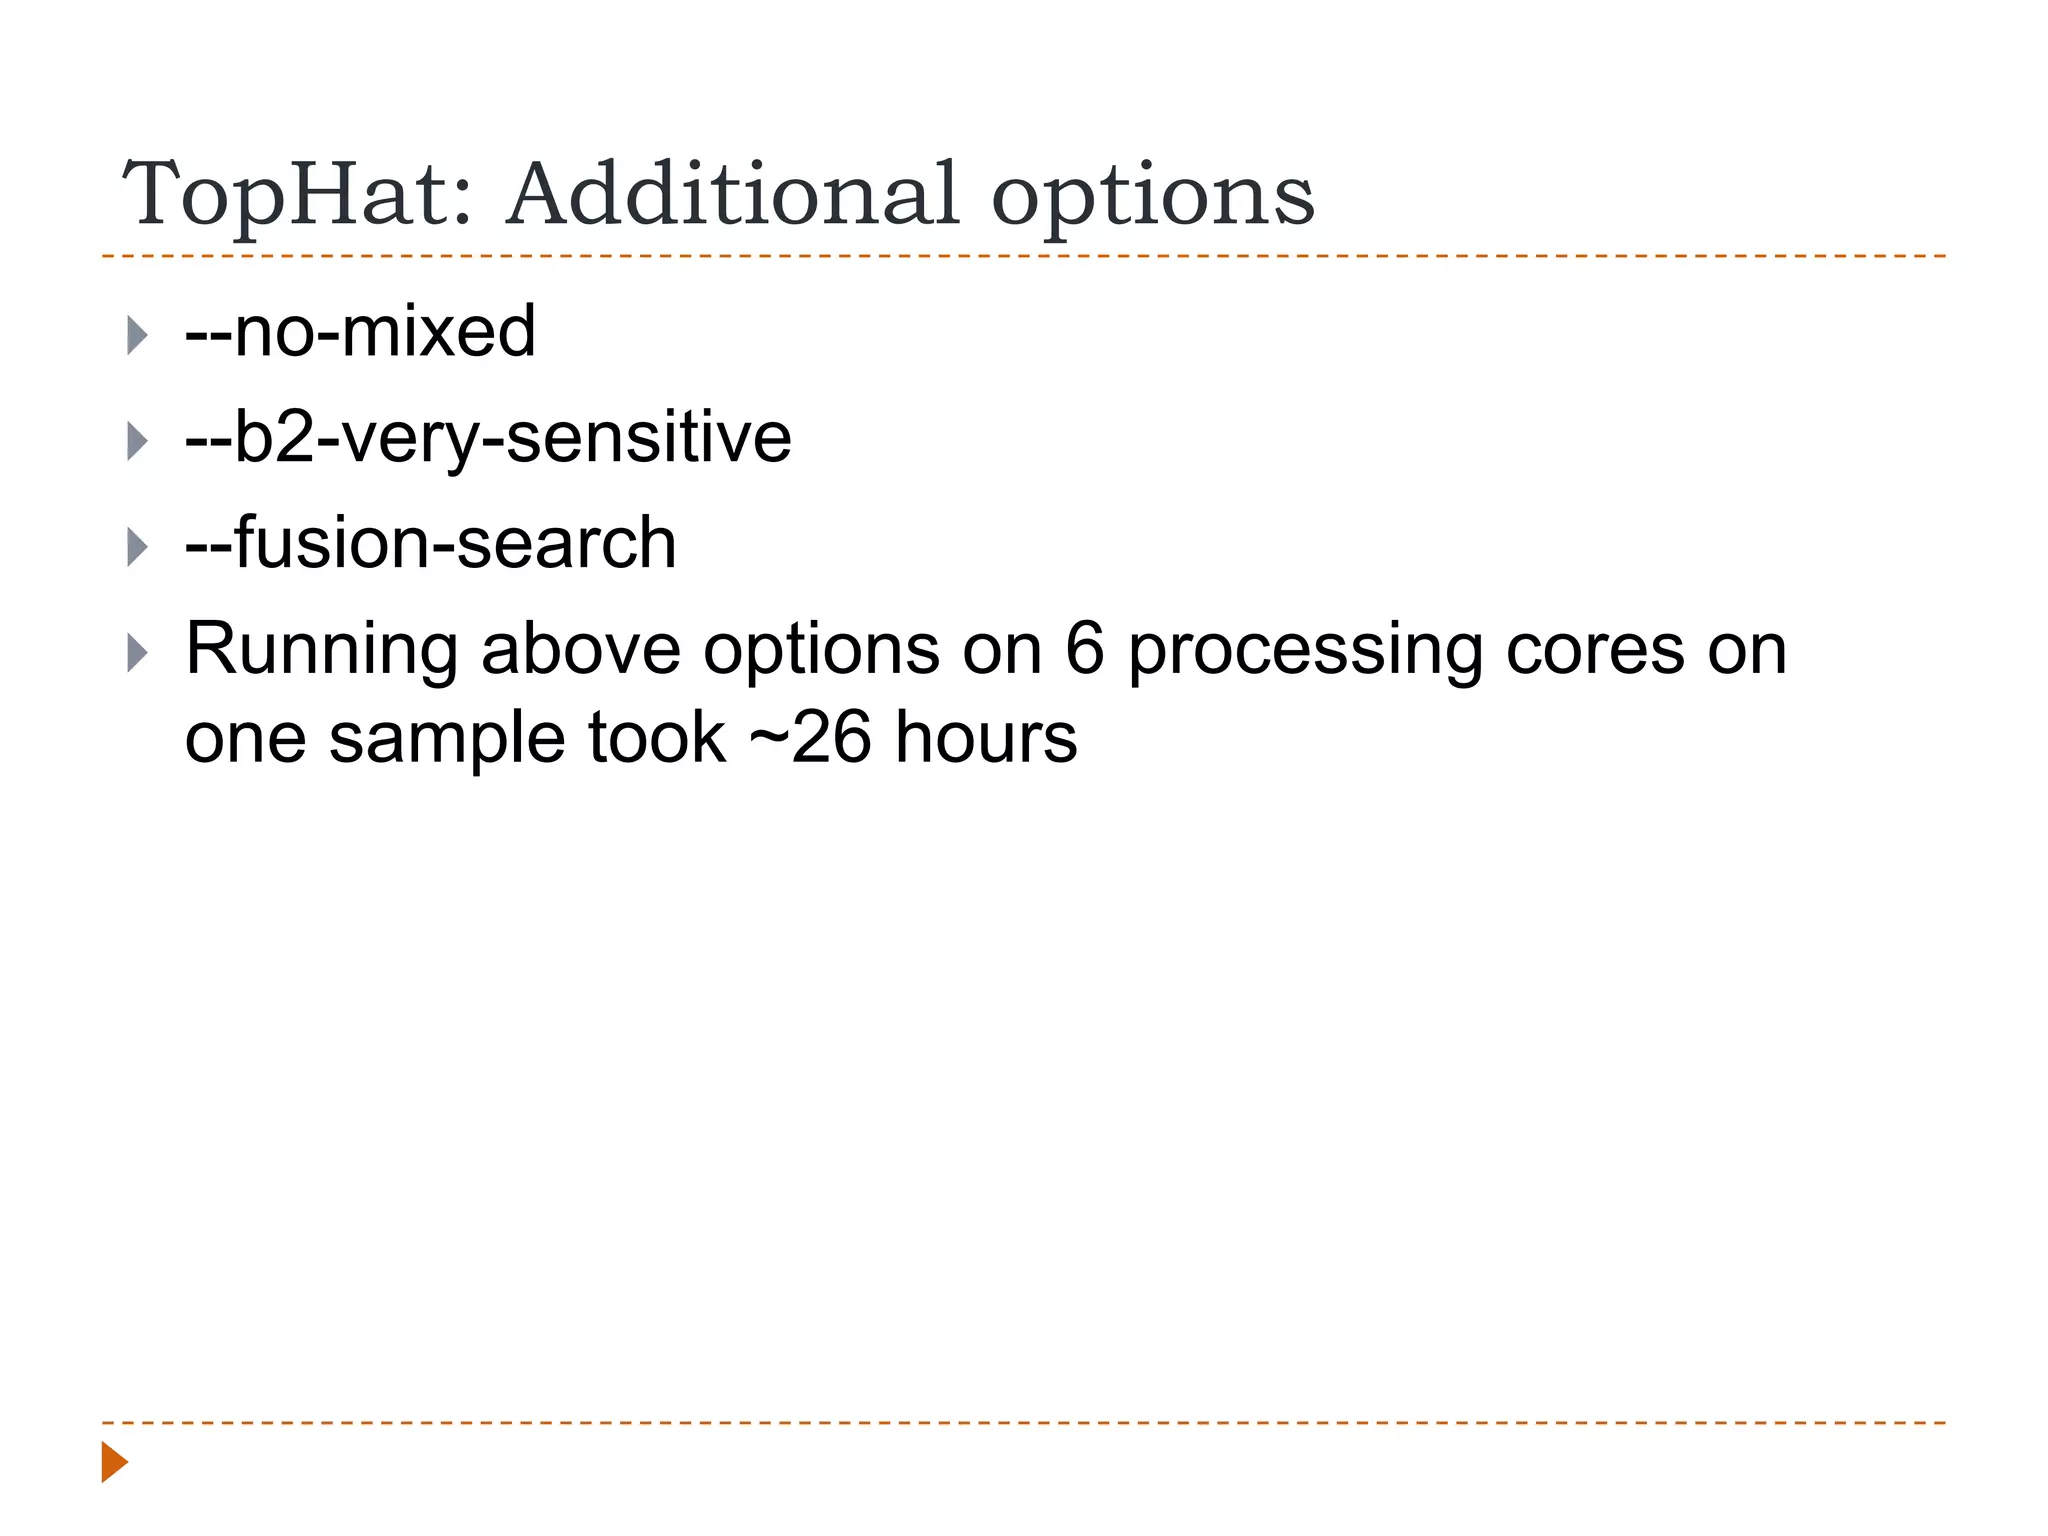
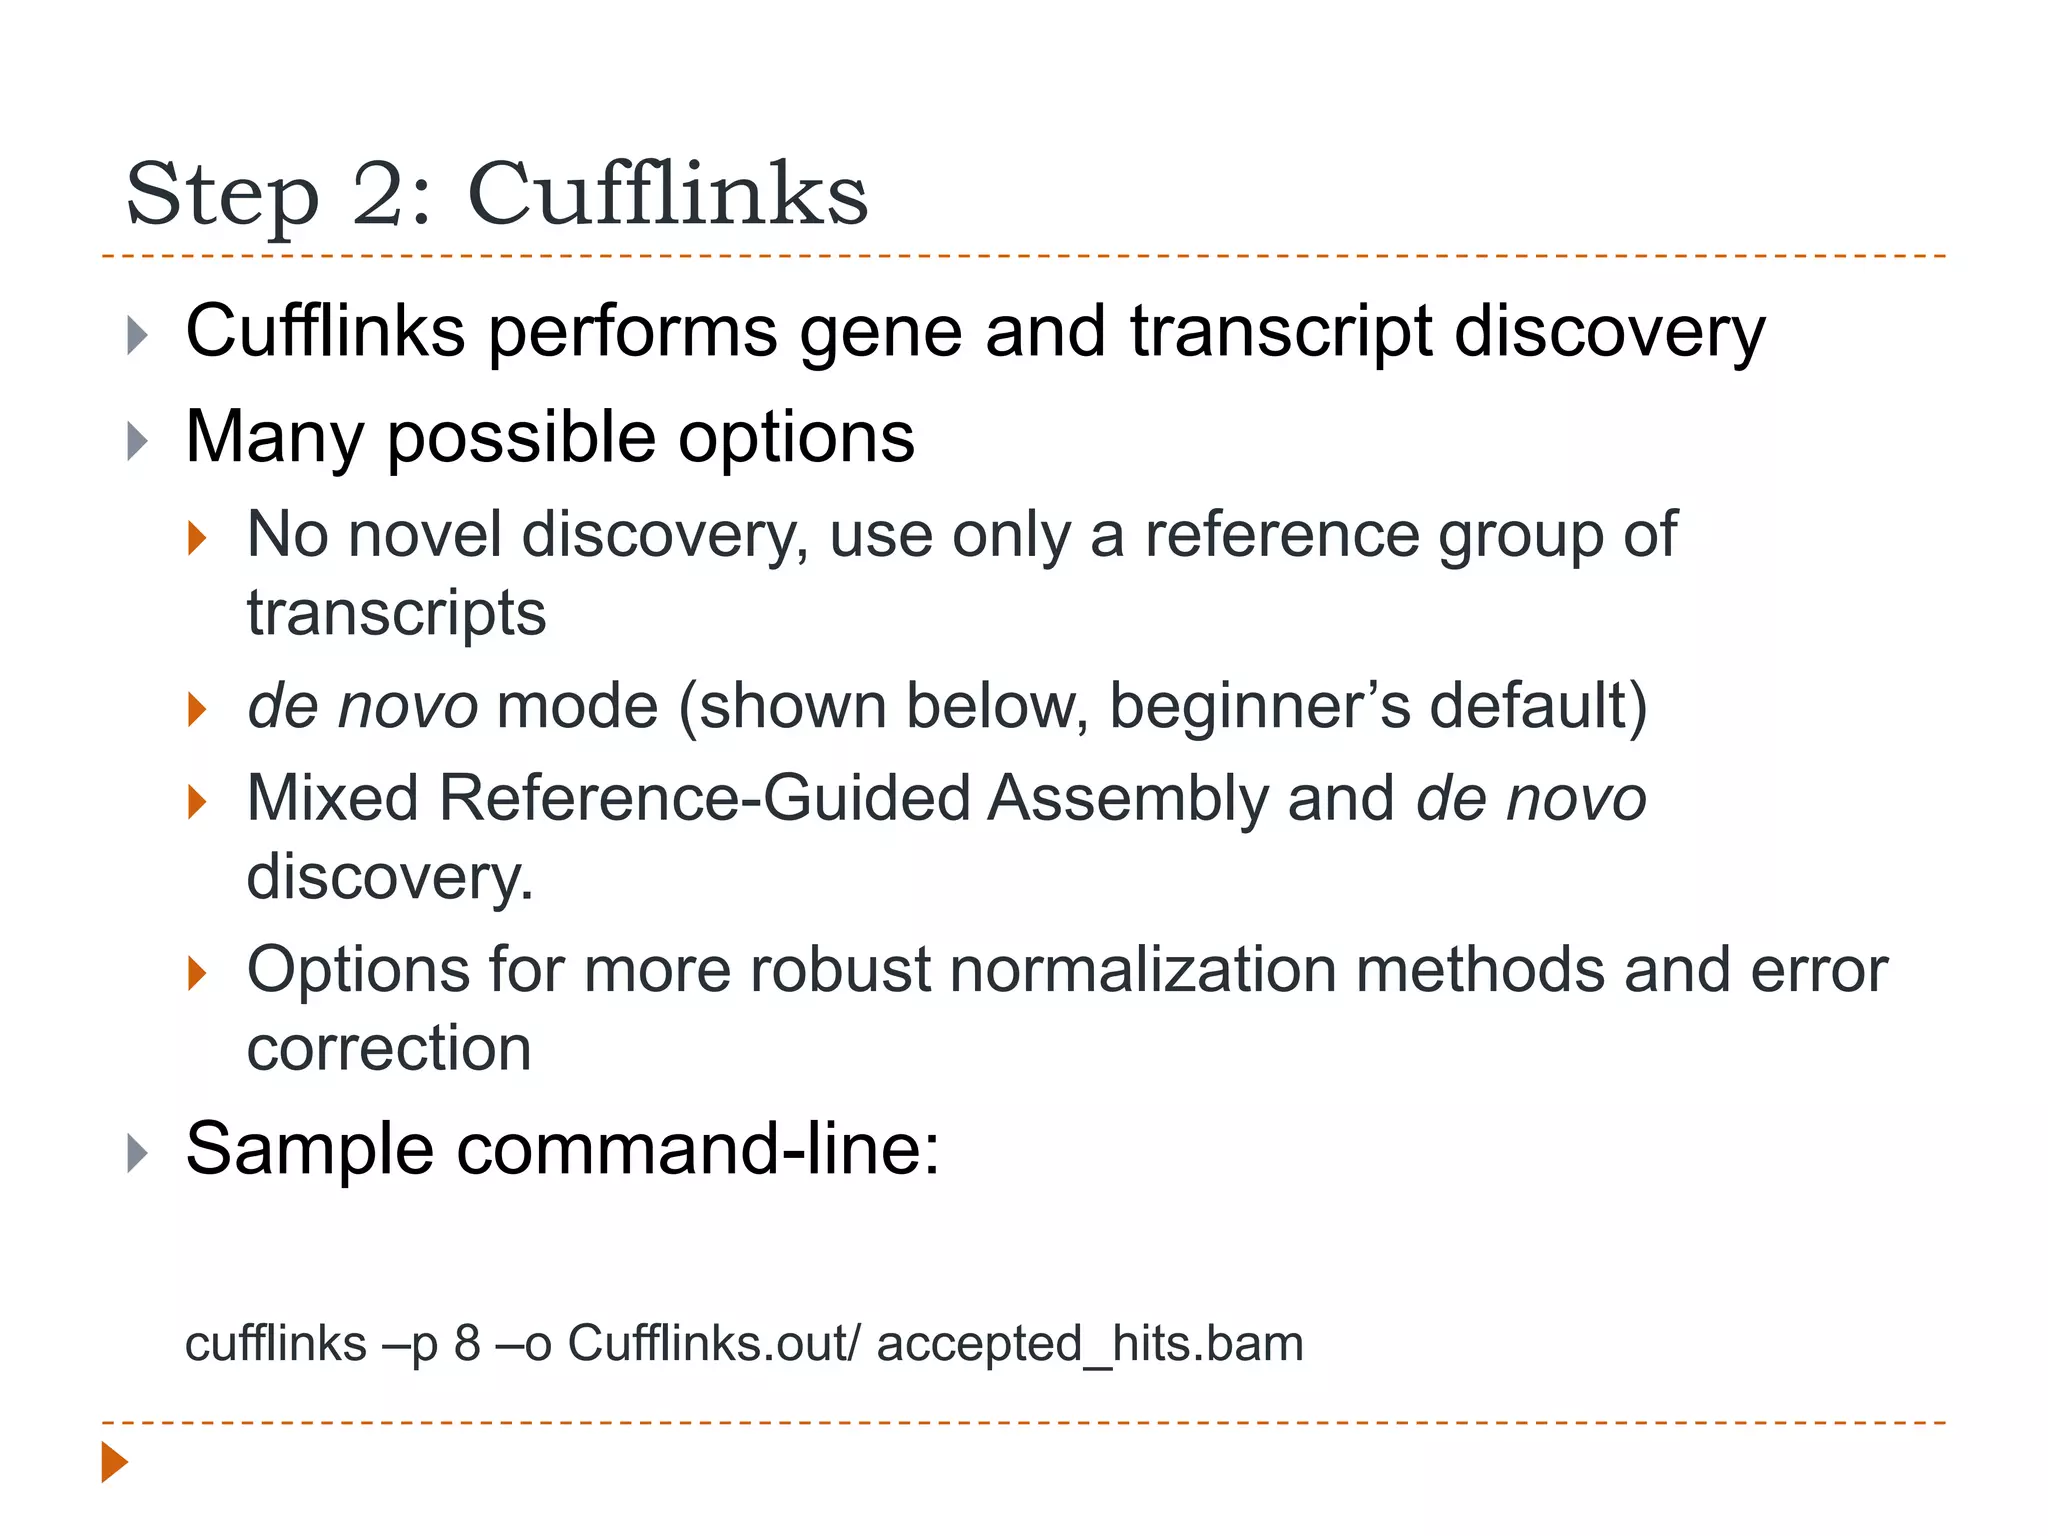
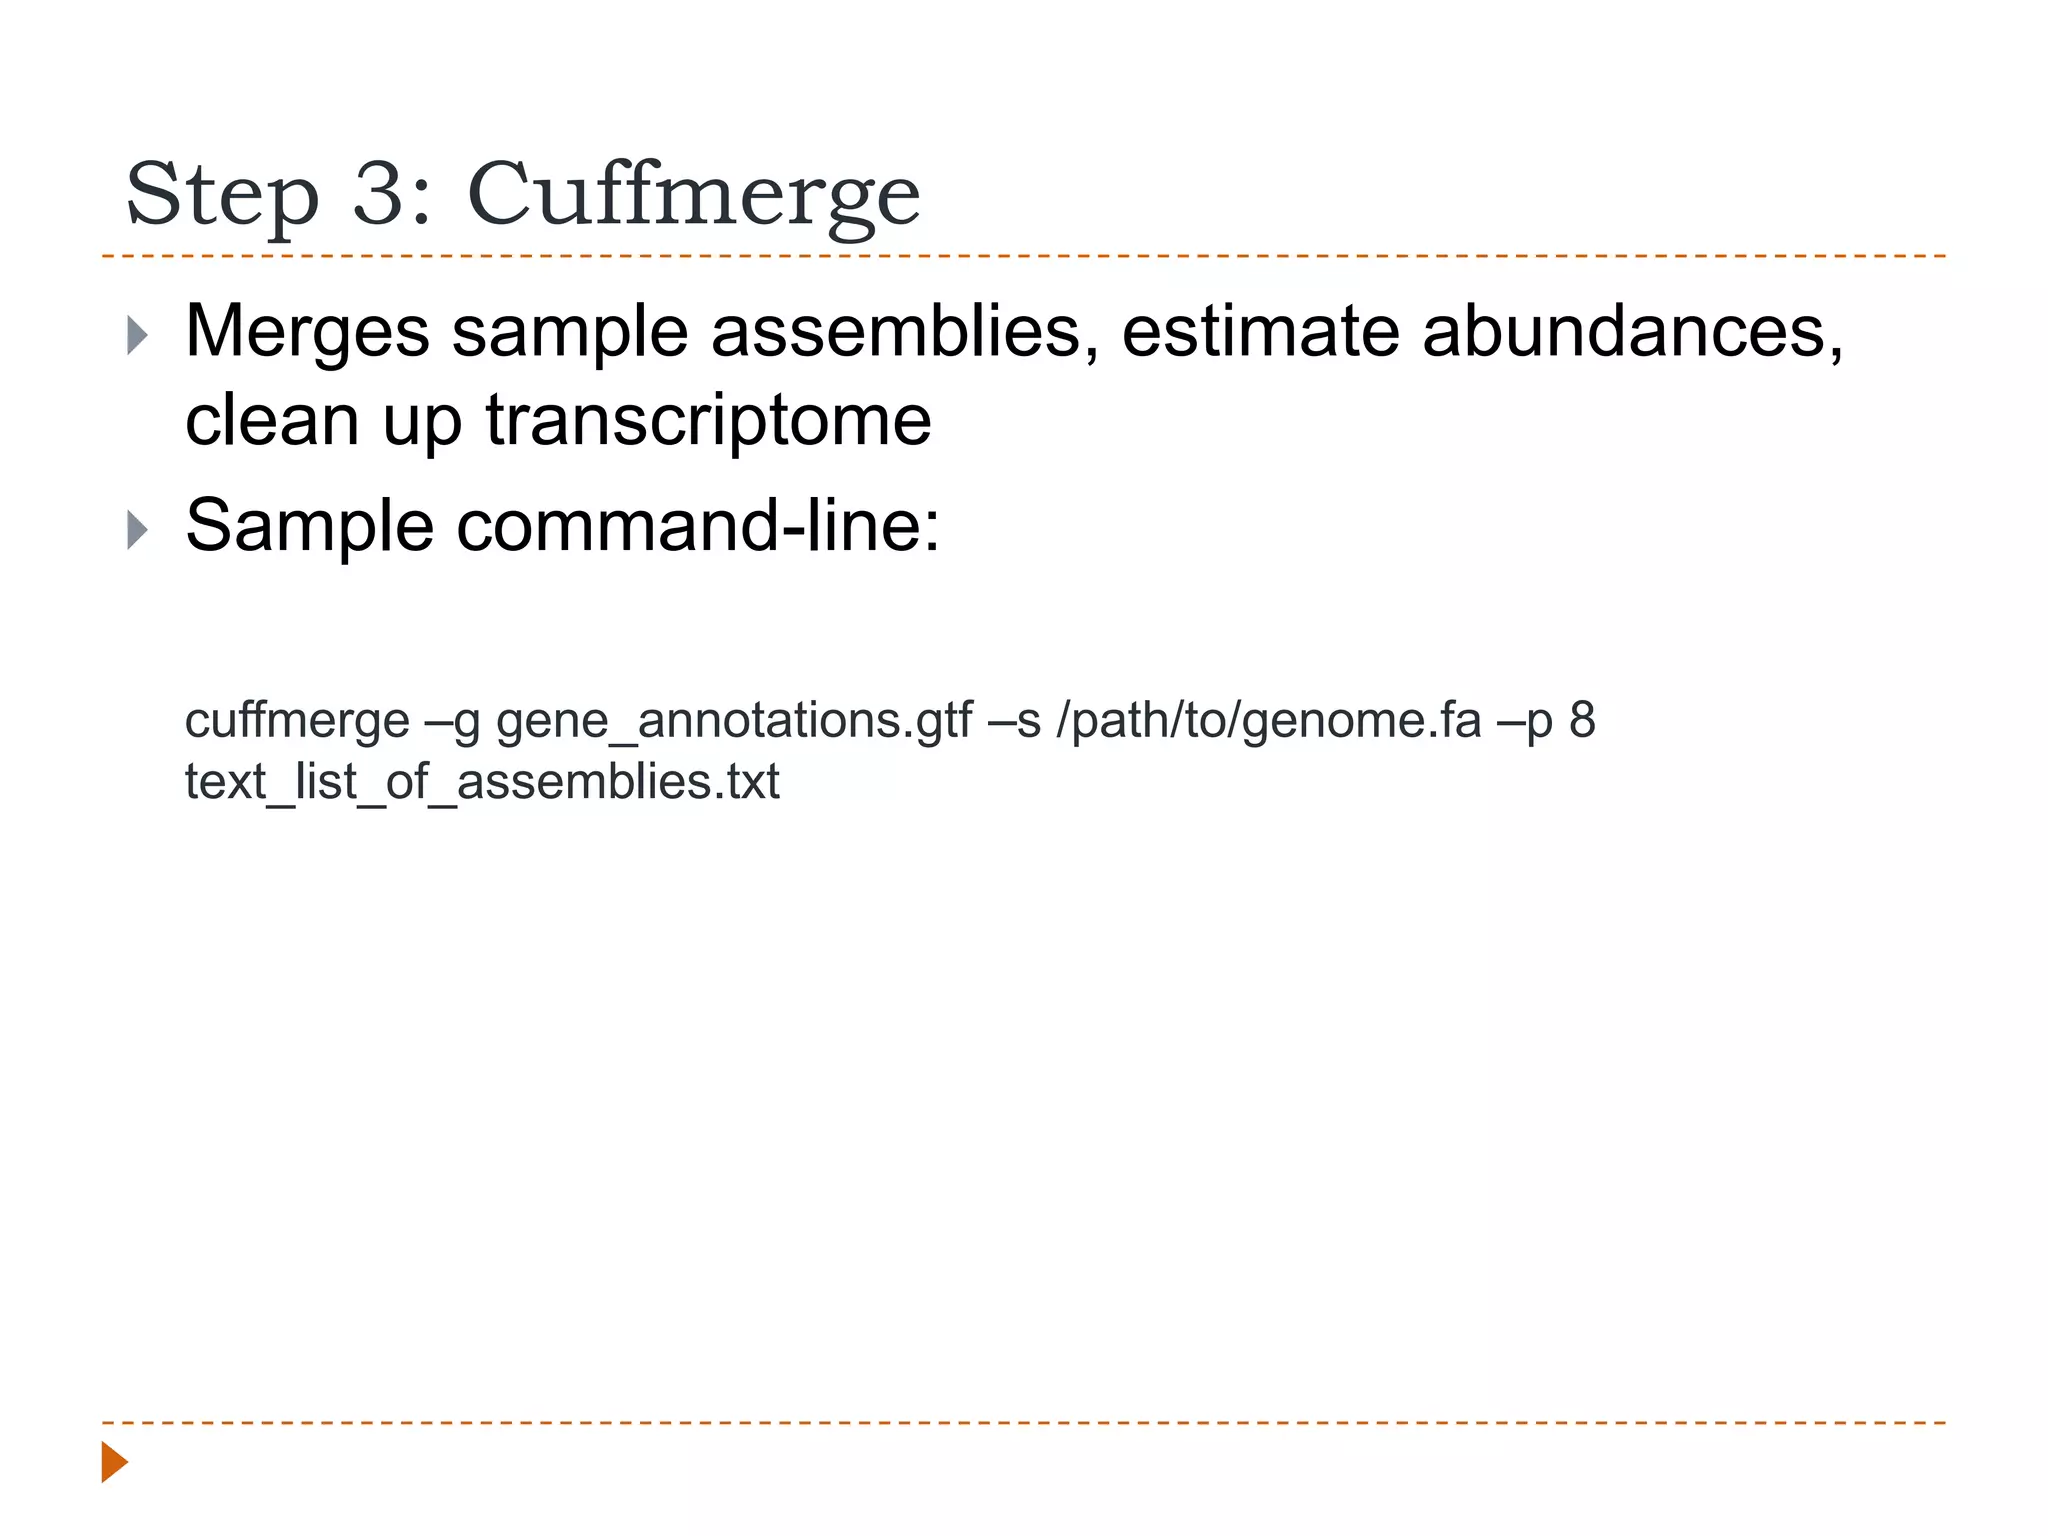
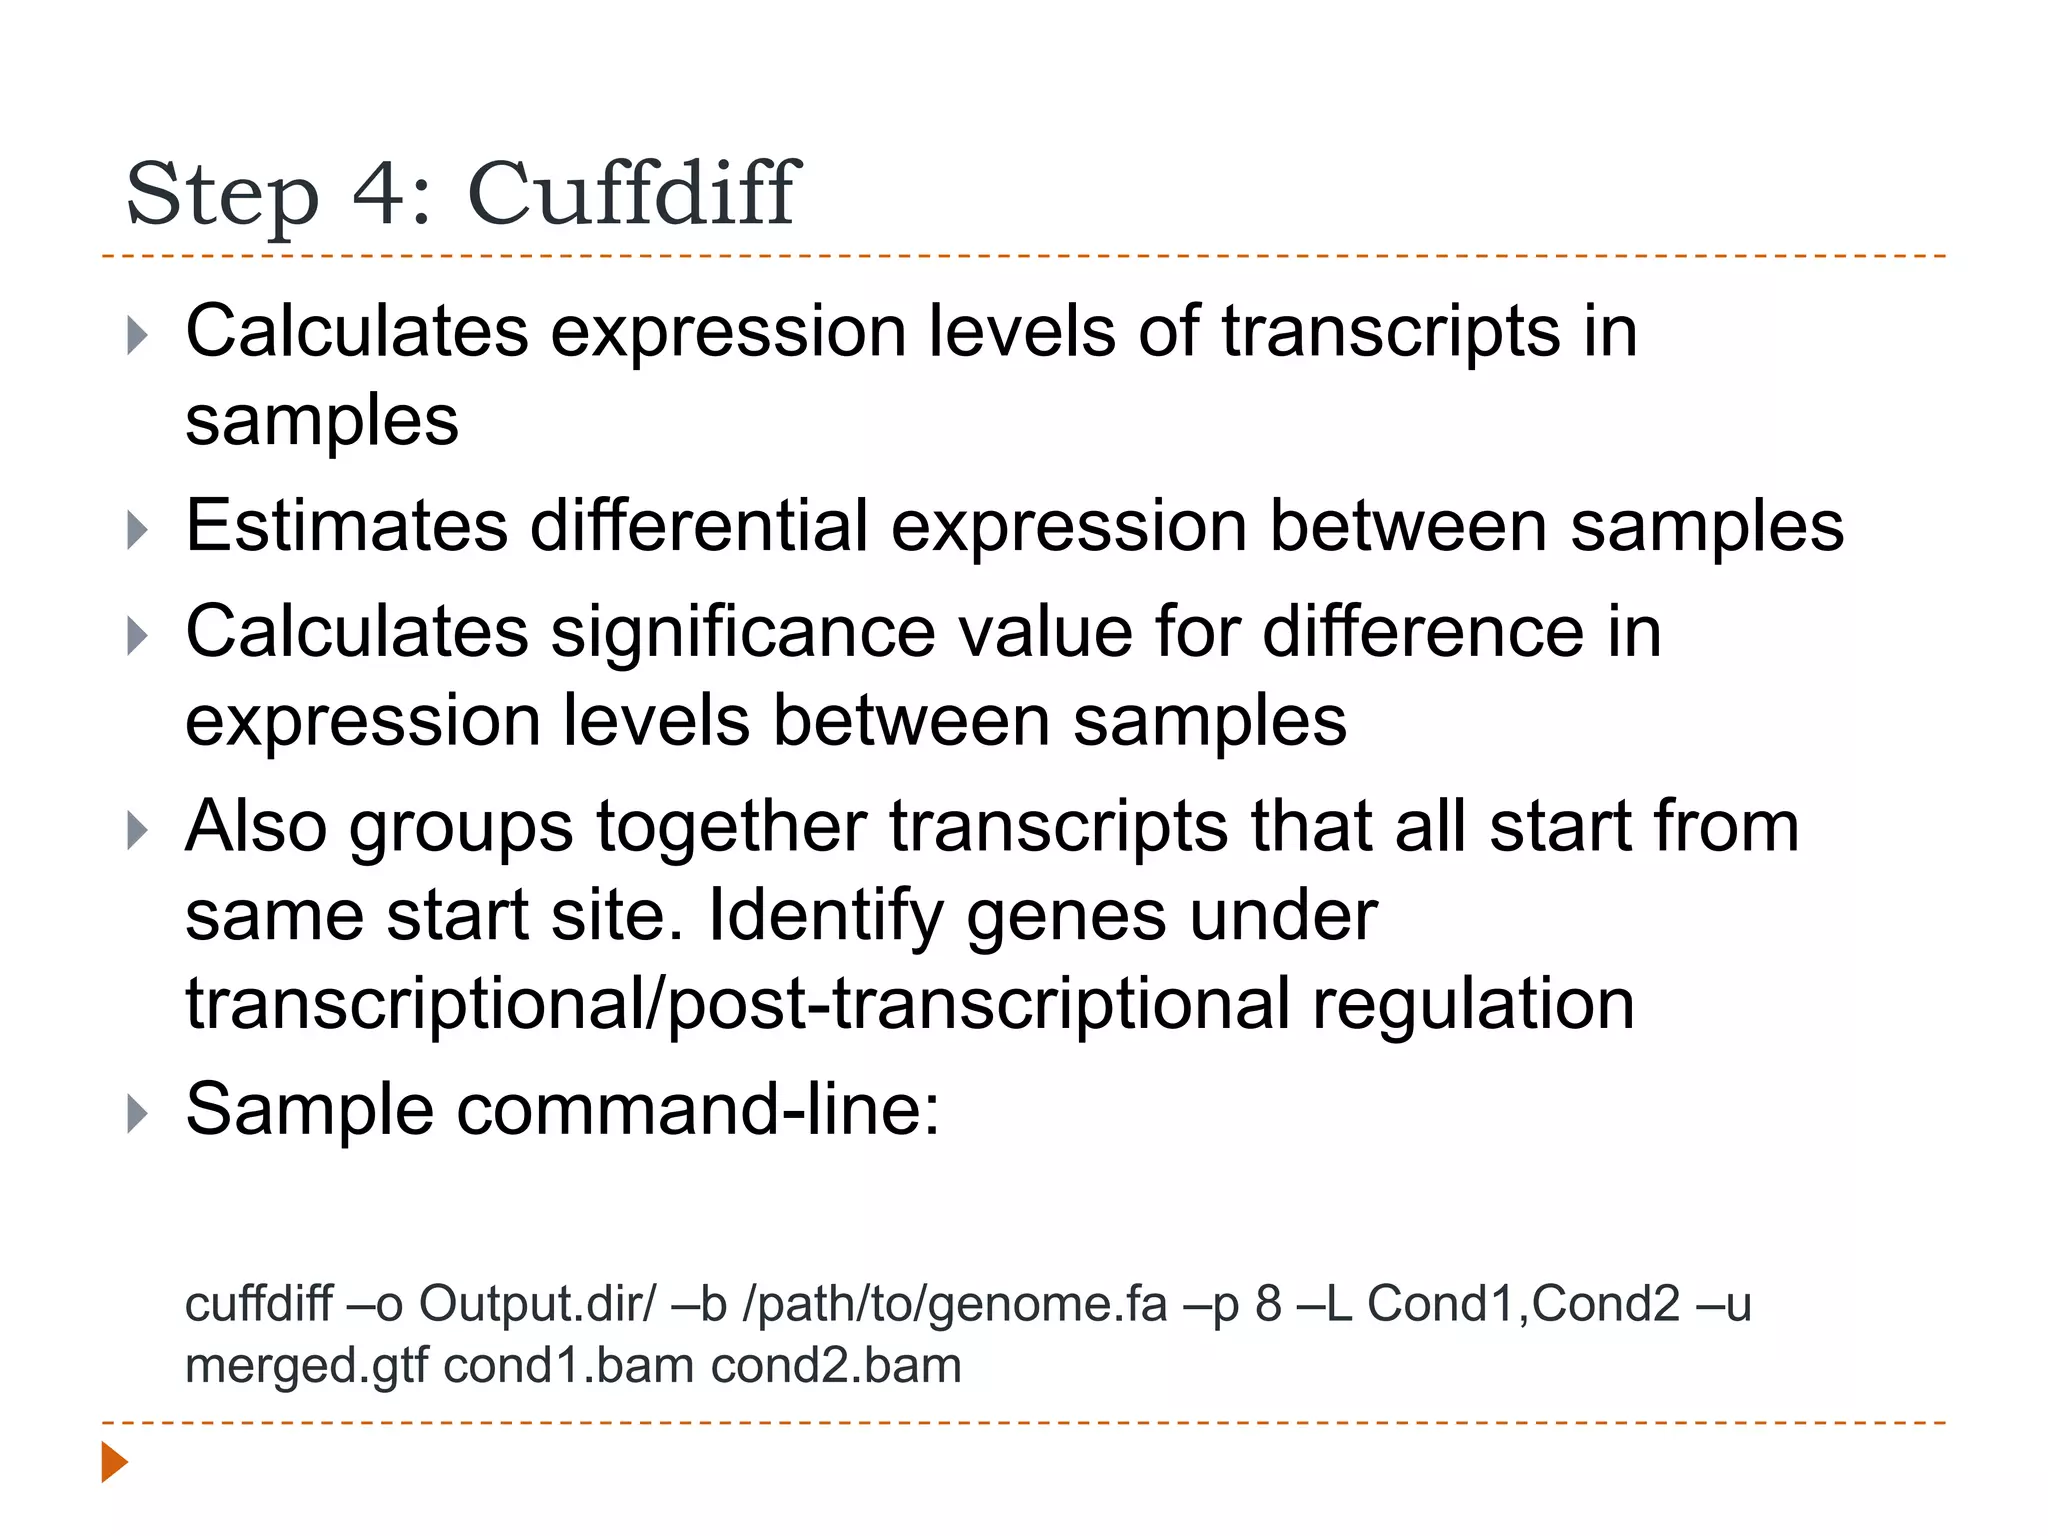
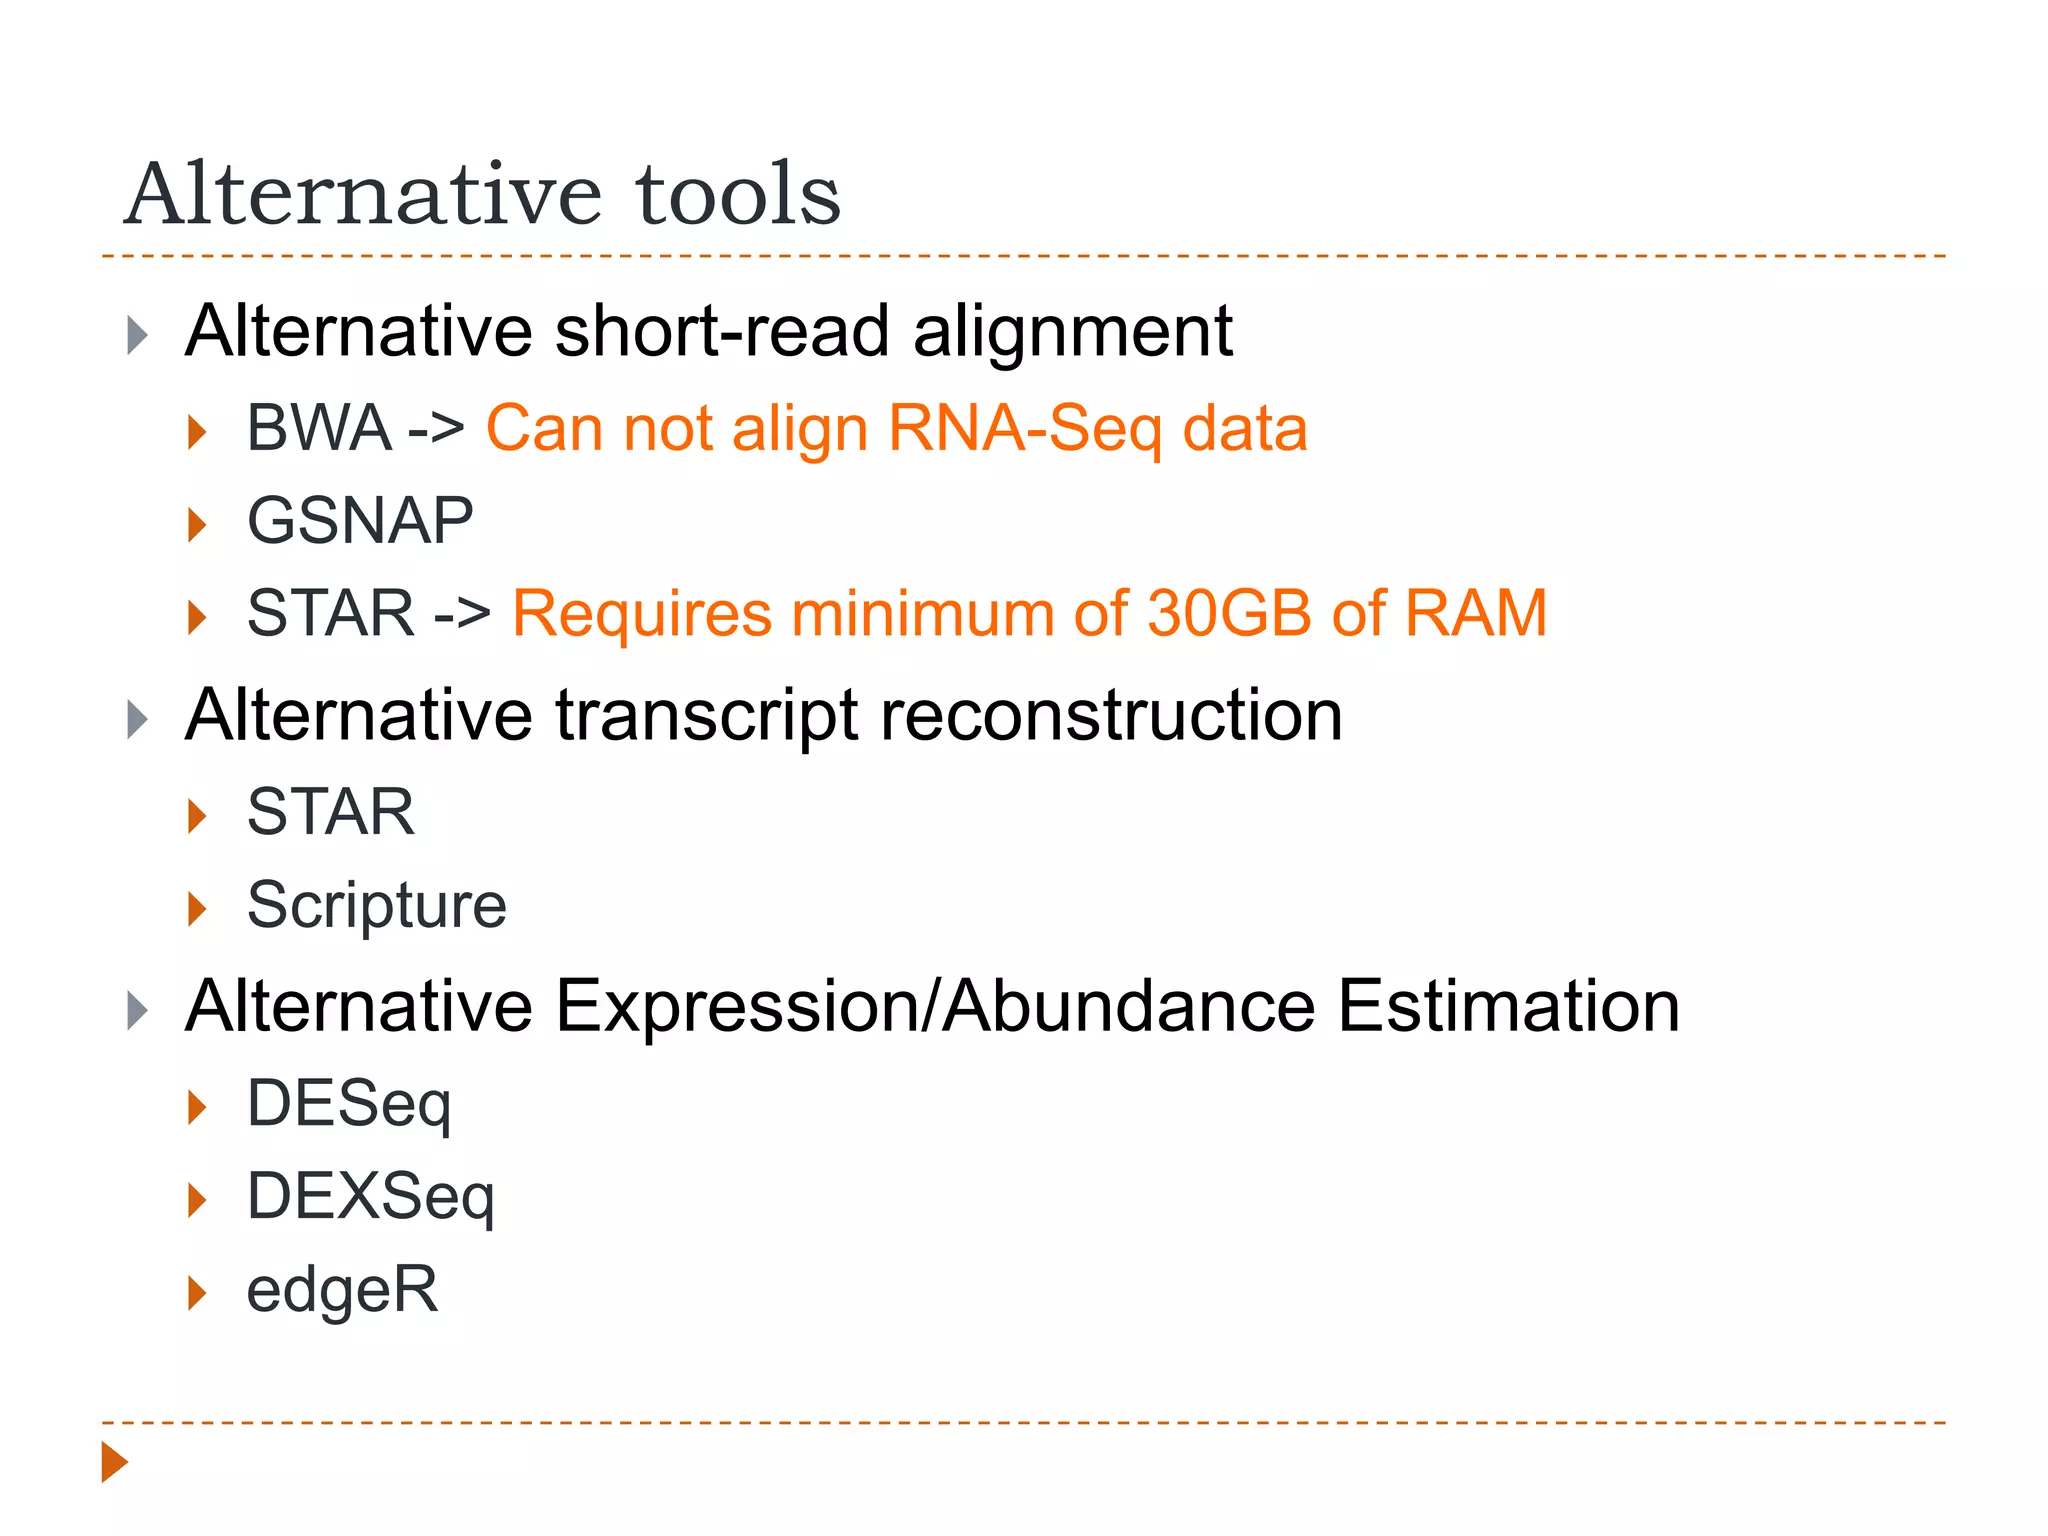
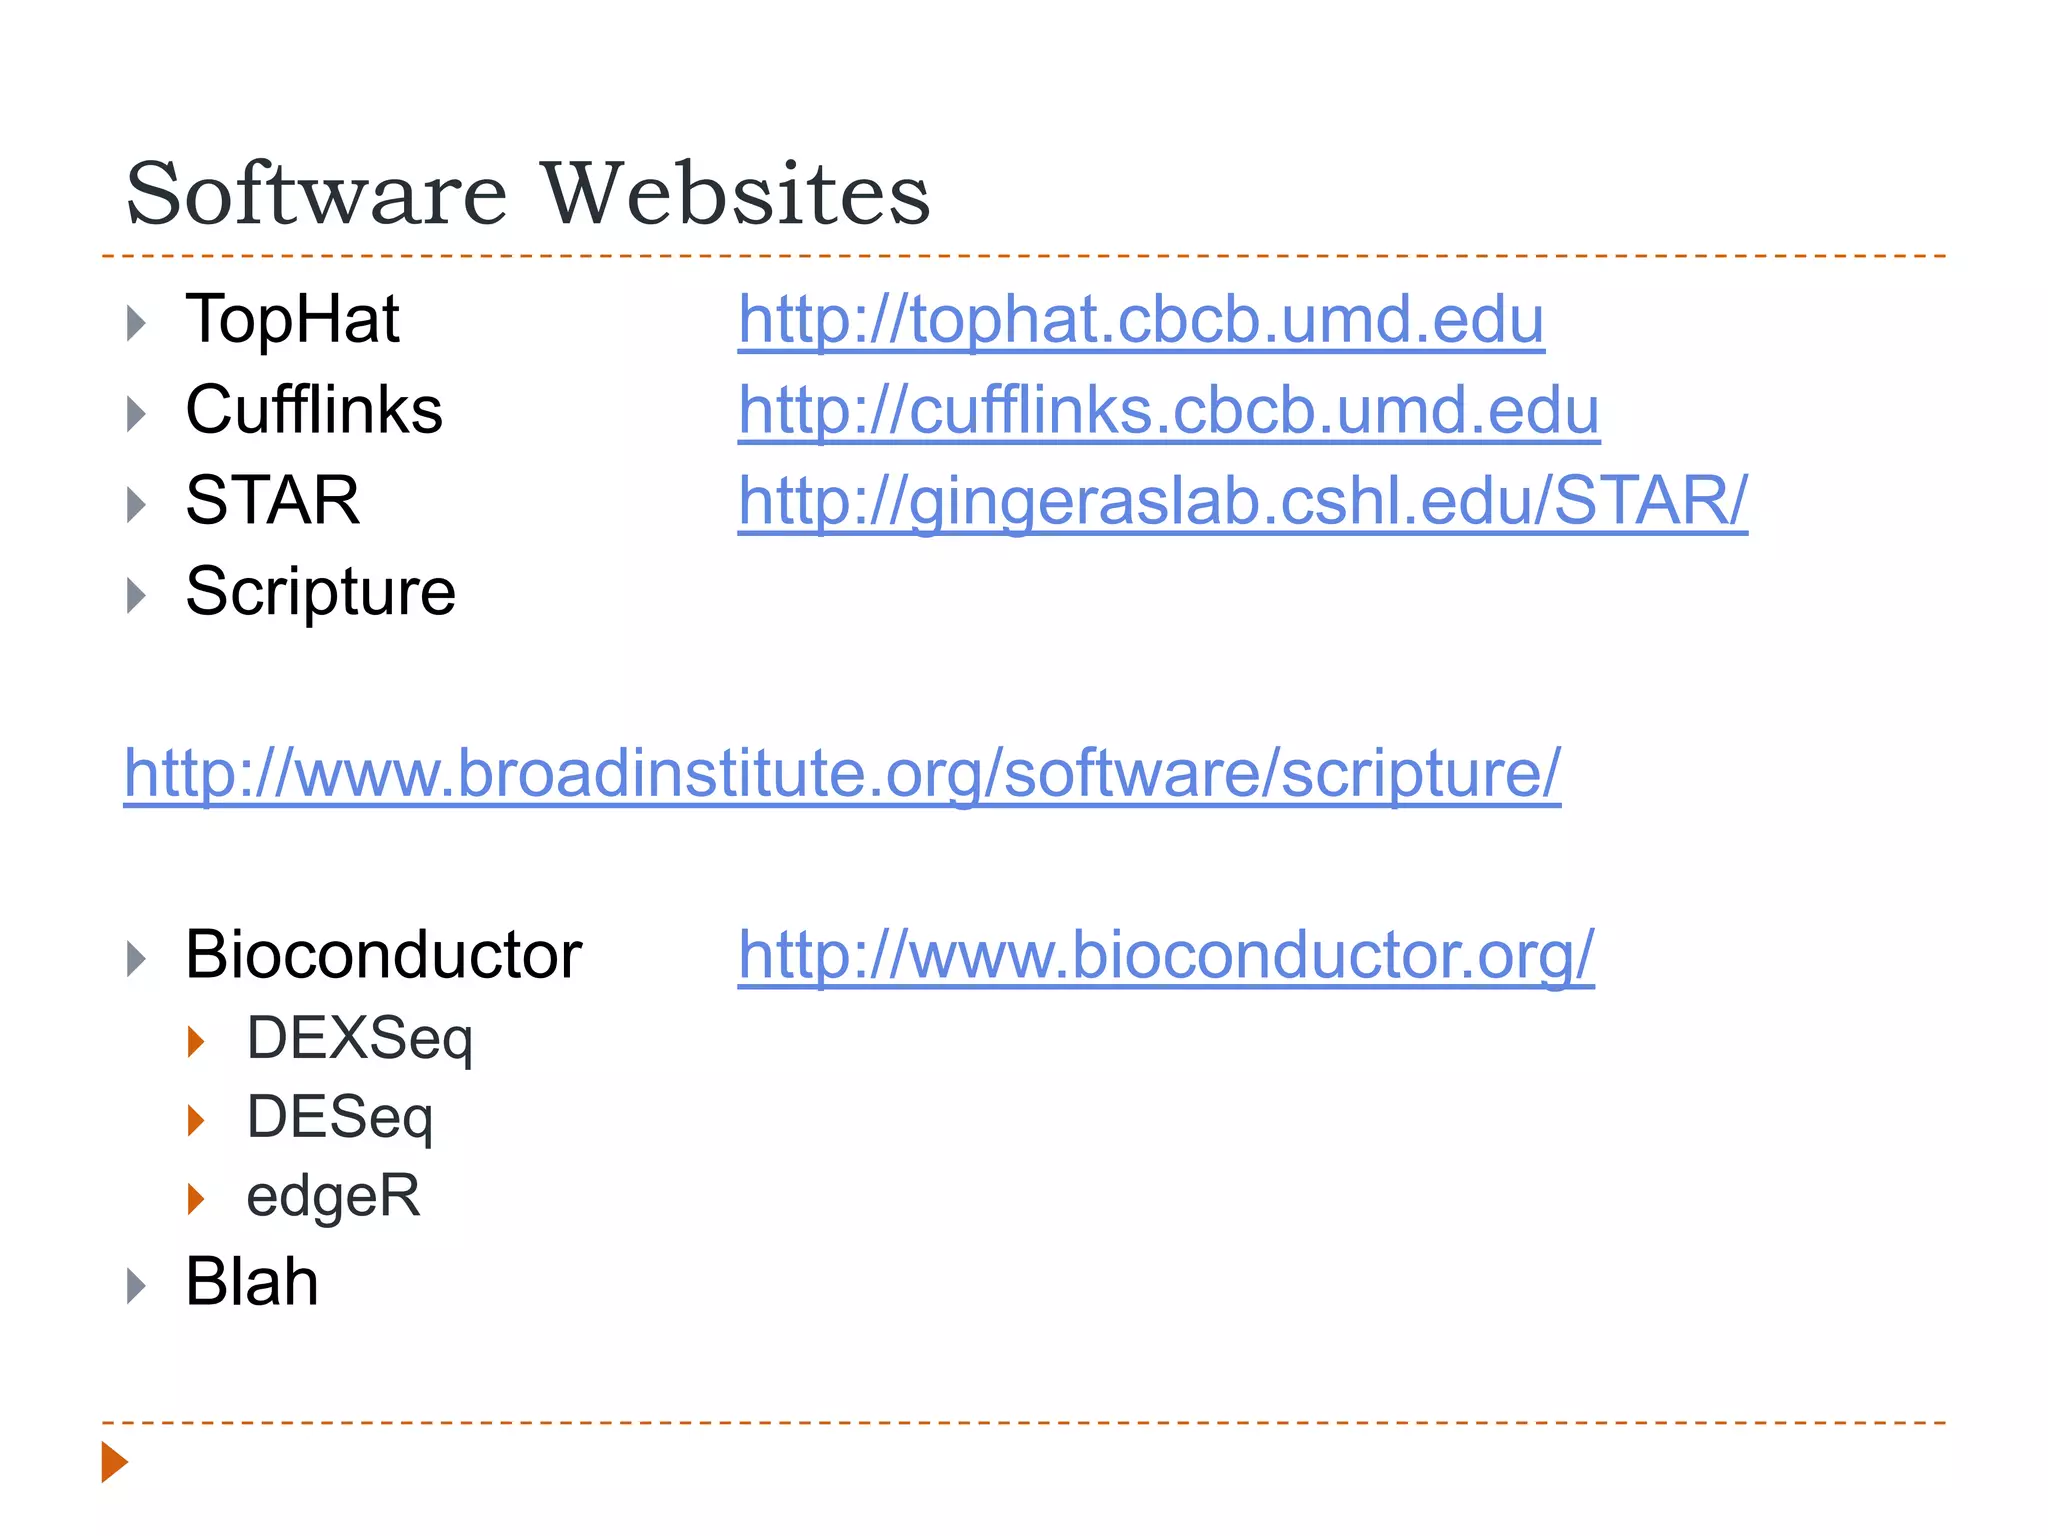
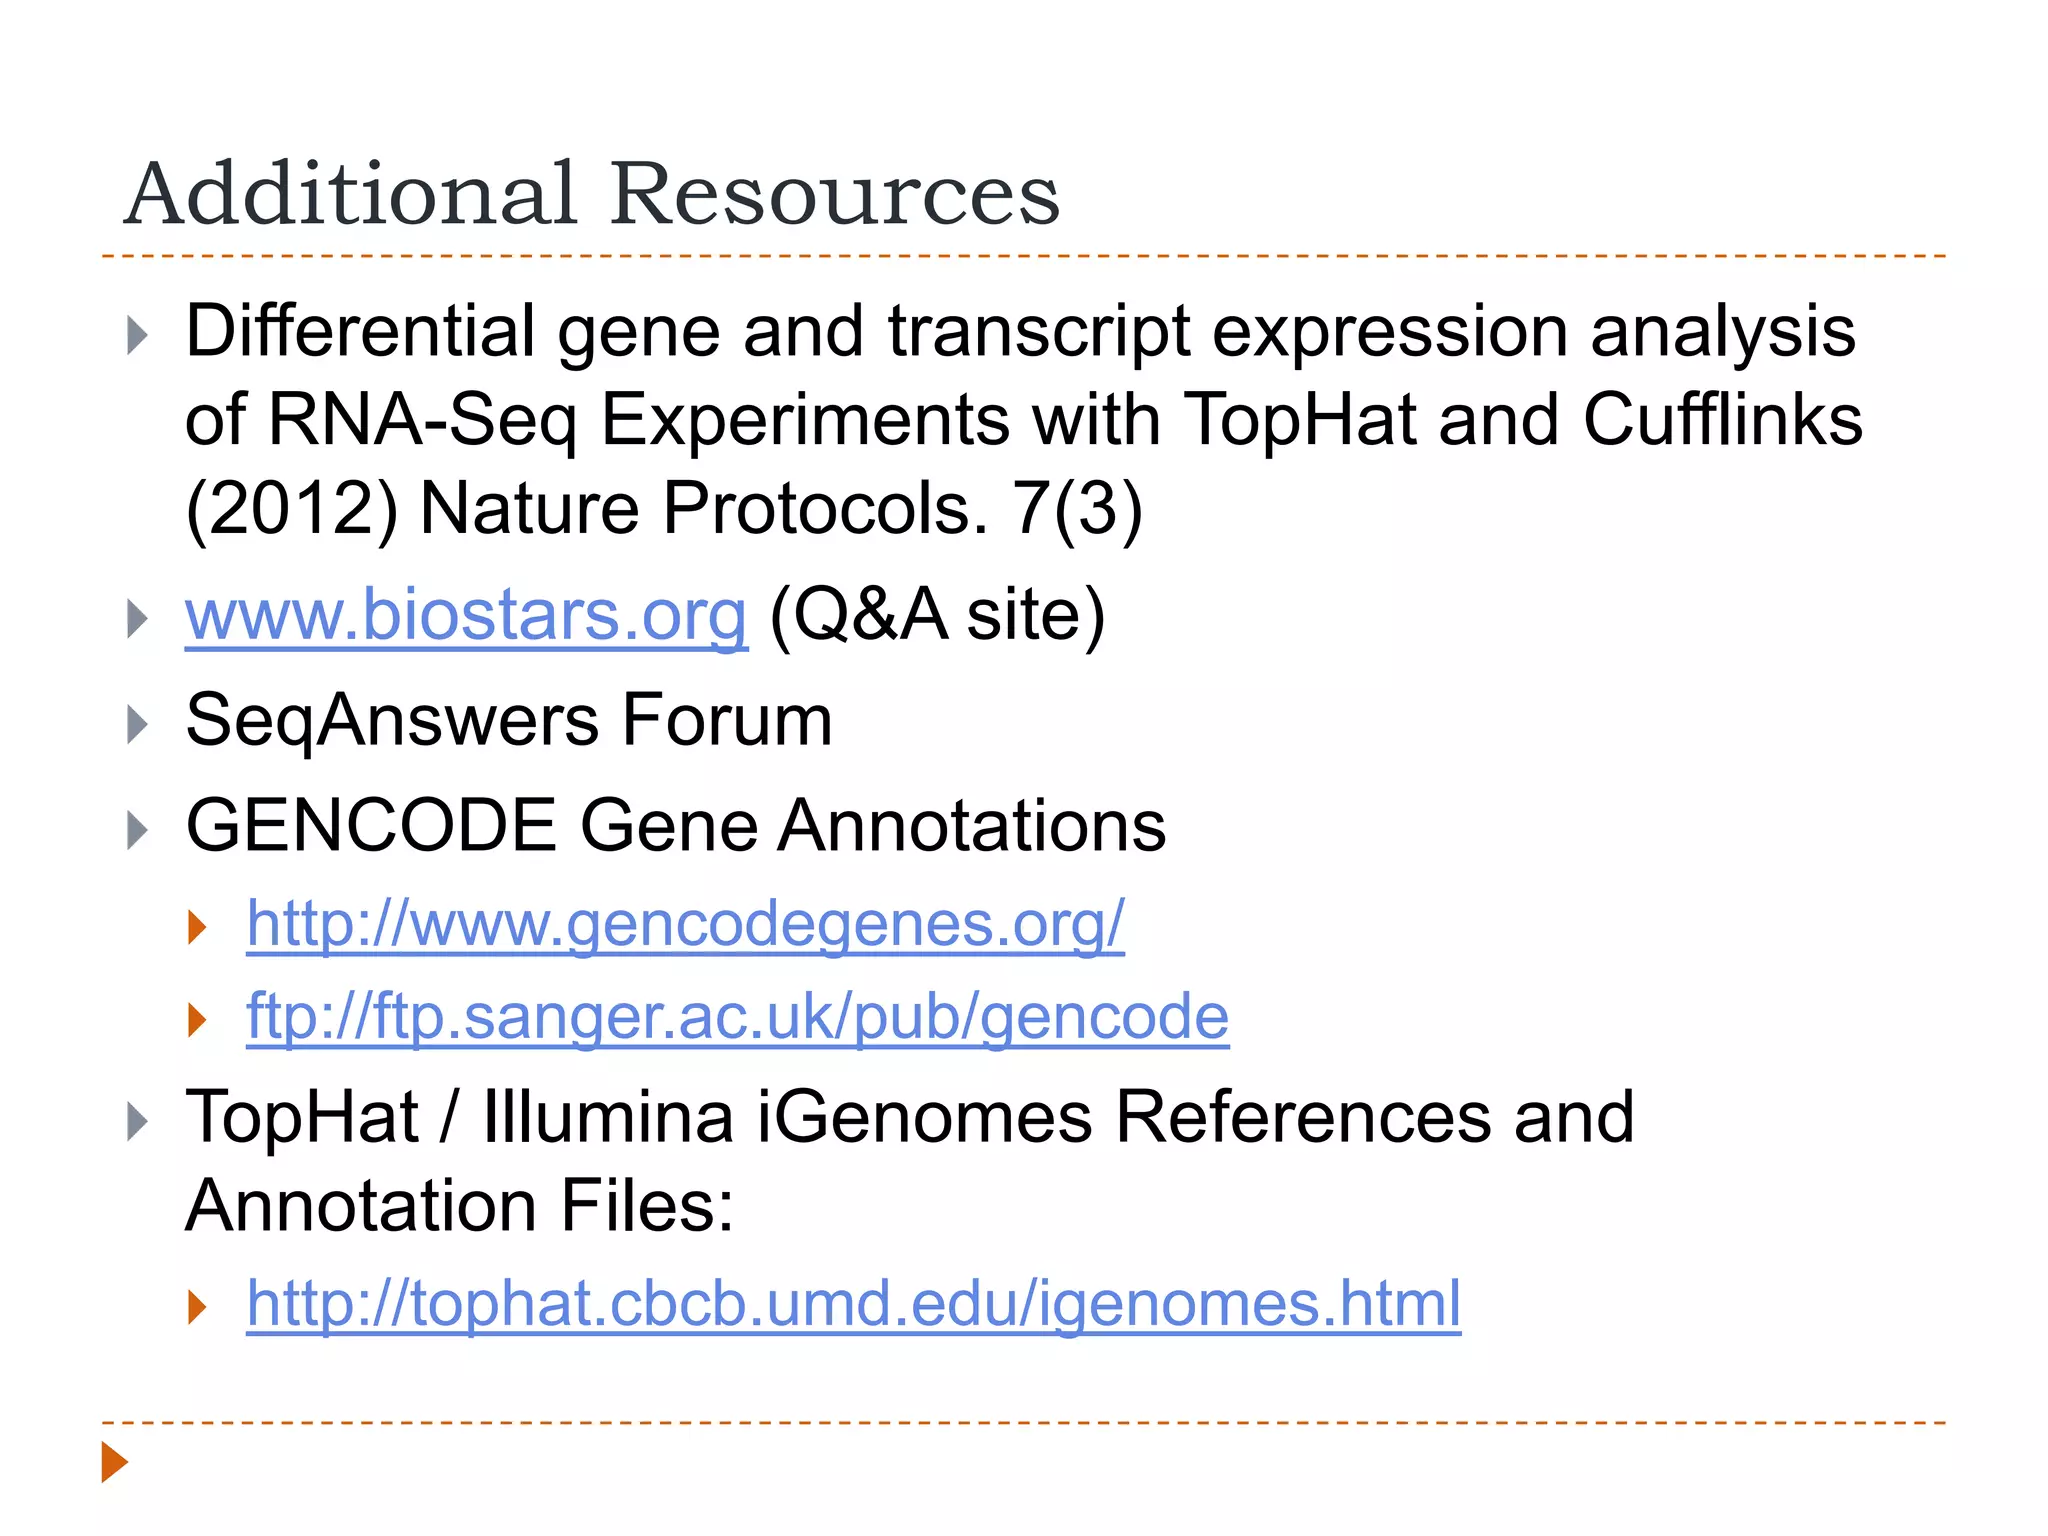
Bioinformatics: Intro to RNA-Seq
                         Analysis

                   Integrated Learning Session
                           Daniel Gaston, PhD
 Dr. Karen Bedard Lab, Department of Pathology

                           December 6th, 2012
Overview
   Introduction
       Considerations for RNA-Seq
       Computational Resources/Options
   Analysis of RNA-Seq Data
       Principle of analyzing RNA-Seq
       General RNA-Seq analysis pipeline
       “Tuxedo” pipeline
       Alternative tools
   Resources
       http://www.slideshare.net/DanGaston
Before You Start: Considerations for RNA-
Seq Analysis
   Next-Generation Sequencing experiments generate
    a lot of raw data
       25-40 GB/sample/replicate for most transcriptomes/tissue
        types/cell lines/conditions

   Require more computational resources than many
    labs routinely have available for analyse data
       At minimum several processing “cores” (8 minimum)
       Large amount of RAM (16GB+)
       Large amount of disk storage space for intermediate and
        final results files in addition to raw FastQ files
       Can be a significant amount of time per sample (days to
        week)
Computational Options
   Local (Large workstation or cluster)
   Remote Computer/Cluster
    (ComputeCanada/ACENet)
   Cloud Services
       Amazon Web Services
   Cloud/Local Bioinformatics „Portals”
       Galaxy
       Chipster
       GenomeSpace
       CloudBioLinux
       CloudMan
       BioCloudCentral (Interface to CloudMan, CloudBioLinux,
        etc)
RNA-Seq Analysis Workflow
So I Ran an RNA-Seq Experiment. Now
What?
   Need to go from raw “read” data to gene expression
    data
   We now have:
       De-multiplexed fastq files for each individual sample and
        replicate
   We want lists of:
       Differentially expressed genes/transcripts
       Potentially novel genes/transcripts
       Potentially novel splice junctions
       Potential fusion events
   Organize your data, programs, and additional
    resources (discussed later)
What is the Raw Data
   A single lane of Illumina HiSeq 2000 sequencing
    produces ~ 250 – 300 million “reads” of sequencing
   Can be paired or single-end sequencing (paired-end
    preferred)
   Various sequencing lengths (number of sequencing
    cycles)
       2x50bp, 2x75bp, 2x100bp, 2x150bp most common
       Cost versus amount of usable data
   True raw data is actually image data with colour
    intensities that are then converted into text (A, C, G,
    T and quality scores) called FastQ
FastQ
@M00814:1:000000000-A2472:1:1101:14526:1866 1:N:0:1
TGGAACATGCGTGCGNAGCCGAAAGTGTGTCCCCACTTTCATATGAAGAAAGAC
+
?????BBBBB9?+<+#,,6C>CAEEHHHFFHHHHFEHHHHHHHHHGHHHHHHHHHH


   FASTA format file with a header line, sequence line, and
    quality scores for every base in the sequenced read
   In Paired-End Sequencing one file for each “end” of
    sequencing (Primer 1 and Primer 2)
   Qualities scores are encoded with a single character
    representing a number. Most common encoding scheme
    is called Phred33. Old Illumina software used Phred64
    but current generation does not. (Illumina 1.3 – 1.7 is
    Phred64)
       Often needs to be set explicitly in alignment programs
General Analysis Pipeline

         Short-Read Alignment


        Transcript Reconstruction


         Abundance/Expression


        Visualization / Statisticss
What is Short-Read Alignment?


Paired-End Reads


Section of Reference
Chromosome
What’s Special About RNA-Seq


   Normally distance between paired-reads and size of
    insertions both constrained
   With RNA-Seq the source is mRNA, not genomic
    DNA
   Mapping to a reference genome, not transcriptome
   Need to account for introns, pairs can be much
    further apart than expected
Transcript Reconstruction: Intron/Exon
Junctions


Exon1               Exon 2               Exon 3
Transcript Reconstruction: Alternative
Splicing


Exon1                Exon 2              Exon 3
Transcript Reconstruction: Novel
Exon/Transcript Identification


Exon1               Exon 2     Exon X   Exon 3
Transcript Reconstruction: Fusion
Transcripts


Exon1                Exon 2         Exon 3


                 Gene 2 Exon 4
Transcript Reconstruction: Differential
Expression

                   Sample 1


                   Sample 2
What else can we look for?
   Combine with ChiP-Seq to differentiate various
    levels of regulation
   Integrative analyses to identify common elements
    (micro-RNA, transcription factors, molecular
    pathways, protein-DNA interactions)
   Combine with whole-exome or whole-genome
    sequencing
       Allele-specific expression
       Allelic imbalance
       LOH
       Large genomic rearrangements/abnormalities
Caution
   Need to differentiate between real data and artifacts
   Differentiate between biologically meaningful data
    and “noise”
   Sample selection, experimental design, biological
    replication (not technical replication), and robust
    statistical methods are important
   Looking at your data “by eye” is useful, but needs to
    be backed up by stats
   Avoid experimenter bias
   Try and be holistic in your analyses
Visualizing with IGV
“Tuxedo” Analysis Pipeline

                         Bowtie


                         Tophat


                       Cufflinks
      Cufflinks   Cuffcompare   Cuffmerge   Cuffdiff


                  CummeRbund
What you need before you begin
   The individual programs
   Reference genome (hg19/GRCh37)
       FASTA file of whole genome, each chromosome is a
        sequence entry
   Bowtie2 Index files for reference genome
       Index files are compressed representations of the
        genome that allow assembly to the reference efficiently
        and in parallel
   Gene/Transcript annotation reference (UCSC,
    Ensembl, ENCODE, etc)
       Gives information about the location of genes and
        important features such as location of introns, exons,
        splice junctions, etc
Step 0: Bowtie
   Bowtie forms the core of TopHat for short-read
    alignment
   Initial mapping of subset of reads (~5 million) to a
    reference transcriptome to estimate inner-distance
    mean/median and standard deviation for tophat
   This info can be retrieved from the library prep stage
    but is actually better to estimate from your final data
   Sample command-line:

    bowtie –x /path/to/transcriptome_ref.fa –q –phred33 –local –p 8 -1
    read1.fastq -2 read2.fastq –S output.sam
Step 1: Tophat
   Tophat is a short-read mapper capable of aligning
    reads to a reference genome and finding exon-exon
    junctions
   Can be provided a list of known junctions, do de
    novo junction discovery, or both
   Also has an option to find potential fusion-gene
    transcripts
   Sample command-line:

    tophat –p 8 –G gene_annotations.gtf –r inner_distance –mate-std-dev
    std_dev –o Output.dir /path/to/bowtie2indexes/genome read1.fastq
    read2.fastq
About TopHat Options
   -o: The path/name of a directory in which to place all
    of the TopHat output files
   -G path to and name of an annotation file so TopHat
    can be aware of known junctions
   Reference Genome: Given as path and “base
    name.” If reference genome saved as:
    /genomes/hg19/genome.fa then the relevant path
    and basename would be /genomes/hg19/genome
   Inner Distance = Fragment size – (2 x read length)
TopHat: Additional options
   --no-mixed
   --b2-very-sensitive
   --fusion-search
   Running above options on 6 processing cores on
    one sample took ~26 hours
Step 2: Cufflinks
   Cufflinks performs gene and transcript discovery
   Many possible options
       No novel discovery, use only a reference group of
        transcripts
       de novo mode (shown below, beginner‟s default)
       Mixed Reference-Guided Assembly and de novo
        discovery.
       Options for more robust normalization methods and error
        correction
   Sample command-line:

    cufflinks –p 8 –o Cufflinks.out/ accepted_hits.bam
Step 3: Cuffmerge
   Merges sample assemblies, estimate abundances,
    clean up transcriptome
   Sample command-line:

    cuffmerge –g gene_annotations.gtf –s /path/to/genome.fa –p 8
    text_list_of_assemblies.txt
Step 4: Cuffdiff
   Calculates expression levels of transcripts in
    samples
   Estimates differential expression between samples
   Calculates significance value for difference in
    expression levels between samples
   Also groups together transcripts that all start from
    same start site. Identify genes under
    transcriptional/post-transcriptional regulation
   Sample command-line:

    cuffdiff –o Output.dir/ –b /path/to/genome.fa –p 8 –L Cond1,Cond2 –u
    merged.gtf cond1.bam cond2.bam
Cuffdiff Output
   FPKM values for genes, isoforms, CDS, and groups of
    genes from same Transcription Start Site for each
    condition
       FPKM is the normalized “expression value” used in RNA-Seq
   Count files of above
   As above but on a per replicate basis
   Differential expression test results for genes, CDS,
    primary transcripts, spliced transcripts on a per sample
    (condition) comparison basis (Each possible X vs Y
    comparison unless otherwise specified)
       Includes identifiers, expression levels, expression difference
        values, p-values, q-values, and yes/no significance field
   Differential splicing tests, differential coding output,
    differential promoter use
Step 5: CummeRbund (R)


                         Trapnell et al., 2012
Visualization


                Trapnell et al., 2012
Help!
   Command X failed
       Keep calm
       Don‟t blame the computer
       Check input files and formats
       Google/SeqAnswers/Biostars
   Results looks “weird”
       Check the raw data
       Re-check the commands you used
   RNA-Seq analysis is an experiment:
       Maintain good records of what you did, like any other
        experiment
Alternative tools
   Alternative short-read alignment
       BWA -> Can not align RNA-Seq data
       GSNAP
       STAR -> Requires minimum of 30GB of RAM
   Alternative transcript reconstruction
       STAR
       Scripture
   Alternative Expression/Abundance Estimation
       DESeq
       DEXSeq
       edgeR
Resources
Software Websites
   TopHat          http://tophat.cbcb.umd.edu
   Cufflinks       http://cufflinks.cbcb.umd.edu
   STAR            http://gingeraslab.cshl.edu/STAR/
   Scripture

http://www.broadinstitute.org/software/scripture/

   Bioconductor    http://www.bioconductor.org/
       DEXSeq
       DESeq
       edgeR
   Blah
Additional Resources
   Differential gene and transcript expression analysis
    of RNA-Seq Experiments with TopHat and Cufflinks
    (2012) Nature Protocols. 7(3)
   www.biostars.org (Q&A site)
   SeqAnswers Forum
   GENCODE Gene Annotations
       http://www.gencodegenes.org/
       ftp://ftp.sanger.ac.uk/pub/gencode
   TopHat / Illumina iGenomes References and
    Annotation Files:
       http://tophat.cbcb.umd.edu/igenomes.html
Acknowledgements
   Dalhousie University          Dr. Graham Dellaire
       Dr. Karen Bedard          Montgomery Lab
       Dr. Chris McMaster         Stanford
       Dr. Andrew Orr                Dr. Stephen Montgomery
       Dr. Conrad Fernandez
                                  BHCRI CRTP Skills
       Dr. Marissa Leblanc
                                   Acquisition Program
       Mat Nightingale
       Bedard Lab
       IGNITE
Experimental Data for Genes of
                       Interest
UCSC Genome Browser
UCSC Genome Browser
MetabolicMine
MetabolicMine
NCI Pathway Interaction Database
The Cancer Genome Atlas
   Identify cancer subtypes, actionable driver
    mutations, personalized/genomic/precision medicine
   More than $275 million in funding from NIH
   Multiple research groups around the world
   20 cancer types being studied
   205 publications from the research network since
    late 2008
The Cancer Genome Atlas
UNIX/Linux command-line basics
What is UNIX?
   UNIX and UNIX-Like are a family of computer
    operating systems originally developed at AT&T‟s
    Bell Labs
       Apple OS X and iOS (UNIX)
       Linux (UNIX-Like)
Intro
   The terminal (command-line) isn‟t THAT scary.
    Maintaining a Linux environment can be challenging,
    but most of these analyses can also be done in an
    OS X environment
   Installing software can sometimes be cumbersome
    and confusing, however many standard
    bioinformatics programs and software libraries are
    fairly easy to set-up
   Working with the programs from the command-line
    will often give you a better appreciation for what the
    program does and what it requires
Terms to Know
   Path: The location of a directory, file, or command on
    the computer.
       Example: /Users/dan (OS X home directory)
The Commands You Need to Know
   ls: Lists the files in the current directory. Directories
    (folders) are just a special type of file themselves
   cd: Change directory
   pwd: View the full path of the directory you are
    currently in
   cat: Displays the contents of a file on the terminal
    screen
   head / tail : Displays the top or bottom contents of a
    file to the screen respectively

Dgaston dec-06-2012

  • 1.
    Bioinformatics: Intro toRNA-Seq Analysis Integrated Learning Session Daniel Gaston, PhD Dr. Karen Bedard Lab, Department of Pathology December 6th, 2012
  • 2.
    Overview  Introduction  Considerations for RNA-Seq  Computational Resources/Options  Analysis of RNA-Seq Data  Principle of analyzing RNA-Seq  General RNA-Seq analysis pipeline  “Tuxedo” pipeline  Alternative tools  Resources  http://www.slideshare.net/DanGaston
  • 3.
    Before You Start:Considerations for RNA- Seq Analysis  Next-Generation Sequencing experiments generate a lot of raw data  25-40 GB/sample/replicate for most transcriptomes/tissue types/cell lines/conditions  Require more computational resources than many labs routinely have available for analyse data  At minimum several processing “cores” (8 minimum)  Large amount of RAM (16GB+)  Large amount of disk storage space for intermediate and final results files in addition to raw FastQ files  Can be a significant amount of time per sample (days to week)
  • 4.
    Computational Options  Local (Large workstation or cluster)  Remote Computer/Cluster (ComputeCanada/ACENet)  Cloud Services  Amazon Web Services  Cloud/Local Bioinformatics „Portals”  Galaxy  Chipster  GenomeSpace  CloudBioLinux  CloudMan  BioCloudCentral (Interface to CloudMan, CloudBioLinux, etc)
  • 5.
  • 6.
    So I Ranan RNA-Seq Experiment. Now What?  Need to go from raw “read” data to gene expression data  We now have:  De-multiplexed fastq files for each individual sample and replicate  We want lists of:  Differentially expressed genes/transcripts  Potentially novel genes/transcripts  Potentially novel splice junctions  Potential fusion events  Organize your data, programs, and additional resources (discussed later)
  • 7.
    What is theRaw Data  A single lane of Illumina HiSeq 2000 sequencing produces ~ 250 – 300 million “reads” of sequencing  Can be paired or single-end sequencing (paired-end preferred)  Various sequencing lengths (number of sequencing cycles)  2x50bp, 2x75bp, 2x100bp, 2x150bp most common  Cost versus amount of usable data  True raw data is actually image data with colour intensities that are then converted into text (A, C, G, T and quality scores) called FastQ
  • 8.
    FastQ @M00814:1:000000000-A2472:1:1101:14526:1866 1:N:0:1 TGGAACATGCGTGCGNAGCCGAAAGTGTGTCCCCACTTTCATATGAAGAAAGAC + ?????BBBBB9?+<+#,,6C>CAEEHHHFFHHHHFEHHHHHHHHHGHHHHHHHHHH  FASTA format file with a header line, sequence line, and quality scores for every base in the sequenced read  In Paired-End Sequencing one file for each “end” of sequencing (Primer 1 and Primer 2)  Qualities scores are encoded with a single character representing a number. Most common encoding scheme is called Phred33. Old Illumina software used Phred64 but current generation does not. (Illumina 1.3 – 1.7 is Phred64)  Often needs to be set explicitly in alignment programs
  • 9.
    General Analysis Pipeline Short-Read Alignment Transcript Reconstruction Abundance/Expression Visualization / Statisticss
  • 10.
    What is Short-ReadAlignment? Paired-End Reads Section of Reference Chromosome
  • 11.
    What’s Special AboutRNA-Seq  Normally distance between paired-reads and size of insertions both constrained  With RNA-Seq the source is mRNA, not genomic DNA  Mapping to a reference genome, not transcriptome  Need to account for introns, pairs can be much further apart than expected
  • 12.
  • 13.
  • 14.
    Transcript Reconstruction: Novel Exon/TranscriptIdentification Exon1 Exon 2 Exon X Exon 3
  • 15.
  • 16.
  • 17.
    What else canwe look for?  Combine with ChiP-Seq to differentiate various levels of regulation  Integrative analyses to identify common elements (micro-RNA, transcription factors, molecular pathways, protein-DNA interactions)  Combine with whole-exome or whole-genome sequencing  Allele-specific expression  Allelic imbalance  LOH  Large genomic rearrangements/abnormalities
  • 18.
    Caution  Need to differentiate between real data and artifacts  Differentiate between biologically meaningful data and “noise”  Sample selection, experimental design, biological replication (not technical replication), and robust statistical methods are important  Looking at your data “by eye” is useful, but needs to be backed up by stats  Avoid experimenter bias  Try and be holistic in your analyses
  • 19.
  • 20.
    “Tuxedo” Analysis Pipeline Bowtie Tophat Cufflinks Cufflinks Cuffcompare Cuffmerge Cuffdiff CummeRbund
  • 21.
    What you needbefore you begin  The individual programs  Reference genome (hg19/GRCh37)  FASTA file of whole genome, each chromosome is a sequence entry  Bowtie2 Index files for reference genome  Index files are compressed representations of the genome that allow assembly to the reference efficiently and in parallel  Gene/Transcript annotation reference (UCSC, Ensembl, ENCODE, etc)  Gives information about the location of genes and important features such as location of introns, exons, splice junctions, etc
  • 22.
    Step 0: Bowtie  Bowtie forms the core of TopHat for short-read alignment  Initial mapping of subset of reads (~5 million) to a reference transcriptome to estimate inner-distance mean/median and standard deviation for tophat  This info can be retrieved from the library prep stage but is actually better to estimate from your final data  Sample command-line: bowtie –x /path/to/transcriptome_ref.fa –q –phred33 –local –p 8 -1 read1.fastq -2 read2.fastq –S output.sam
  • 23.
    Step 1: Tophat  Tophat is a short-read mapper capable of aligning reads to a reference genome and finding exon-exon junctions  Can be provided a list of known junctions, do de novo junction discovery, or both  Also has an option to find potential fusion-gene transcripts  Sample command-line: tophat –p 8 –G gene_annotations.gtf –r inner_distance –mate-std-dev std_dev –o Output.dir /path/to/bowtie2indexes/genome read1.fastq read2.fastq
  • 24.
    About TopHat Options  -o: The path/name of a directory in which to place all of the TopHat output files  -G path to and name of an annotation file so TopHat can be aware of known junctions  Reference Genome: Given as path and “base name.” If reference genome saved as: /genomes/hg19/genome.fa then the relevant path and basename would be /genomes/hg19/genome  Inner Distance = Fragment size – (2 x read length)
  • 25.
    TopHat: Additional options  --no-mixed  --b2-very-sensitive  --fusion-search  Running above options on 6 processing cores on one sample took ~26 hours
  • 26.
    Step 2: Cufflinks  Cufflinks performs gene and transcript discovery  Many possible options  No novel discovery, use only a reference group of transcripts  de novo mode (shown below, beginner‟s default)  Mixed Reference-Guided Assembly and de novo discovery.  Options for more robust normalization methods and error correction  Sample command-line: cufflinks –p 8 –o Cufflinks.out/ accepted_hits.bam
  • 27.
    Step 3: Cuffmerge  Merges sample assemblies, estimate abundances, clean up transcriptome  Sample command-line: cuffmerge –g gene_annotations.gtf –s /path/to/genome.fa –p 8 text_list_of_assemblies.txt
  • 28.
    Step 4: Cuffdiff  Calculates expression levels of transcripts in samples  Estimates differential expression between samples  Calculates significance value for difference in expression levels between samples  Also groups together transcripts that all start from same start site. Identify genes under transcriptional/post-transcriptional regulation  Sample command-line: cuffdiff –o Output.dir/ –b /path/to/genome.fa –p 8 –L Cond1,Cond2 –u merged.gtf cond1.bam cond2.bam
  • 29.
    Cuffdiff Output  FPKM values for genes, isoforms, CDS, and groups of genes from same Transcription Start Site for each condition  FPKM is the normalized “expression value” used in RNA-Seq  Count files of above  As above but on a per replicate basis  Differential expression test results for genes, CDS, primary transcripts, spliced transcripts on a per sample (condition) comparison basis (Each possible X vs Y comparison unless otherwise specified)  Includes identifiers, expression levels, expression difference values, p-values, q-values, and yes/no significance field  Differential splicing tests, differential coding output, differential promoter use
  • 30.
    Step 5: CummeRbund(R) Trapnell et al., 2012
  • 31.
    Visualization Trapnell et al., 2012
  • 32.
    Help!  Command X failed  Keep calm  Don‟t blame the computer  Check input files and formats  Google/SeqAnswers/Biostars  Results looks “weird”  Check the raw data  Re-check the commands you used  RNA-Seq analysis is an experiment:  Maintain good records of what you did, like any other experiment
  • 33.
    Alternative tools  Alternative short-read alignment  BWA -> Can not align RNA-Seq data  GSNAP  STAR -> Requires minimum of 30GB of RAM  Alternative transcript reconstruction  STAR  Scripture  Alternative Expression/Abundance Estimation  DESeq  DEXSeq  edgeR
  • 34.
  • 35.
    Software Websites  TopHat http://tophat.cbcb.umd.edu  Cufflinks http://cufflinks.cbcb.umd.edu  STAR http://gingeraslab.cshl.edu/STAR/  Scripture http://www.broadinstitute.org/software/scripture/  Bioconductor http://www.bioconductor.org/  DEXSeq  DESeq  edgeR  Blah
  • 36.
    Additional Resources  Differential gene and transcript expression analysis of RNA-Seq Experiments with TopHat and Cufflinks (2012) Nature Protocols. 7(3)  www.biostars.org (Q&A site)  SeqAnswers Forum  GENCODE Gene Annotations  http://www.gencodegenes.org/  ftp://ftp.sanger.ac.uk/pub/gencode  TopHat / Illumina iGenomes References and Annotation Files:  http://tophat.cbcb.umd.edu/igenomes.html
  • 37.
    Acknowledgements  Dalhousie University  Dr. Graham Dellaire  Dr. Karen Bedard  Montgomery Lab  Dr. Chris McMaster Stanford  Dr. Andrew Orr  Dr. Stephen Montgomery  Dr. Conrad Fernandez  BHCRI CRTP Skills  Dr. Marissa Leblanc Acquisition Program  Mat Nightingale  Bedard Lab  IGNITE
  • 38.
    Experimental Data forGenes of Interest
  • 39.
  • 40.
  • 41.
  • 42.
  • 43.
  • 44.
    The Cancer GenomeAtlas  Identify cancer subtypes, actionable driver mutations, personalized/genomic/precision medicine  More than $275 million in funding from NIH  Multiple research groups around the world  20 cancer types being studied  205 publications from the research network since late 2008
  • 45.
  • 46.
  • 47.
  • 48.
  • 49.
    What is UNIX?  UNIX and UNIX-Like are a family of computer operating systems originally developed at AT&T‟s Bell Labs  Apple OS X and iOS (UNIX)  Linux (UNIX-Like)
  • 50.
    Intro  The terminal (command-line) isn‟t THAT scary. Maintaining a Linux environment can be challenging, but most of these analyses can also be done in an OS X environment  Installing software can sometimes be cumbersome and confusing, however many standard bioinformatics programs and software libraries are fairly easy to set-up  Working with the programs from the command-line will often give you a better appreciation for what the program does and what it requires
  • 51.
    Terms to Know  Path: The location of a directory, file, or command on the computer.  Example: /Users/dan (OS X home directory)
  • 52.
    The Commands YouNeed to Know  ls: Lists the files in the current directory. Directories (folders) are just a special type of file themselves  cd: Change directory  pwd: View the full path of the directory you are currently in  cat: Displays the contents of a file on the terminal screen  head / tail : Displays the top or bottom contents of a file to the screen respectively