Downloaded 16 times

![Analyzing mRNA-seq
We live in a Big Data world
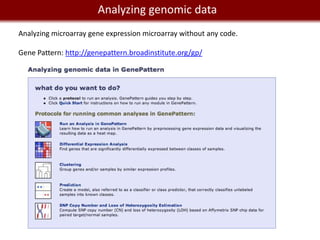
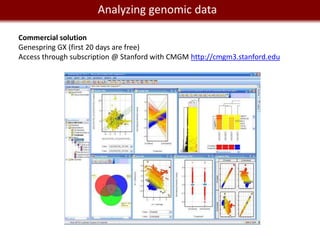
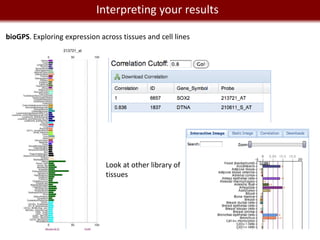
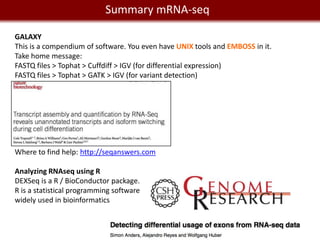
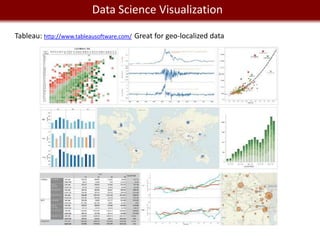
Analyzing mRNA-seq data: 4 steps.
1- Alignment and trimming of reads:
[no GUI] [with GUI and commercial]
Tophat (assembly and splice junction mapper) Genome Studio from Illumina
Cufflinks (assembly and RPKM estimates) Genomequest [looks pretty awesome.]
GALAXY provide access to Tophat, Cufflinks.
2- Calling variants and indels:
GATK (http://www.broadinstitute.org/gsa/wiki/index.php/Home_Page)
VarScan (http://varscan.sourceforge.net/)
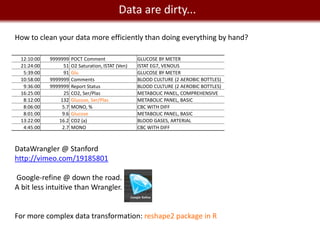
SHRIMP2; VARiD; Atlas-SNP2; SomaticSniper...
Interpretation of variants: SIFT (galaxy)
3- Finding differentially expressed genes
Cuffdiff (galaxy)
DEXseq (R)
4- Visualization:
SAVANT (http://genomesavant.com/savant/)
IGV (http://www.broadinstitute.org/software/igv)](https://image.slidesharecdn.com/cooltools-120801163723-phpapp01/85/Cool-Informatics-Tools-and-Services-for-Biomedical-Research-23-320.jpg)
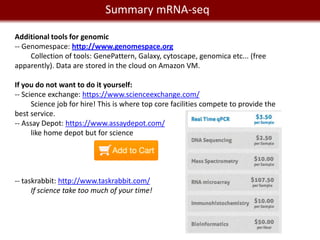
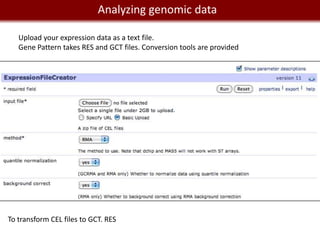
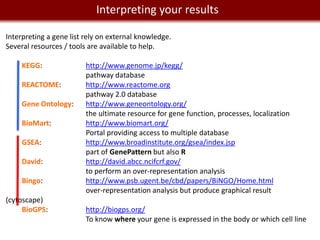
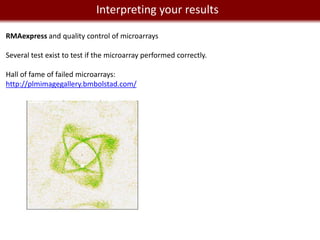
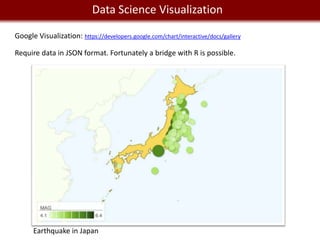
![We live in management and manipulation
Data a Big Data world
REDCap: http://project-redcap.org/
Web app for building and managing online survey and databases
To find participants: https://www.researchmatch.org
MySQL for a professional relational database.
Requires some programming skills in SQL and database design.
Application to query and build databases (goodbye command line):
[OS X]: SequelPro
[Windows]: sqlyog; Toad for MySQL...](https://image.slidesharecdn.com/cooltools-120801163723-phpapp01/85/Cool-Informatics-Tools-and-Services-for-Biomedical-Research-30-320.jpg)

This document provides an overview of bioinformatics tools and services for analyzing big data in biomedical research. It discusses traditional bioinformatics tools, analyzing genomic data from microarrays and next-generation sequencing without and with code, interpreting results using protein interaction networks and pathways, tools for data storage, cleaning and visualization, and making research reproducible. Galaxy, R, and programming are presented as useful for automated, reproducible analysis of large genomic datasets.


![Getting Started with Apache Spark: Big Data Made Simple [Free Meetup]](https://cdn.slidesharecdn.com/ss_thumbnails/apachesparkgettingstarted-260203175547-8361bcc3-thumbnail.jpg?width=640&height=640&fit=bounds)


