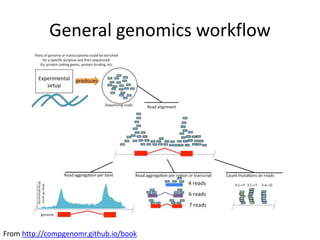
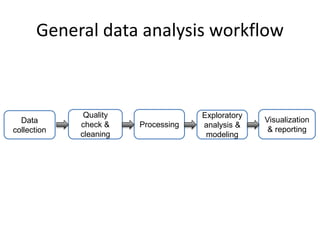
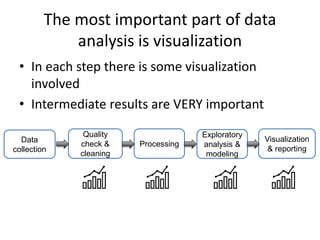
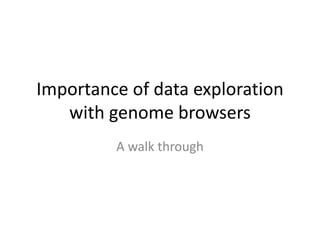
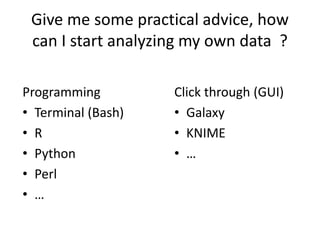
Data analysis patterns, tools
and data types in genomics
for the uninitiated
BIMSB Sys. Bio. Lectures
Jan 2019
Altuna Akalin
Last week today…
• Talked about mindset for research
• Most of the content is here as a blog post:
https://medium.com/@aakalin
This week
• Common data analysis patterns in genomics
• Which tools and data types are relevant in
which step ?
• Ideas on how to get started with learning
bioinformatics
• Programming languages used for data analysis
Slides will be
athttps://www.slideshare.net/altunaakalin
What can we do with high-throughput
assays
• Which genes are expressed and how much ?
• Where does a transcription factor bind ?
• Which bases are methylated in the genome ?
• Which transcripts are translated ?
• Where does RNA-binding proteins bind ?
• Which microRNAs are expressed ?
• Which parts of the genome are in contact with each other ?
• Where are the mutations in the genome located ?
• Which parts of the genome are nucleosome-free ?
• Many more…
The general idea behind high-
throughput techniques
From http://compgenomr.github.io/book
High-throughput sequencing
• AKA massively parallel sequencing
• collection of many methods and technologies
• can sequence DNA, millions of fragments at a
time.
From http://compgenomr.github.io/book
How do you go from here…
…to here ?
General genomics workflow
From http://compgenomr.github.io/book
General data analysis workflow
Exploratory
analysis &
modeling
Data
collection
Quality
check &
cleaning
Processing
Visualization
& reporting
Data collection
• Where and how you get your data
• Includes publicly available data resources
Data collection for genomics
• Which sequencing technology you are using ?
• What kind of experiments are you doing ?
• How many samples ?
• How many replicates ?
• Which public data you will include in your
analysis ?
Data
collection
Fastq files
Quality check and clean up
• Data clean up starts with the data set you get
• Can include removing low quality data points
• Can include removing missing values or
incomplete data sets
In general,
Quality check and clean up
• Quality check is mostly about checking read quality
• Can involve removing low quality bases from reads
• Can involve removing adapter/barcode sequences from
reads
In genomics,
Quality
check &
cleaning
Fastq filesFastq files
PS: You can also filter aligned reads based on how well they align, ignoring this for
simplicity
• Example tools:
– Trimming reads: TrimGalore, cutadapt,
trimmomatic
– Read quality check: fastqc, multiQC
Quality
check &
cleaning
Fastq filesFastq files
Data Processing
• Transforming raw data to a state where
modeling or exploratory data analysis can
start
• Can include making a tabular data structure
from raw data
• Can include data transformations such as
taking logs or normalization
In general,
Data Processing
• alignment + quantification
• Can include further processing/modeling such
as calling peaks for ChIP-seq
In genomics,
Processing
SAM/BAM files
BED files
Text files
Fastq files
SAM/BAM files
• These are produced by aligners such as but
not limited to STAR, Bowtie and BWA
• SAM is a tab-delimited text format contains
alignment info.
Pavlopoulos, BioData Mining20136:13
SAM/BAM files
• BAM is the compressed and indexed version of
SAM files
• Indexing allows random access to the
compressed file
• samtools and friends filter/manipulate BAM files
• More info @ http://samtools.github.io/hts-specs/
BED files
• Aligners or more frequently post-alignment
processing produces BED files
• ChIP-seq peak callers such as MACS2
More info https://genome.ucsc.edu/FAQ/FAQformat.html#format1
Non-standard text files
• Alignment quantification tools such as
featureCounts or HTSeq-count can output text
files
• These will be number of reads per transcript
or gene across samples
General trend in genomics file formats
• Text files
• Tab-delimited
• genomic location and other features such as
names (gene or feature names) and scores
• Many formats (such as BED and SAM) can be
compressed and indexed
Exploratory analysis and modeling
• How samples or variables relate to each other
– clustering & dimension reduction (PCA, etc.)
• Prediction of variable of interest: Y ~ X1 + X2+ X3
• Statistical models including hypothesis testing
In general,
In genomics,
• All of the above
• Annotation with gene sets/pathways
• Looking at genomics data with special browsers, such
as UCSC genome browser or IGV
Final visualization and reporting
• Final figures, tables and text that describes the
outcome of your analysis
• Jupyter notebook or Rmarkdown go-to tool for
compiling reports these days
In general,
In genomics,
• Same as above
• Example reports from RNA-seq analysis
Example RNA-seq workflow
Exploratory
analysis &
modeling
Data
collection
Quality
check &
cleaning
Processing
Visualization
& reporting
Fastqc
trimGalore
STAR
featureCounts
DESeq2
gProfiler
rmarkdown
Example ChIP-seq workflow
Exploratory
analysis &
modeling
Data
collection
Quality
check &
cleaning
Processing
Visualization
& reporting
Fastqc
trimGalore
Bowtie2 genomation
Clustering
RmarkdownMACS2
First pass analysis
• Running through your workflow with default
or pre-defined parameters
• Gives you an idea about data set quality and
biology
Analysis/re-analysis cycle
• The first-pass analysis often has to be
repeated
Exploratory
analysis &
modeling
Data
collection
Quality
check &
cleaning
Processing
Visualization
& reporting
Can’t we automate all this ?
• Yes, to some extent
http://bioinformatics.mdc-berlin.de/pigx/
Wurmus et al. (2018) GigaScience
This is not the end
• More derivative analysis is required based on
the research questions
• This could lead to reprocessing data or
different modeling and visualization
The most important part of data
analysis is visualization
• In each step there is some visualization
involved
• Intermediate results are VERY important
Exploratory
analysis &
modeling
Data
collection
Quality
check &
cleaning
Processing
Visualization
& reporting
Importance of data exploration
with genome browsers
A walk through
Look at your genes or regions of
interest with processed data
Look through your genes or regions of
interest with processed data
Genes of interest Control genes
Form a hypothesis or observation
based on limited data points
Based on limited data points I looked:
• It seems my genes of interest have longer CpG
islands
• It seems my genes of interest have broader
transcription initiation
Test hypothesis/observation with all
the data
To be able to do that:
• We need to get the features of interest for all
genes (genes of interest and control genes)
• We need to calculate lengths and numbers of
features
• We need to do hypothesis testing
• We need to do visualization
The results of such analysis is here: Akalin et al. 2009, Genome Biology
Give me some practical advice, how
can I start analyzing my own data ?
Programming
• Terminal (Bash)
• R
• Python
• Perl
• …
Click through (GUI)
• Galaxy
• KNIME
• …
Galaxy or other GUIs
• There is a tool for every step of analysis you
can chain them. https://usegalaxy.org/
• You still need to know how and where to use
each tool
• The only thing you are bypassing is the
terminal/command line
• GUIs are limited in their flexibility
Programming
• Learning programming diversifies your skillset
– Better for postdoc applications
– Can do stuff outside science or academia
• Learning a GUI does not give you the same
edge
Where do I begin ?
First, a motivating example
Where do I begin ?
Graduate A
• PhD – Genetics,
Thesis: wet-lab
genomics
• M.Sc. – Molecular
Biology, Thesis:
wet-lab genomics
• B.Sc. – Molecular
Biology
Graduate B
• PhD – Genetics,
Thesis: wet-lab
genomics
• M.Sc. – Biology,
Thesis: wet-lab
• Pharmacist in
Training
• B.Sc. – Pharmacy
Guess first position after PhD ?
Why R ?
• All of exploratory analysis, modeling,
visualization and reporting can be done in R
• Bioconductor has thousands of specialized
bioinformatics algorithms/methods
– You can even do alignments & quality check
Where do I begin ?
• Learn how to read text or csv tables
• Learn how to manipulate data frames
• And make simple plots (plot(),hist(),barplot())
• Repeat until you are comfortable
Then,
• Write a function
• Learn loops and control structures
• Learn about other R data types
Get online/offline courses and
material
• Coursera courses:
https://www.coursera.org/learn/r-programming
• Computational genomics with R (book draft):
http://compgenomr.github.io/book
• Rstudio
resources:https://www.rstudio.com/online-
learning/#r-programming
• Datacamp interactive learning (some free stuff)
https://www.datacamp.com/courses/free-
introduction-to-r
Buddy up
• Get a colleague from your lab or neighboring
lab where you can ask each other questions
about programming
How do I get help ?
• Google it out, most problems you will
encounter are encountered. The answer is
reachable by a correctly formed query in
Google
• If it fails, come to “bioinfo. Clinics” or book
consultation at http://iris.mdc-berlin.de
Don’t be a perfectionist
• Just do something that resembles what you
want to do, you will iterate over later make it
better
• Ex:
– don’t worry about making the cutest plot, just
make a plot
– Don’t worry about which mapping algorithm is the
best, just use one and get some results
Python vs R
• If Python is the greatest thing that happened
for general programming languages,
R/Bioconductor is the greatest thing
happened in bioinformatics
• if you learn python first, you will regularly
have to drop in to R for any kind of statistics
developed for HT-seq.
pandas
Data
frames
statsmodels stats
seaborn ggplot
Convergence of data analysis/science
languages
Convergence of data analysis/science
languages
https://ursalabs.org/
Convergence of data analysis/science
languages
Data &
Machine-learning models
Interface for data access and manipulation
@AltunaAkalinhttp://bioinformatics.mdc-berlin.de
http://github.com/BIMSBbioinfo
Slides will be at:
https://www.slideshare.net/altunaakalin
More References/Reading material
• RNA-seqlopedia https://rnaseq.uoregon.edu/
• Computational genomics with R,
http://compgenomr.github.io/book
• Biostars tutorials:
https://www.biostars.org/t/Tutorials/

Data analysis patterns, tools and data types in genomics

  • 1.
    Data analysis patterns,tools and data types in genomics for the uninitiated BIMSB Sys. Bio. Lectures Jan 2019 Altuna Akalin
  • 2.
    Last week today… •Talked about mindset for research • Most of the content is here as a blog post: https://medium.com/@aakalin
  • 3.
    This week • Commondata analysis patterns in genomics • Which tools and data types are relevant in which step ? • Ideas on how to get started with learning bioinformatics • Programming languages used for data analysis Slides will be athttps://www.slideshare.net/altunaakalin
  • 4.
    What can wedo with high-throughput assays • Which genes are expressed and how much ? • Where does a transcription factor bind ? • Which bases are methylated in the genome ? • Which transcripts are translated ? • Where does RNA-binding proteins bind ? • Which microRNAs are expressed ? • Which parts of the genome are in contact with each other ? • Where are the mutations in the genome located ? • Which parts of the genome are nucleosome-free ? • Many more…
  • 5.
    The general ideabehind high- throughput techniques From http://compgenomr.github.io/book
  • 6.
    High-throughput sequencing • AKAmassively parallel sequencing • collection of many methods and technologies • can sequence DNA, millions of fragments at a time.
  • 7.
  • 8.
    How do yougo from here…
  • 9.
  • 10.
    General genomics workflow Fromhttp://compgenomr.github.io/book
  • 11.
    General data analysisworkflow Exploratory analysis & modeling Data collection Quality check & cleaning Processing Visualization & reporting
  • 12.
    Data collection • Whereand how you get your data • Includes publicly available data resources
  • 13.
    Data collection forgenomics • Which sequencing technology you are using ? • What kind of experiments are you doing ? • How many samples ? • How many replicates ? • Which public data you will include in your analysis ? Data collection Fastq files
  • 14.
    Quality check andclean up • Data clean up starts with the data set you get • Can include removing low quality data points • Can include removing missing values or incomplete data sets In general,
  • 15.
    Quality check andclean up • Quality check is mostly about checking read quality • Can involve removing low quality bases from reads • Can involve removing adapter/barcode sequences from reads In genomics, Quality check & cleaning Fastq filesFastq files PS: You can also filter aligned reads based on how well they align, ignoring this for simplicity
  • 16.
    • Example tools: –Trimming reads: TrimGalore, cutadapt, trimmomatic – Read quality check: fastqc, multiQC Quality check & cleaning Fastq filesFastq files
  • 17.
    Data Processing • Transformingraw data to a state where modeling or exploratory data analysis can start • Can include making a tabular data structure from raw data • Can include data transformations such as taking logs or normalization In general,
  • 18.
    Data Processing • alignment+ quantification • Can include further processing/modeling such as calling peaks for ChIP-seq In genomics, Processing SAM/BAM files BED files Text files Fastq files
  • 19.
    SAM/BAM files • Theseare produced by aligners such as but not limited to STAR, Bowtie and BWA • SAM is a tab-delimited text format contains alignment info. Pavlopoulos, BioData Mining20136:13
  • 20.
    SAM/BAM files • BAMis the compressed and indexed version of SAM files • Indexing allows random access to the compressed file • samtools and friends filter/manipulate BAM files • More info @ http://samtools.github.io/hts-specs/
  • 21.
    BED files • Alignersor more frequently post-alignment processing produces BED files • ChIP-seq peak callers such as MACS2 More info https://genome.ucsc.edu/FAQ/FAQformat.html#format1
  • 22.
    Non-standard text files •Alignment quantification tools such as featureCounts or HTSeq-count can output text files • These will be number of reads per transcript or gene across samples
  • 23.
    General trend ingenomics file formats • Text files • Tab-delimited • genomic location and other features such as names (gene or feature names) and scores • Many formats (such as BED and SAM) can be compressed and indexed
  • 24.
    Exploratory analysis andmodeling • How samples or variables relate to each other – clustering & dimension reduction (PCA, etc.) • Prediction of variable of interest: Y ~ X1 + X2+ X3 • Statistical models including hypothesis testing In general, In genomics, • All of the above • Annotation with gene sets/pathways • Looking at genomics data with special browsers, such as UCSC genome browser or IGV
  • 25.
    Final visualization andreporting • Final figures, tables and text that describes the outcome of your analysis • Jupyter notebook or Rmarkdown go-to tool for compiling reports these days In general, In genomics, • Same as above • Example reports from RNA-seq analysis
  • 26.
    Example RNA-seq workflow Exploratory analysis& modeling Data collection Quality check & cleaning Processing Visualization & reporting Fastqc trimGalore STAR featureCounts DESeq2 gProfiler rmarkdown
  • 27.
    Example ChIP-seq workflow Exploratory analysis& modeling Data collection Quality check & cleaning Processing Visualization & reporting Fastqc trimGalore Bowtie2 genomation Clustering RmarkdownMACS2
  • 28.
    First pass analysis •Running through your workflow with default or pre-defined parameters • Gives you an idea about data set quality and biology
  • 29.
    Analysis/re-analysis cycle • Thefirst-pass analysis often has to be repeated Exploratory analysis & modeling Data collection Quality check & cleaning Processing Visualization & reporting
  • 30.
    Can’t we automateall this ? • Yes, to some extent http://bioinformatics.mdc-berlin.de/pigx/ Wurmus et al. (2018) GigaScience
  • 31.
    This is notthe end • More derivative analysis is required based on the research questions • This could lead to reprocessing data or different modeling and visualization
  • 32.
    The most importantpart of data analysis is visualization • In each step there is some visualization involved • Intermediate results are VERY important Exploratory analysis & modeling Data collection Quality check & cleaning Processing Visualization & reporting
  • 33.
    Importance of dataexploration with genome browsers A walk through
  • 34.
    Look at yourgenes or regions of interest with processed data
  • 35.
    Look through yourgenes or regions of interest with processed data Genes of interest Control genes
  • 36.
    Form a hypothesisor observation based on limited data points Based on limited data points I looked: • It seems my genes of interest have longer CpG islands • It seems my genes of interest have broader transcription initiation
  • 37.
    Test hypothesis/observation withall the data To be able to do that: • We need to get the features of interest for all genes (genes of interest and control genes) • We need to calculate lengths and numbers of features • We need to do hypothesis testing • We need to do visualization The results of such analysis is here: Akalin et al. 2009, Genome Biology
  • 38.
    Give me somepractical advice, how can I start analyzing my own data ? Programming • Terminal (Bash) • R • Python • Perl • … Click through (GUI) • Galaxy • KNIME • …
  • 39.
    Galaxy or otherGUIs • There is a tool for every step of analysis you can chain them. https://usegalaxy.org/ • You still need to know how and where to use each tool • The only thing you are bypassing is the terminal/command line • GUIs are limited in their flexibility
  • 40.
    Programming • Learning programmingdiversifies your skillset – Better for postdoc applications – Can do stuff outside science or academia • Learning a GUI does not give you the same edge
  • 41.
    Where do Ibegin ? First, a motivating example
  • 42.
    Where do Ibegin ? Graduate A • PhD – Genetics, Thesis: wet-lab genomics • M.Sc. – Molecular Biology, Thesis: wet-lab genomics • B.Sc. – Molecular Biology Graduate B • PhD – Genetics, Thesis: wet-lab genomics • M.Sc. – Biology, Thesis: wet-lab • Pharmacist in Training • B.Sc. – Pharmacy Guess first position after PhD ?
  • 43.
    Why R ? •All of exploratory analysis, modeling, visualization and reporting can be done in R • Bioconductor has thousands of specialized bioinformatics algorithms/methods – You can even do alignments & quality check
  • 44.
    Where do Ibegin ? • Learn how to read text or csv tables • Learn how to manipulate data frames • And make simple plots (plot(),hist(),barplot()) • Repeat until you are comfortable Then, • Write a function • Learn loops and control structures • Learn about other R data types
  • 45.
    Get online/offline coursesand material • Coursera courses: https://www.coursera.org/learn/r-programming • Computational genomics with R (book draft): http://compgenomr.github.io/book • Rstudio resources:https://www.rstudio.com/online- learning/#r-programming • Datacamp interactive learning (some free stuff) https://www.datacamp.com/courses/free- introduction-to-r
  • 46.
    Buddy up • Geta colleague from your lab or neighboring lab where you can ask each other questions about programming
  • 47.
    How do Iget help ? • Google it out, most problems you will encounter are encountered. The answer is reachable by a correctly formed query in Google • If it fails, come to “bioinfo. Clinics” or book consultation at http://iris.mdc-berlin.de
  • 48.
    Don’t be aperfectionist • Just do something that resembles what you want to do, you will iterate over later make it better • Ex: – don’t worry about making the cutest plot, just make a plot – Don’t worry about which mapping algorithm is the best, just use one and get some results
  • 49.
    Python vs R •If Python is the greatest thing that happened for general programming languages, R/Bioconductor is the greatest thing happened in bioinformatics • if you learn python first, you will regularly have to drop in to R for any kind of statistics developed for HT-seq.
  • 50.
  • 51.
    Convergence of dataanalysis/science languages https://ursalabs.org/
  • 52.
    Convergence of dataanalysis/science languages Data & Machine-learning models Interface for data access and manipulation
  • 53.
  • 54.
    More References/Reading material •RNA-seqlopedia https://rnaseq.uoregon.edu/ • Computational genomics with R, http://compgenomr.github.io/book • Biostars tutorials: https://www.biostars.org/t/Tutorials/

Editor's Notes

  • #6 In summary HT techniques has the following steps, and this also summarized in Figure 2.6: Extraction: This is the step where you extract the genetic material of interest, RNA or DNA. and nrichment Enrichment: In this step, you enrich for the event you are interested in. For example, protein binding sites. In some cases such as whole-genome DNA sequencing there is no need for enrichment step. You just get fragments of genomic DNA and sequence them. Quantification: This is where you quantify your enriched material. Depending on the protocol you may need to quantify a control set as well, where you should see no enrichment or only background enrichment.
  • #42 First a motivating example
  • #43 First a motivating example