Single cell RNA-seq was performed on 18 mouse bone marrow dendritic cells. 982 genes were found to be differentially expressed between two cells, while the majority of genes showed similar expression levels. Future work will analyze the functions of differentially expressed genes to better understand heterogeneity between cells and potential roles in disease.
Integrative transcriptomics to study non-coding RNA functionsMaté Ongenaert
Integrative transcriptomics to study non-coding RNA functions
by dr. ir. Pieter Mestdagh - Center for Medical Genetics, Ghent University
Over the last years, non-coding RNAs (e.g. microRNAs and long non-coding RNAs) have emerged as an important layer of the transcriptome. In order to elucidate their function in disease biology, multiple tools have been developed, ranging from miRNA target prediction algorithms to the more advanced integrative genomics approaches. Through the combination of multiple layers of information, integrative genomics allows a more accurate and comprehensive assessment of non-coding RNA functions in human disease. In this presentation, I will discuss different approaches on how to combine multi-level transcriptome data in order to functionally characterize non-coding RNA networks.
ABSTRACT- Long non-coding RNAs (lncRNAs) are a group of longer than 200 nucleotides which are the largest and more diverse transcripts in the cells. After study from Functional Annotation of Mammalian cDNA, lncRNAs demonstrated some special characteristics such as lower quantity, higher tissue-specificity, higher stage specificity and higher cell subtype specificity. The current evidence from tumor diseases suggests that lncRNAs are an important regulatory RNA present at tumor cells, and therefore their alterations are associated with tumorigenesis and tumor diseases. Here we presented a clinical landscape of lncRNA including detection of lncRNA and their clinical application such as diagnosis biomarkers and therapeutic targets. We also discussed the challenges and resolving strategies for these clinical applications.
Key-words- Long non-coding RNA (lncRNA), Transcripts, sampling, Tumor and tumorigenesis
The Central Roles of Non-coding RNAs in Neurodegenerative Disorders: Neurode...QIAGEN
Non-coding RNAs (ncRNAs), especially microRNAs (miRNAs) and long non-coding RNAs (lncRNAs) have shown aberrant expression profiles in neurodegenerative disorders. This slideshow reviews the roles of lncRNAs and their mechanisms of action in the regulation of neurodegeneration. Learn more about novel solutions to isolate RNAs from blood and cerebral spinal fluid (CSF). A new qPCR-based lncRNA platform for lncRNA detection and profiling is also presented.
Current trends in pseduogene detection and characterizationShreya Feliz
This presentation gives the insight of the current trends in detecting and characterizing Pseudogenes. Pseudogenes detection by bioinformatics may enhance the understanding of Pseudogenes and take research to the next step.
An insight into the reverse genetics in fisheries research. it includes a brief history about the reverse genetics, background, techniques applied, recovery of virus and zebrafish research
Genomics, proteomics and metabolomics are the three core omics technologies, which respectively deal with the analysis of genome, proteome and metabolome of cells and tissues of an organism.
Gene editing application for cancer therapeuticsNur Farrah Dini
The application of TALENs as one of the gene editing tools in order to modify a specific targeted sites on a genome. This method shows a tremendous benefits especially in cancer research.
Functional Analysis of miRNA: miRNA and its Role in Human Disease Webinar Ser...QIAGEN
This slideshow highlights the use of miRNA mimics, inhibitors and target protectors to increase, decrease and adjust the cellular concentration of miRNA and disrupt specific miRNA–mRNA interactions. A ready-to-use screening tool for identifying miRNA targets and info on how to predict mRNA targets using miRNA expression data are also highlighted.
Austin Neurology & Neurosciences is an open access, peer reviewed, scholarly journal dedicated to publish articles covering all areas of Neurology & Neurological Sciences.
The journal aims to promote research communications and provide a forum for doctors, researchers, physicians and healthcare professionals to find most recent advances in all areas of Neurology & Neurological Sciences. Austin Neurology & Neurosciences accepts original research articles, reviews, mini reviews, case reports and rapid communication covering all aspects of neurology & neurosciences.
Austin Neurology & Neurosciences strongly supports the scientific up gradation and fortification in related scientific research community by enhancing access to peer reviewed scientific literary works. Austin Publishing Group also brings universally peer reviewed journals under one roof thereby promoting knowledge sharing, mutual promotion of multidisciplinary science.
microRNA for Clinical Research and Tumor AnalysisBioGenex
The discovery of microRNAs [miRNAs] has been one of the defining developments in cancer biology over the past decade. miRNAs are short, single stranded 20-22 nucleotide long, non-coding RNAs that regulate gene expression and have fundamental roles in Cancer growth and metastasis. miRNAs exert their function via base pairing with complementary mRNA molecules, resulting in gene silencing via transcriptional repression or target degradation. BioGenex solved the inherent difficulties in visualizing miRNAs in spatial context by using a propriety technology to synthesize modified, high-affinity oligonucleotides, labelling miRNA probes with multiple reporter molecules and developing a fully-integrated miRNA-ISH workflow solution allowing high throughput analysis of miRNA in the spatial context.
The study of the complete set of RNAs (transcriptome) encoded by the genome of a specific cell or organism at a specific time or under a specific set of conditions is called Transcriptomics.
Transcriptomics aims:
I. To catalogue all species of transcripts, including mRNAs, noncoding RNAs and small RNAs.
II. To determine the transcriptional structure of genes, in terms of their start sites, 5′ and 3′ ends, splicing patterns and other post-transcriptional modifications.
III. To quantify the changing expression levels of each transcript during development and under different conditions.
Feature story from the Garvan Institute of Medical Research's April 2013 issue of Breakthrough newsletter. More at https://www.garvan.org.au/news-events/newsletters
RT-PCR and DNA microarray measurement of mRNA cell proliferationIJAEMSJORNAL
For mRNA quantification, RT-PCR and DNA microarrays have been compared in few studies
(RT-PCR). Healing callus of adult and juvenile rats after femur injury was found to be rich in mRNA at
various stages of the healing process. We used both methods to examine ten samples and a total of 26 genes.
Internal DNA probes tagged with 32P were employed in reverse transcription-polymerase chain reaction
(RT-PCR) to identify genes (RT-PCR). Ten Affymetrix® Rat U34A cRNA microarrays were hybridized with
biotin-labeled cRNA generated from mRNA. There was a wide range of correlation coefficients (r) between
RT-PCR and microarray data for each gene. Meaning became genetically unique because of this diversity.
Relatively lowly expressed genes had the highest r values. The distance between PCR primers and
microarray probes was found to be higher than previously assumed, leading to a drop in agreement between
microarray calls and PCR outcomes. Microarray research showed that RT-PCR expression levels for two
genes had a "floor effect." As a result, PCR primers and microarray probes that overlap in mRNA expression
levels can provide good agreement between these two techniques.
Analysis of Genomic and Proteomic Sequence Using Fir FilterIJMER
Bioinformatics is a field of science that implies the use of techniques from mathematics, informatics, statistics, computer science, artificial intelligence, chemistry, and biochemistry to solve biological problems usually on the molecular level. Digital Signal Processing (DSP) applications in genomic sequence analysis have received great attention in recent years.DSP principles are used to analyse genomic and proteomic sequences. The DNA sequence is mapped into digital signals in the form of binary indicator sequences. Signal processing techniques such as digital filtering is applied to genomic sequences to identify protein coding region. Frequency response of genomic sequences is used to solve many optimization problems in science, medicine and many other applications. The aim of this paper is to describe a method of generating Finite Impulse Response (FIR) of the genomic sequence. The same DNA sequence is used to convert into proteomic sequence using transcription and translation, and also digital filtering technique such as FIR filter applied to know the frequency response. The frequency response is same for both gene and proteomic sequence.
description of functional genomics and structural genomics and the techniques involved in it and also decribing the models of forward genetics and techniques involved in it and reverse genetics and techniques involved in it
Being able to identify genes, compare them, analyze them could be applied in various research areas from medical to industrial.
This ppt is designed for Health science and computational biology students to enable you understand the above mentioned topic.
Introduction
Transcriptome analysis
Goal of functional genomics
Why we need functional genomics
Technique
1. At DNA level
2.At RNA level
3. At protein level
4. loss of function
5. functional genomic and bioinformatics
Application
Latest research and reviews
Websites of functional genomics
Conclusions
Reference
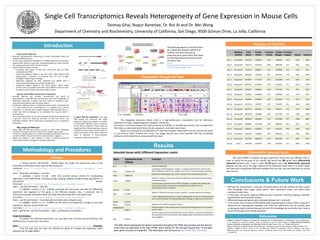
1. Single Cell Transcriptomics Reveals Heterogeneity of Gene Expression in Mouse Cells
Tanmay Ghai, Nupur Banerjee, Dr. Rizi Ai and Dr. Wei Wang
Department of Chemistry and Biochemistry, University of California, San Diego, 9500 Gilman Drive, La Jolla, California
What exactly is RNA-seq?
• RNA-seq: next-generation sequencing to extract information about the
content of RNA sequences.
• 3 main steps: quantify the abundance of mRNA, determine the structure
of genes (their different sized ends, and splicing patterns), and to quantify
the varying expression levels of each transcript.
• A typical RNA-seq project involves
• converting long strands of RNA into many short parts of cDNA
(complimentary DNA).
• sequencing adaptors attach to the each short cDNA fragment and
subsequently, a sequence is produced with the use of high-
throughput sequencing technology.
• Sequences produced are then compared and aligned with a
transcriptome (also known as a reference genome).
• categorized aligned sequence into three groups: exonic reads,
junction reads, and poly(A) end-reads. These different reads can then
be used to view the basic expression profile of a gene.
Why we conduct RNA-seq and why is it important?
• Recently RNA-seq has recently revolutionized the world of
transcriptomics. Using RNA-seq, we now have much more knowledge on
differential expression of genes and their levels of expression, post-
transcriptional mutations and even gene fusions.
• Furthermore, RNA-seq helps us understand what exactly a transcriptome
is. A basic definition of a transcriptome is a complete set of all the
transcripts in a cell and their quantity. However, RNA-seq takes this to a
whole new level by allowing us to understand the nuances within a
transcriptome.
• This is essential because we can then interpret the functional elements of
a genome, reveal the molecular structure of cells and tissues, and
understand disease, which could lead to potential cures or prevention
information.
Why single-cell RNA-seq?
• Using single cell RNA-seq analysis can give us much more substantial
information about gene expression, protein levels, and phenotypic output.
• This gives us valuable insight on how cellular heterogeneity within gene expression
can lead to different traits and inherited information between organisms.
• Single cell analysis is vital because it helps us identify previously
unperceived variation among genes and gene expression.
Introduction
References
Methodology and Procedures
Results
Differentially Expressed Genes
• RNA-seq has now become a vital part of bioinformatics and will continue to help us gain
new knowledge and insight about genes, their expression levels, and what these
expression levels mean.
• In this study, 18 mouse single-cell RNA-seq were analyzed, including mapping, assembly,
quantification and functional analysis
• Differential expressed genes were compared between cell 1 and cell2
• In the future, the functions of 982 differentially expressed genes will be further analyzed to
determine the heterogeneity between cells. With this information, we can identify what
certain genes lead to various diseases and with this knowledge we can further learn how to
prevent those genes from being expressed
1. Shalek AK, Satija R, Adiconis X, Gertner RS, Gaublomme JT, Raychowdhury R, Schwartz S, Yosef N, Malboeuf C,
Lu D, Trombetta JJ, Gennert D, Gnirke A, Goren A, Hacohen N, Levin JZ, Park H, Regev A. Single-cell transcriptomics
reveals bimodality in expression and splicing in immune cells. Nature. 2013 Jun 13;498(7453):236-40
2. Wang Z, Gerstein M, Snyder M. Nat Rev Genet. RNA-Seq: a revolutionary tool for transcriptomics. 2009 Jan;10(1):57-63.
3. Trapnell C, Roberts A, Goff L, Pertea G, Kim D, Kelley DR, Pimentel H, Salzberg SL, Rinn JL, Pachter L. Nat Protoc.
Differential gene and transcript expression analysis of RNA-seq experiments with TopHat and Cufflinks. 2012 Mar
1;7(3):562-78.
Mapping and Assembly
Visualization Through IGV Tools
1. Gsnap (version 2013-02-05) - GSNAP aligns the single and paired-end reads of the
transcripts and produces short reads of RNA sequences.
Command - gsnap -t 4 -A sam -N 0 –D dir -d mm10 -s mm10.splicesites.iit --force-xs-dir --split-output=s *_1.fastq
*_2.fastq
Input - .fastq files and Output - .sam files
2. Samtools ( version 0.1.18) – SAM Tools provide various utilities for manipulating
alignments in the SAM format, including sorting, merging, indexing and generating alignments in a
per-position format.
Command - samtools-0.1.18/samtools view -Sb s.concordant_uniq > s.concordant_uniq.bam
Input - .sam file and Output - .bam file
3. Cufflinks ( version 2.1.1) - Cufflinks assembles the transcripts and looks for differential
expression and regulation of the genes in the RNA-seq samples. Also, it constructs sets of
transcripts that give information about the reads that were observed in the experiment.
Command - cufflinks-2.1.1.Linux_x86_64/cufflinks -p 4 -G genes.gtf merge_concordant.bam
Input - .sam file and Output – transcripts.gtf, transcripts.expr, and genes.expr.
4. Cuffdiffs ( version 2.1.1 ) - Cuffdiffs can be used to find significant changes in transcript
expression, splicing, and promoter use.
Command – cuffdiff ../s1/genes.gtf ../s1/merge_concordant.bam ../s2/merge_concordant.bam
Input - .gtf file and .sam files and Output - .fpkm_tracking files among others
Single Cell Samples:
To conduct this RNA-Seq experiment, we used data from 18 bone-marrow dendritic cells
(BMDCs) from a mouse (mus musculus).1
Gene Ontology:
From the data that we used, we selected ten genes to compare the expression levels
between the 18 single BMDCs.
Gene Expression level
(FPKM)
Function
Zf12 0 Gene not expressed
Ints8 7.10652e-317
Component of the Integrator complex, a complex involved in the small nuclear
RNAs (snRNA) U1 and U2 transcription and in their 3'-box-dependent processing.
Foxp1 0.0682131
Expressed in developing lung, neural, intestinal and cardiovascular tissues.
Hook1 3.48482
Defects in Hook1 are the cause of the azh (abnormal spermatozoon head shape)
mutant phenotype,
Timm22 10.531
Essential core component of the TIM22 complex, a complex that mediates the
import and insertion of multi-pass transmembrane proteins into the
mitochondrial inner membrane.
Phyh 16.3463
Defects in Phyh are the cause of lupus nephritis, a severe autoimmune disease.
Capza1 21.6231
F-actin-capping proteins bind in a Ca(2+)-independent manner to the fast growing
ends of actin filaments thereby blocking the exchange of subunits at these ends.
Snrpe 52.9471 Belongs to the snRNP Sm proteins family.,
1600029D21Ri
k 1066.27
May participate in the wound response during the healing process, and promote
wound repair
Lyz2 23255.5
Lysozymes have primarily a bacteriolytic function; those in tissues and body fluids
are associated with the monocyte-macrophage system and enhance the activity of
immunoagents.
The table above represents the gene’s expressed throughout the RNA-seq process and the level at
which they are expressed in the units FPKM, which stands for “for end pair sequencing.” To the right,
each gene’s function is explained. This information can be found at http://david.abcc.ncifcrf.gov.
Conclusions & Future Work
A typical RNA-seq experiment. First, long
RNA strands are converted into cDNA
fragments. Sequencing adaptors are added
to each cDNA fragment, and the sequence
of the cDNA is obtained. These reads are
aligned with the reference genome, and are
classified as exonic reads, junction reads, or
poly(A) end-reads. Finally, these types are
used to generate a base-resolution
expression profile for each gene2.
The following diagram on the left shows
the relationship between GSNAP and
Cufflinks, and how they end up
producing short reads, which then leads
to analyzing the gene expression levels
of various cells.
Picture:
http://gingerplum.files.wordpress.com/2011/08/
8-20-20111.jpg?w=640&h=448
The Integrative Genomics Viewer (IGV) is a high-performance visualization tool for interactive
exploration of large, integrated genomic datasets. Simply put
IGV tools is a tool that converts the reads produced by Cufflinks, in the RNA-seq process, into a visualization
that helps us understand what these strands, sequences, and reads really mean.
Above is an example of a visualization of a read that has been tested with a human cell (not the same
as our process, which involves mice cells). The image records each track identifier with the correlating
attribute and the data that is produced with that read.
We used Cuffdiff to compare the gene expression levels from two different cells, in
order to verify the accuracy of our results. We found that 982 genes were differentially
expressed between cells 1 and 2, while 22,378 genes were not differentially expressed
between the two. Since the large majority of the expression levels were in a similar range,
and there was no significant difference between the two cells, we concluded that our results
were precise.
Mapping
Quality
Total
Reads
Proper
Paired
% Proper
Paired
Unique
Mapper
% Unique
mapper Genes Isoforms
Cell_1 Very good! 9421315 7859185 83.4 7430034 78.9 3182 3446
Cell_2 Very good! 7813112 6312444 80.8 5881004 75.3 4751 5165
Cell_3 Very good! 7252243 5968877 82.3 5509608 76.0 4150 4517
Cell_4 Very good! 8762922 7243616 82.7 6827052 77.9 3337 3596
Cell_5 Very good! 9619357 7713570 80.2 7211808 75.0 3821 4154
Cell_6 Very good! 8035212 6537042 81.4 6197844 77.1 3514 3789
Cell_7 Very good! 9166757 7588491 82.8 7141259 77.9 3877 4215
Cell_8 Very good! 8119591 6598845 81.3 6196639 76.3 3716 4027
Cell_9 Very good! 7946851 6526587 82.1 6142598 77.3 4019 4371
Cell_10 Very good! 9672123 7979027 82.5 7552492 78.1 3204 3429
Cell_11 Very good! 6814517 5653627 83.0 5403171 79.3 2737 2896
Cell_12 Very good! 9024335 7363060 81.6 6917248 76.7 3239 3498
Cell_13 Very good! 8224518 6855884 83.4 6472480 78.7 4488 4867
Cell 14 Very good! 8168995 6761990 82.8 6395450 78.3 3215 3475
Cell 15 Very good! 8266431 6838516 82.7 6522522 78.9 2369 2519
Cell 16 Very good! 8525597 7079661 83.0 6586434 77.3 4576 4955
Cell_17 Very good! 8477944 6883249 81.2 6421991 75.7 4012 4375
Cell 18 Good 7065766 5565973 78.8 5239209 74.1 5069 5506
Selected Genes with Different Expression Levels
Software