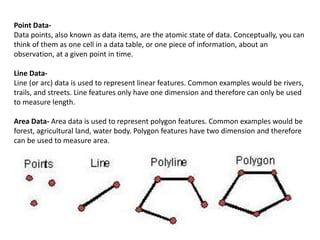
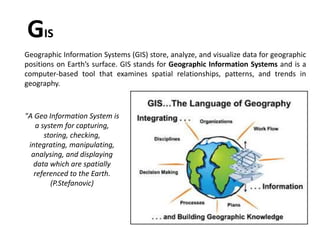
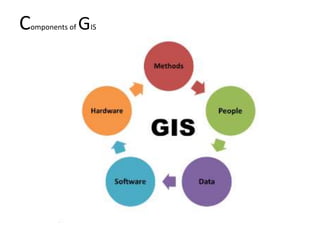
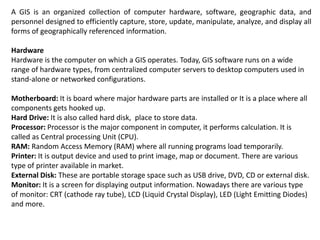
Geographic Information Systems (GIS) store, analyze, and visualize spatial data referenced to Earth's surface. GIS integrates hardware, software, data, and personnel to capture, store, update, manipulate, analyze and display geographic information efficiently. Key components include GIS software that provides tools to work with spatial data stored in a database, as well as spatial data like vectors and rasters, and associated attribute data. GIS relies on both technical specialists to design and maintain the system and end users to apply it to problems.
This presentation is about the raster and vector data in GIS which is important and costly as well, through the presentation we will learn about both type of data.
This is all about remote sensing. Remote sensing is the acquisition of information about an object or phenomenon without making physical contact with the object and thus in contrast to on-site observation, especially the Earth.Remote sensing is the process of detecting and monitoring the physical characteristics of an area by measuring its reflected and emitted radiation at a distance from the targeted area. Special cameras collect remotely sensed imagesof the Earth, which help researchers "sense" things about the Earth.
The concept of GIS was first introduced in the early 1960s, and it was subsequently researched and developed as a new discipline. The GIS history views Roger Tomlinson as a pioneer of the concept, where the first iteration was designed to store, collate, and analyze data about land usage in Canada.
Iirs overview -Remote sensing and GIS application in Water Resources ManagementTushar Dholakia
Remote sensing and GIS application in Water Resources Management- By S.P. Aggarval spa@iirs.gov.in Indian Institute of Remote sensing ISRO, Department of space, Dehradun
Mumbai University, T.Y.B.Sc.(I.T.), Semester VI, Principles of Geographic Information System, USIT604, Discipline Specific Elective Unit 2: Data Management and Processing System
TYBSC IT PGIS Unit I Chapter I- Introduction to Geographic Information SystemsArti Parab Academics
A Gentle Introduction to GIS The nature of GIS: Some fundamental observations, Defining GIS, GISystems, GIScience and GIApplications, Spatial data and Geoinformation. The real world and representations of it: Models and modelling, Maps, Databases, Spatial databases and spatial analysis
basic concept of geographic data,GIS and its component,data acquisition ,raster, vector formats,spatial data,topology and data model data output ,GIS applications
2024.06.01 Introducing a competency framework for languag learning materials ...Sandy Millin
http://sandymillin.wordpress.com/iateflwebinar2024
Published classroom materials form the basis of syllabuses, drive teacher professional development, and have a potentially huge influence on learners, teachers and education systems. All teachers also create their own materials, whether a few sentences on a blackboard, a highly-structured fully-realised online course, or anything in between. Despite this, the knowledge and skills needed to create effective language learning materials are rarely part of teacher training, and are mostly learnt by trial and error.
Knowledge and skills frameworks, generally called competency frameworks, for ELT teachers, trainers and managers have existed for a few years now. However, until I created one for my MA dissertation, there wasn’t one drawing together what we need to know and do to be able to effectively produce language learning materials.
This webinar will introduce you to my framework, highlighting the key competencies I identified from my research. It will also show how anybody involved in language teaching (any language, not just English!), teacher training, managing schools or developing language learning materials can benefit from using the framework.
The Art Pastor's Guide to Sabbath | Steve ThomasonSteve Thomason
What is the purpose of the Sabbath Law in the Torah. It is interesting to compare how the context of the law shifts from Exodus to Deuteronomy. Who gets to rest, and why?
Palestine last event orientationfvgnh .pptxRaedMohamed3
An EFL lesson about the current events in Palestine. It is intended to be for intermediate students who wish to increase their listening skills through a short lesson in power point.
The Indian economy is classified into different sectors to simplify the analysis and understanding of economic activities. For Class 10, it's essential to grasp the sectors of the Indian economy, understand their characteristics, and recognize their importance. This guide will provide detailed notes on the Sectors of the Indian Economy Class 10, using specific long-tail keywords to enhance comprehension.
For more information, visit-www.vavaclasses.com
We all have good and bad thoughts from time to time and situation to situation. We are bombarded daily with spiraling thoughts(both negative and positive) creating all-consuming feel , making us difficult to manage with associated suffering. Good thoughts are like our Mob Signal (Positive thought) amidst noise(negative thought) in the atmosphere. Negative thoughts like noise outweigh positive thoughts. These thoughts often create unwanted confusion, trouble, stress and frustration in our mind as well as chaos in our physical world. Negative thoughts are also known as “distorted thinking”.
Welcome to TechSoup New Member Orientation and Q&A (May 2024).pdfTechSoup
In this webinar you will learn how your organization can access TechSoup's wide variety of product discount and donation programs. From hardware to software, we'll give you a tour of the tools available to help your nonprofit with productivity, collaboration, financial management, donor tracking, security, and more.
This is a presentation by Dada Robert in a Your Skill Boost masterclass organised by the Excellence Foundation for South Sudan (EFSS) on Saturday, the 25th and Sunday, the 26th of May 2024.
He discussed the concept of quality improvement, emphasizing its applicability to various aspects of life, including personal, project, and program improvements. He defined quality as doing the right thing at the right time in the right way to achieve the best possible results and discussed the concept of the "gap" between what we know and what we do, and how this gap represents the areas we need to improve. He explained the scientific approach to quality improvement, which involves systematic performance analysis, testing and learning, and implementing change ideas. He also highlighted the importance of client focus and a team approach to quality improvement.
1. Geographic Information Systems (GIS) store, analyze, and visualize data for geographic
positions on Earth’s surface. GIS stands for Geographic Information Systems and is a
computer-based tool that examines spatial relationships, patterns, and trends in
geography.
GIS
"A Geo Information System is
a system for capturing,
storing, checking,
integrating, manipulating,
analysing, and displaying
data which are spatially
referenced to the Earth.
(P.Stefanovic)
3. A GIS is an organized collection of computer hardware, software, geographic data, and
personnel designed to efficiently capture, store, update, manipulate, analyze, and display all
forms of geographically referenced information.
Hardware
Hardware is the computer on which a GIS operates. Today, GIS software runs on a wide
range of hardware types, from centralized computer servers to desktop computers used in
stand-alone or networked configurations.
Motherboard: It is board where major hardware parts are installed or It is a place where all
components gets hooked up.
Hard Drive: It is also called hard disk, place to store data.
Processor: Processor is the major component in computer, it performs calculation. It is
called as Central processing Unit (CPU).
RAM: Random Access Memory (RAM) where all running programs load temporarily.
Printer: It is output device and used to print image, map or document. There are various
type of printer available in market.
External Disk: These are portable storage space such as USB drive, DVD, CD or external disk.
Monitor: It is a screen for displaying output information. Nowadays there are various type
of monitor: CRT (cathode ray tube), LCD (Liquid Crystal Display), LED (Light Emitting Diodes)
and more.
4.
5. Software
GIS software provides the functions and tools needed to store, analyze, and display
geographic information. It helps to query, edit, run and display GIS data. It uses RDBMS
(Relational Database Management System) to store the data. Few GIS software list:
ArcGis, ArcView 3.2, QGIS, SAGA GIS.
Software Components:
GIS Tools: Key tools to support the browsing of the GIS data
RDBMS: Relational Database Management System to store GIS data. GIS Software
retrieve from RDBMS or insert data into RDBMS.
Query Tools: Tools that work with database management system for querying, insertion,
deletion and other SQL (Standard Query Language).
GUI: Graphical User Interface that helps user and Software to interact well.
Layout: Good layout window to design map.
6.
7. Data
Possibly the most important component of a GIS is the data. Geographic data and related
tabular data can be collected in-house or purchased from a commercial data provider. A
GIS will integrate spatial data with other data resources and can even use a DBMS, used
by most organizations to organize and maintain their data, to manage spatial data.
The data that a GIS operates on consists of any data bearing a definable relationship to
space, including any data about things and events that occur in nature. At one time this
consisted of hard-copy data, like traditional cartographic maps, surveyor’s logs,
demographic statistics, geographic reports, and descriptions from the field. Advances in
spatial data collection, classification, and accuracy have allowed more and more standard
digital base-maps to become available at different scales. Data are two types- Spatial and
Non spatial.
Spatial Data
Vector
Vector data is graphical representations of the real world. There are three main types of
vector data: points, lines, and polygons.
Connecting points create lines, and connecting lines that create an enclosed area create
polygons.
8. Point Data-
Data points, also known as data items, are the atomic state of data. Conceptually, you can
think of them as one cell in a data table, or one piece of information, about an
observation, at a given point in time.
Line Data-
Line (or arc) data is used to represent linear features. Common examples would be rivers,
trails, and streets. Line features only have one dimension and therefore can only be used
to measure length.
Area Data- Area data is used to represent polygon features. Common examples would be
forest, agricultural land, water body. Polygon features have two dimension and therefore
can be used to measure area.
9. Raster
Raster data is data that is presented in a grid of pixels. Each pixel within a raster has a
value, whether it be a colour or unit of measurement. This communicates information
about the element in question. Rasters typically refer to imagery. However, in the spatial
world, this may specifically refer to orthoimagery which are photos taken from satellites
or other aerial devices. Raster data quality varies depending on resolution and your task
at hand.
Attribute data are non-spatial characteristics that are connected by tables to points,
lines, “events” on lines, and polygons (and in some cases GRID cells)A point, vector or
raster geologic map might describe a “rock unit” on a map with a single number, letter or
name, but the associated attribute table might have age lithology percent quartz etc, for
each rock type on the map.
Data
Possibly the most important component of a GIS is the data. Geographic data and related
tabular data can be collected in-house or purchased from a commercial data provider. A
GIS will integrate spatial data with other data resources and can even use a DBMS, used
by most organizations to organize and maintain their data, to manage spatial data.
People
GIS technology is of limited value without the people who manage the system and
develop plans for applying it to real-world problems. GIS users range from technical
specialists who design and maintain the system to those who use it to help them
perform their everyday work.