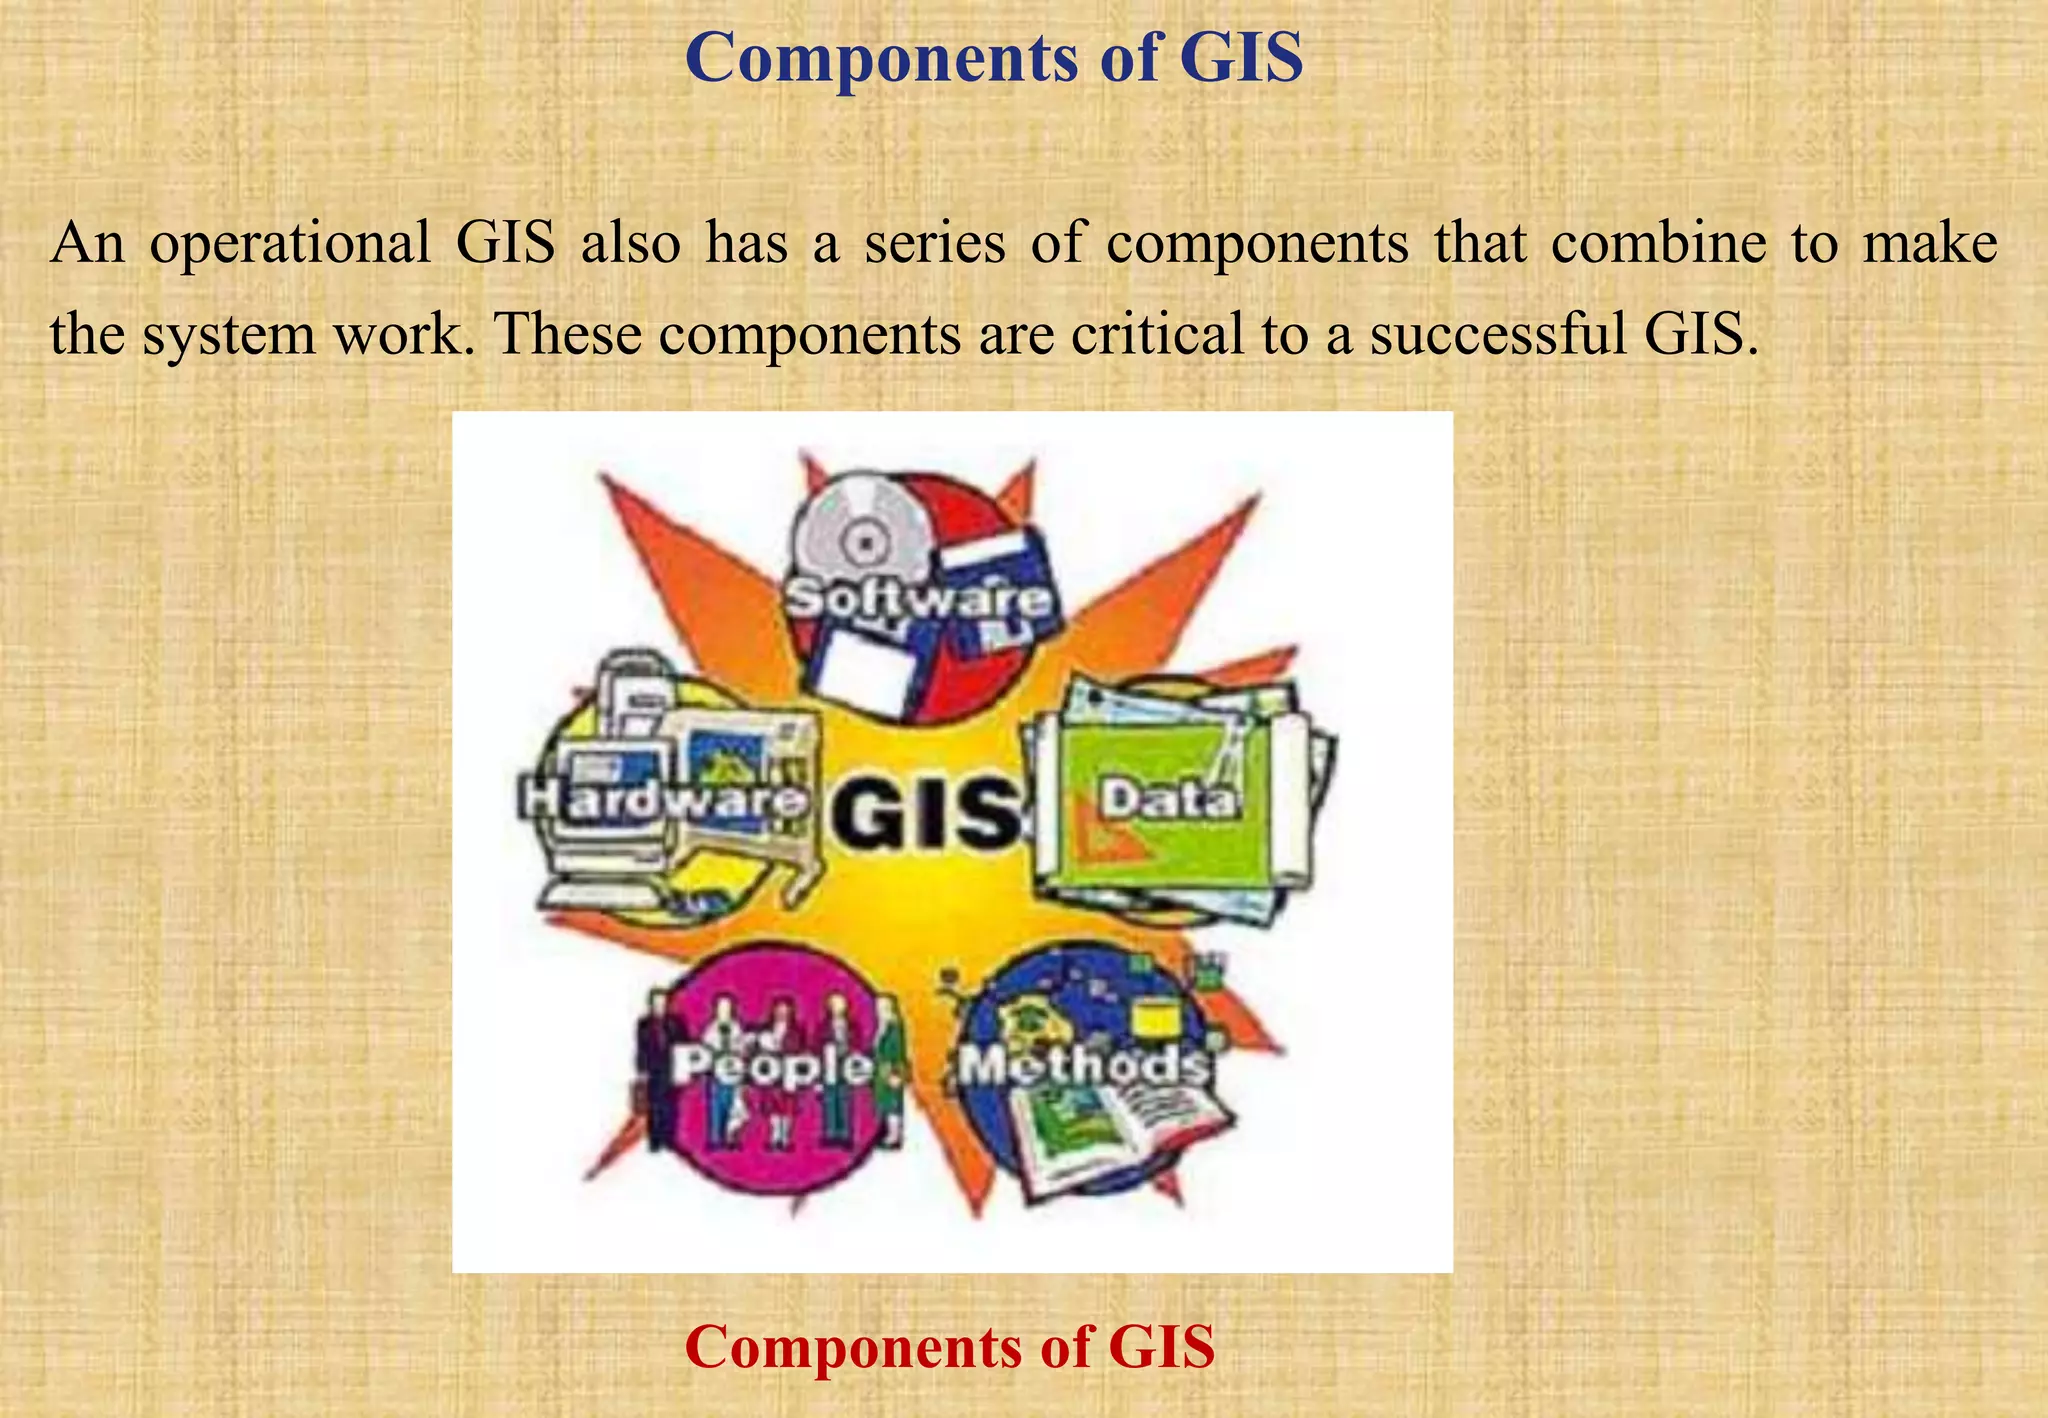
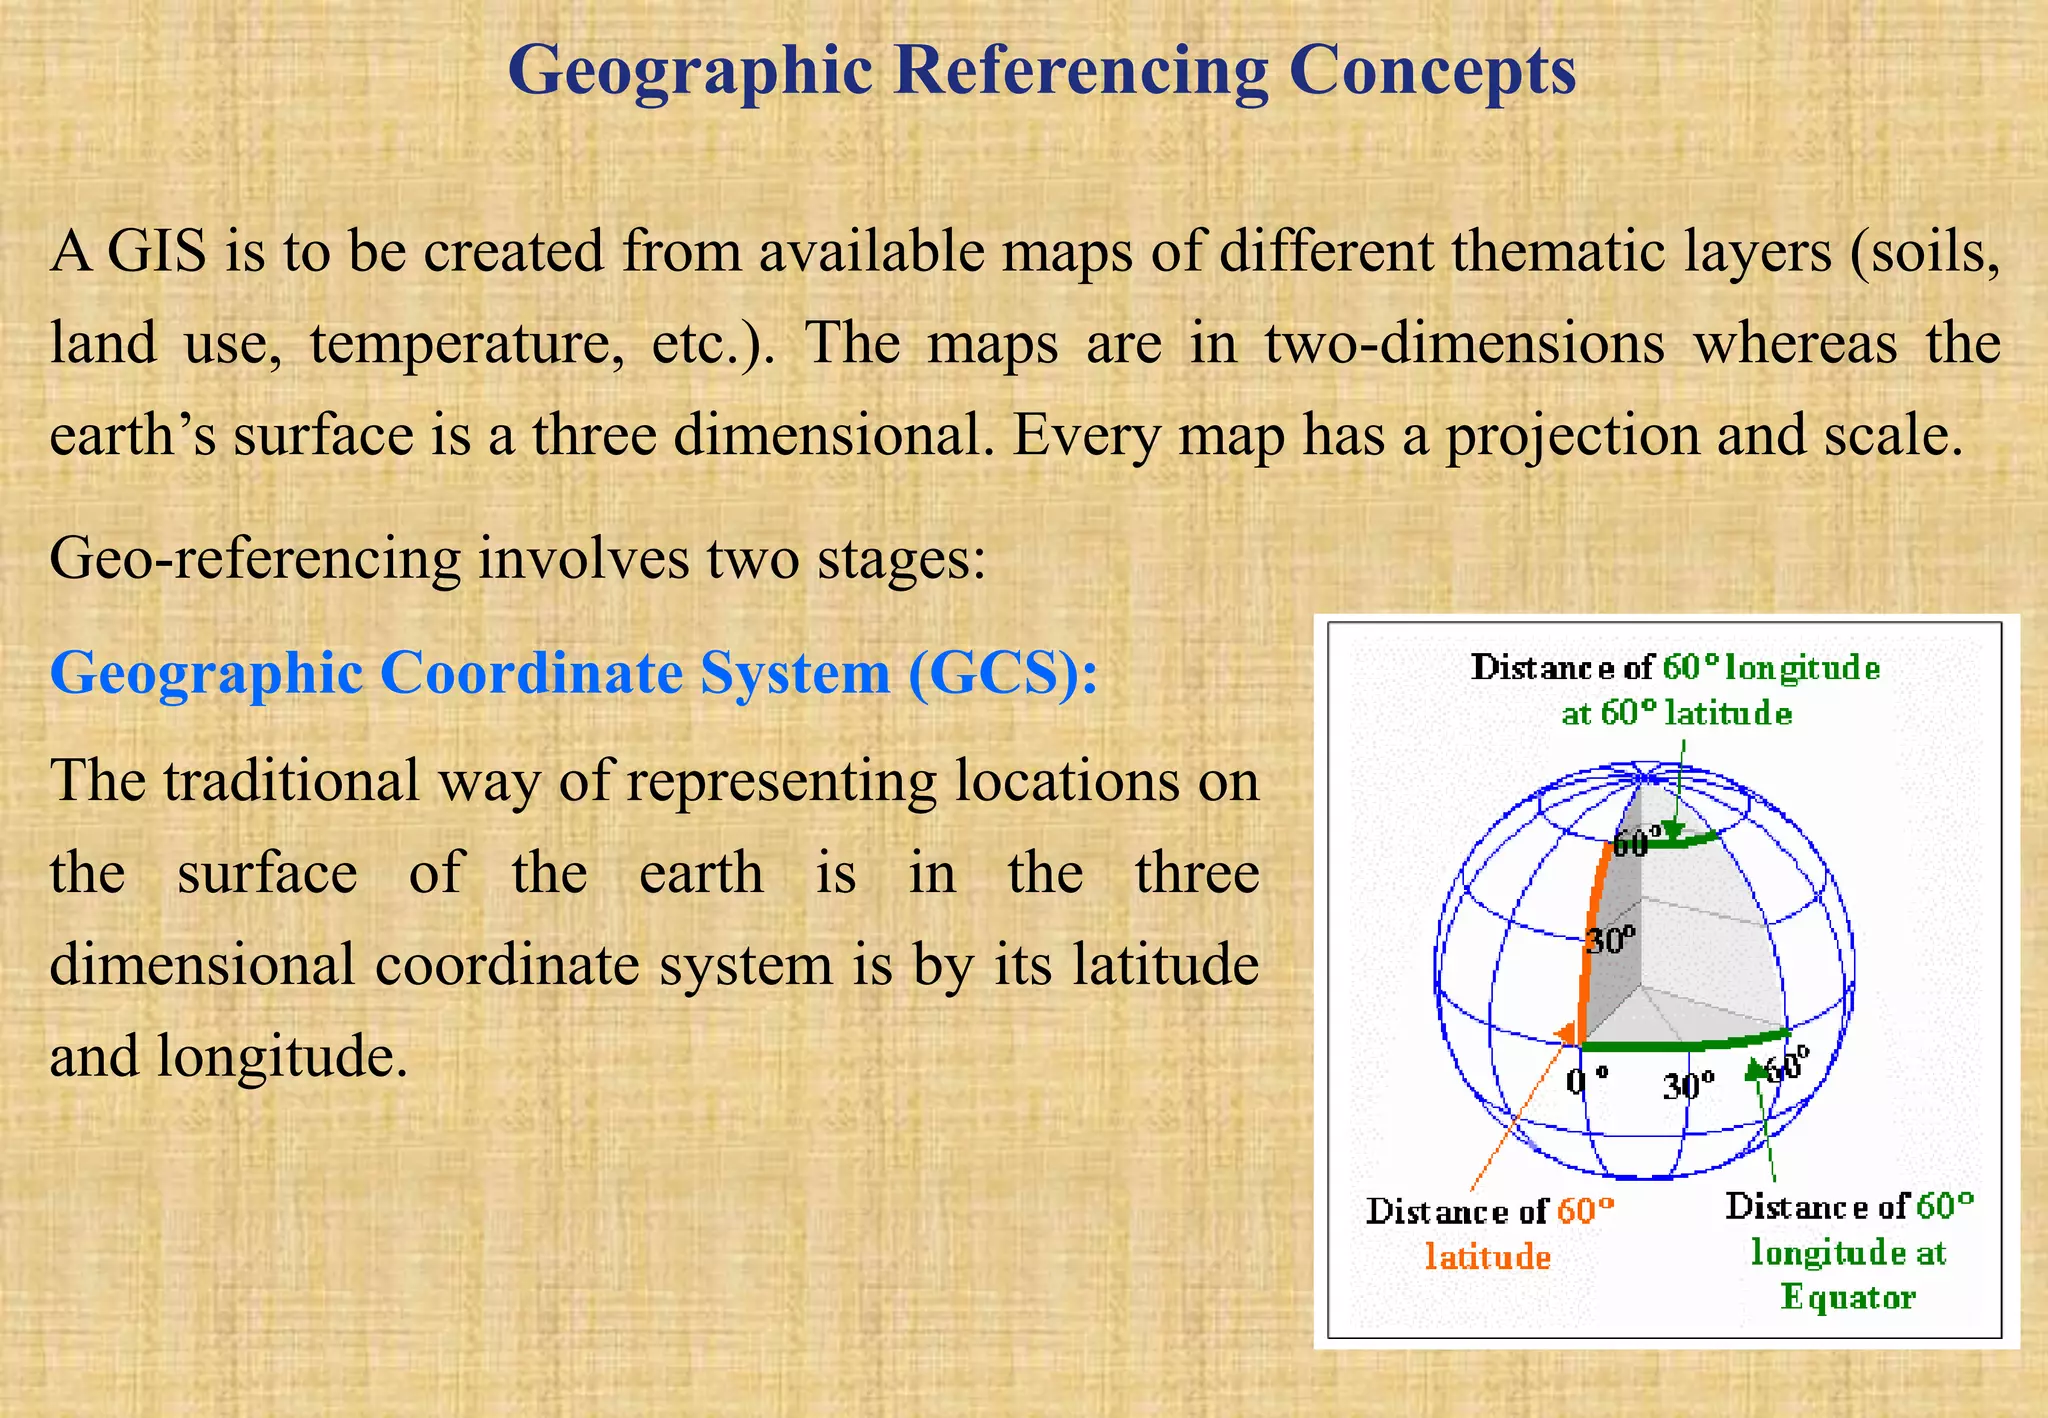
A Geographic Information System (GIS) integrates hardware, software and data to capture, store, manage, analyze and display spatially-referenced information. Key components of a GIS include hardware, software, data, methods, and personnel. GIS allows users to analyze spatial relationships, patterns and trends and answer "what if" questions. Common data types in GIS are spatial data, which represents geographic features and their attributes. Vector and raster are two main data structures, with different strengths for various uses. Geoprocessing tools allow manipulation of spatial data through operations like buffers, overlays and analysis.
DEFINITION :
GIS is a powerful set of tools for collecting, storing , retrieving at will, transforming and displaying spatial data from the real world for a particular set of purposes
APPLICATION AREAS OF GIS
Agriculture
Business
Electric/Gas utilities
Environment
Forestry
Geology
Hydrology
Land-use planning
Local government
Mapping
11. Military
12. Risk management
13. Site planning
14. Transportation
15. Water / Waste water industry
COMPONENTS OF GIS
DATA INPUT
SPATIAL DATA MODEL
Data Model:
It describes in an abstract way how the data is represented in an information system or in DBMS
Spatial Data Model :
The models or abstractions of reality that are intended to have some similarity with selected aspects of the real world
Creation of analogue and digital spatial data sets involves seven levels of model development and abstraction
SPATIAL DATA MODEL
Conceptual model : A view of reality
Analog model : Human conceptualization leads to analogue abstraction
Spatial data models : Formalization of analogue abstractions without any conventions
Database model : How the data are recorded in the computer
Physical computational model : Particular representation of the data structures in computer memory
Data manipulation model : Accepted axioms and rules for handling the data
SPATIAL DATA MODEL
SPATIAL DATA MODEL
Objects on the earth surface are shown as continuous and discrete objects in spatial data models
Types of data models
Raster data model
vector data models
RASTER DATA MODEL
Basic Elements :
Extent
Rows
Columns
Origin
Orientation
Resolution: pixel = grain = grid cell
Ex: Bit Map Image (BMP),Joint Photographic Expert Group (JPEG), Portable Network Graphics(PNG) etc
RASTER DATA MODEL
VECTOR DATA MODEL
Basic Elements:
Location (x,y) or (x,y,z)
Explicit, i.e. pegged to a coordinate system
Different coordinate system (and precision) require different values
o e.g. UTM as integer (but large)
o Lat, long as two floating point numbers +/-
Points are used to build more complex features
Ex: Auto CAD Drawing File(DWG), Data Interchange(exchange) File(DXF), Vector Product Format (VPF) etc
VECTOR DATA MODEL
RASTER vs VECTORRaster is faster but Vector is corrector
TESSELLATIONS OF CONTINUOUS FIELDS
Triangular Irregular Network: (TIN)
TIN is a vector data structure for representing geographical information that is continuous
Digital elevation model
TIN is generally used to create Digital Elevation Model (DEM)
DIGITAL ELEVATION MODEL
DATA STRUCTURES
Data structure tells about how the data is stored
Data organization in raster data structures
Each cell is referenced directly
Each overlay Is referenced directly
Each mapping unit is referenced directly
Each overlay is separate file with general header
Introduction to GIS - Basic spatial concepts - Coordinate Systems - GIS and Information Systems – Definitions – History of GIS - Components of a GIS – Hardware, Software, Data, People, Methods – Proprietary and open source Software - Types of data – Spatial, Attribute data- types of attributes – scales/ levels of measurements.
This presentation is about the raster and vector data in GIS which is important and costly as well, through the presentation we will learn about both type of data.
Topics:
1. Introduction to GIS
2. Components of GIS
3. Types of Data
4. Spatial Data
5. Non-Spatial Data
6. GIS Operations
7. Coordinate Systems
8. Datum
9. Map Projections
10. Raster Data Compression Techniques
11. GIS Software
12. Free GIS Data Resources
This document help you to prepare Triangulation Network (TIN), Hillshade Map, Slope map, interpolation and Digital Elevation Model (DEM) in a area and how to interpret them.
Types of Platforms
1. Airbrone Platforms
2. Spacebrone Platforms
Platforms are Vital Role in remote sensing data acquisition
Necessary to correct the position the remote sensors that collect data from the objects of interest
Digital Elevation Model (DEM) is the digital representation of the land surface elevation with respect to any reference datum. DEM is frequently used to refer to any digital representation of a topographic surface. DEM is the simplest form of digital representation of topography. GIS applications depend mainly on DEMs, today.
A geographic information system (GIS) is a system designed to capture, store, manipulate, analyze, manage, and present all types of geographical data. The acronym GIS is sometimes used for geographical information science or geospatial information studies to refer to the academic discipline or career of working with geographic information systems and is a large domain within the broader academic discipline of Geoinformatics. In the simplest terms, GIS is the merging of cartography, statistical analysis, and computer science technology.
This is presentation is intended for middle school students. It provides a short introduction to GIS and how to use GIS in the real-world.
ArcGIS Explorer is the software used to demonstrate concepts.
45 minutes + 15 minutes demo
Download ArcGIS Explorer here...
http://www.esri.com/software/arcgis/explorer/
An introduction to GIS Data Types. Strengths and weaknesses of raster and vector data are discussed. Also covered is the importance of topology. Concludes with a discussion of the vector-based format of OpenStreetMap data.
The basic intention of this presentation is to help the beginners in GIS to understand what GIS is? It is a simple presentation about GIS, i mean an introductory one. Hope anyone finds it useful.
TYBSC IT PGIS Unit I Chapter I- Introduction to Geographic Information SystemsArti Parab Academics
A Gentle Introduction to GIS The nature of GIS: Some fundamental observations, Defining GIS, GISystems, GIScience and GIApplications, Spatial data and Geoinformation. The real world and representations of it: Models and modelling, Maps, Databases, Spatial databases and spatial analysis
ABSTRACT: Geographical Information System is a new branch of information system in which system (GIS software) containing geographic data and converting useful information. The ability to integrate and analyze data organized in multiple thematic layers is a heart of Geographical Information System. Hardware, software, procedure, data and users are different components in which data is essential and core of GIS because without data GIS cannot work and cannot display the result.
GIS (Geographic Information System): is computer assisted system used for collecting, storing, retrieving at will, transforming and displaying spatial data from the real world for a particular set of purpose.
basic concept of geographic data,GIS and its component,data acquisition ,raster, vector formats,spatial data,topology and data model data output ,GIS applications
The Roman Empire A Historical Colossus.pdfkaushalkr1407
The Roman Empire, a vast and enduring power, stands as one of history's most remarkable civilizations, leaving an indelible imprint on the world. It emerged from the Roman Republic, transitioning into an imperial powerhouse under the leadership of Augustus Caesar in 27 BCE. This transformation marked the beginning of an era defined by unprecedented territorial expansion, architectural marvels, and profound cultural influence.
The empire's roots lie in the city of Rome, founded, according to legend, by Romulus in 753 BCE. Over centuries, Rome evolved from a small settlement to a formidable republic, characterized by a complex political system with elected officials and checks on power. However, internal strife, class conflicts, and military ambitions paved the way for the end of the Republic. Julius Caesar’s dictatorship and subsequent assassination in 44 BCE created a power vacuum, leading to a civil war. Octavian, later Augustus, emerged victorious, heralding the Roman Empire’s birth.
Under Augustus, the empire experienced the Pax Romana, a 200-year period of relative peace and stability. Augustus reformed the military, established efficient administrative systems, and initiated grand construction projects. The empire's borders expanded, encompassing territories from Britain to Egypt and from Spain to the Euphrates. Roman legions, renowned for their discipline and engineering prowess, secured and maintained these vast territories, building roads, fortifications, and cities that facilitated control and integration.
The Roman Empire’s society was hierarchical, with a rigid class system. At the top were the patricians, wealthy elites who held significant political power. Below them were the plebeians, free citizens with limited political influence, and the vast numbers of slaves who formed the backbone of the economy. The family unit was central, governed by the paterfamilias, the male head who held absolute authority.
Culturally, the Romans were eclectic, absorbing and adapting elements from the civilizations they encountered, particularly the Greeks. Roman art, literature, and philosophy reflected this synthesis, creating a rich cultural tapestry. Latin, the Roman language, became the lingua franca of the Western world, influencing numerous modern languages.
Roman architecture and engineering achievements were monumental. They perfected the arch, vault, and dome, constructing enduring structures like the Colosseum, Pantheon, and aqueducts. These engineering marvels not only showcased Roman ingenuity but also served practical purposes, from public entertainment to water supply.
Palestine last event orientationfvgnh .pptxRaedMohamed3
An EFL lesson about the current events in Palestine. It is intended to be for intermediate students who wish to increase their listening skills through a short lesson in power point.
Ethnobotany and Ethnopharmacology:
Ethnobotany in herbal drug evaluation,
Impact of Ethnobotany in traditional medicine,
New development in herbals,
Bio-prospecting tools for drug discovery,
Role of Ethnopharmacology in drug evaluation,
Reverse Pharmacology.
Operation “Blue Star” is the only event in the history of Independent India where the state went into war with its own people. Even after about 40 years it is not clear if it was culmination of states anger over people of the region, a political game of power or start of dictatorial chapter in the democratic setup.
The people of Punjab felt alienated from main stream due to denial of their just demands during a long democratic struggle since independence. As it happen all over the word, it led to militant struggle with great loss of lives of military, police and civilian personnel. Killing of Indira Gandhi and massacre of innocent Sikhs in Delhi and other India cities was also associated with this movement.
Unit 8 - Information and Communication Technology (Paper I).pdfThiyagu K
This slides describes the basic concepts of ICT, basics of Email, Emerging Technology and Digital Initiatives in Education. This presentations aligns with the UGC Paper I syllabus.
Welcome to TechSoup New Member Orientation and Q&A (May 2024).pdfTechSoup
In this webinar you will learn how your organization can access TechSoup's wide variety of product discount and donation programs. From hardware to software, we'll give you a tour of the tools available to help your nonprofit with productivity, collaboration, financial management, donor tracking, security, and more.
The Indian economy is classified into different sectors to simplify the analysis and understanding of economic activities. For Class 10, it's essential to grasp the sectors of the Indian economy, understand their characteristics, and recognize their importance. This guide will provide detailed notes on the Sectors of the Indian Economy Class 10, using specific long-tail keywords to enhance comprehension.
For more information, visit-www.vavaclasses.com
Synthetic Fiber Construction in lab .pptxPavel ( NSTU)
Synthetic fiber production is a fascinating and complex field that blends chemistry, engineering, and environmental science. By understanding these aspects, students can gain a comprehensive view of synthetic fiber production, its impact on society and the environment, and the potential for future innovations. Synthetic fibers play a crucial role in modern society, impacting various aspects of daily life, industry, and the environment. ynthetic fibers are integral to modern life, offering a range of benefits from cost-effectiveness and versatility to innovative applications and performance characteristics. While they pose environmental challenges, ongoing research and development aim to create more sustainable and eco-friendly alternatives. Understanding the importance of synthetic fibers helps in appreciating their role in the economy, industry, and daily life, while also emphasizing the need for sustainable practices and innovation.
The French Revolution, which began in 1789, was a period of radical social and political upheaval in France. It marked the decline of absolute monarchies, the rise of secular and democratic republics, and the eventual rise of Napoleon Bonaparte. This revolutionary period is crucial in understanding the transition from feudalism to modernity in Europe.
For more information, visit-www.vavaclasses.com
2. What is GIS
A Geographic Information System (GIS) integrates hardware, software, and
data for capturing, managing, analyzing, and displaying all forms of
geographically referenced information. It is a computerized data management
system used to capture, store, manage, retrieve, analyze, and display spatial
information. GIS is a technological field that incorporates geographical
features with tabular data in order to map, analyze, and assess real-world
problems. With a GIS it is possible to map, model, query and analyze large
quantities of data. A GIS helps you answer questions and solve problems by
looking at your data in a way that is quickly understood and easily shared.
There are three integrating part in a GIS:
Geographic : The spatial realities of the real world
Information : The meaning and use of data
Systems : The computer technology and support infrastructure
3. Definition of GIS
“A geographic information system is a special case of information systems
where the database consists of observations on spatially distributed features,
activities or events, which are definable in space as points, lines, or areas. A
geographic information system manipulates data about these points, lines,
and areas to retrieve data for ad hoc queries and analyses” (Kenneth
Dueker, Portland State University, 1979).
“A powerful set of tools for collection, storing, retrieving at will
transforming and displaying spatial data from the real world”
Burrough,1986
“A system for capturing , storing, checking, integrating, manipulating,
analyzing and displaying data which are spatially referenced on the earth ”
Chorley, 1987
4. Definition of GIS
“GIS is a configuration of computer hardware and software specifically
designed for the acquisition, maintenance and use of cartographic data”
Tomlin,1990
A geographic information system (GIS) is a computer-based tool for
mapping and analyzing things that exist and events that happen on earth. GIS
technology integrates common database operations such as query and
statistical analysis with the unique visualization and geographic analysis
benefits offered by maps.” ESRI
“GIS is an integrated system of computer hardware, software, and trained
personnel linking topographic, demographic, utility, facility, image and other
resource data that is geographically referenced.” NASA
5. History of GIS
One of the first applications of spatial analysis in epidemiology is the 1832
"Rapport sur la marche et les effets du choléra dans Paris et le département
de la Seine". The French geographer Charles Piquet represented the
48 districts of the city of Paris by halftone color gradient according to the
percentage of deaths by cholera per 1,000 inhabitants.
In 1854 John Snow depicted a cholera outbreak in London using points to
represent the locations of some individual cases, possibly the earliest use of a
geographic methodology in epidemiology. His study of the distribution of
cholera led to the source of the disease, a contaminated water pump (the Broad
Street Pump, whose handle he disconnected, thus terminating the outbreak).
6. History of GIS
The early 20th century saw the development of photozincography, which
allowed maps to be split into layers, for example one layer for vegetation and
another for water. This was particularly used for printing contours – drawing
these was a labor-intensive task but having them on a separate layer meant they
could be worked on without the other layers to confuse the draughtsman.
The year 1960 saw the development of the world's first true operational GIS in
Ottawa, Ontario, Canada by the federal Department of Forestry and Rural
Development. Developed by Dr. Roger Tomlinson, it was called the Canada
Geographic Information System (CGIS) and was used to store, analyze, and
manipulate data collected for the Canada Land Inventory – an effort to
determine the land capability for rural Canada by mapping information about
soils, agriculture, recreation, wildlife, waterfowl, forestry and land use at a
scale of 1:50,000.
7. History of GIS
In 1986, Mapping Display and Analysis System (MIDAS), the first desktop
GIS product emerged for the DOS operating system. This was renamed in
1990 to MapInfo for Windows when it was ported to the Microsoft Windows
platform. This began the process of moving GIS from the research
department into the business environment.
The first known use of the term "Geographic Information System" was by
Roger Tomlinson in the year 1968 in his paper "A Geographic Information
System for Regional Planning“. Tomlinson is also acknowledged as the
"father of GIS”
8. Why GIS Differs from other Graphics Systems
GIS differs from other graphics systems in several respects.
In GIS data are geo-referenced to the coordinates of a particular projection
system. This allows precise placement of features on the earth’s surface
and maintains the spatial relationships between mapped features. As a
result, commonly referenced data can be overlaid to determine
relationships between data elements.
GIS software use relational database management technologies to assign a
series of attributes to each spatial feature. Common feature identification
keys are used to link the spatial and attribute data between tables.
GIS provide the capability to combine various data into a composite data
layer that may become a base layer in a database.
9. Why GIS Differs from other Graphics Systems
GIS allows multiple layers of information to be displayed on
a single map.
10. What A GIS Can Do
There are five basic questions which a complete GIS must answer. These are:
What exists at a particular location (What is at?): The first of these
question seeks to find out what exists at a particular location. For Example,
Place name, Post code / Zip code or geographic reference such as latitude,
longitude. For a location, the GIS must describe the features of that location.
Where can specific features be found(Where is it?): This is the converse
of the first question. It query for a condition. For example, where are the
districts with rainfall greater than 500 mm and less than less than 750 mm?
Trends (What has changed over time?):
This involves answering both questions above. It seeks to find the difference
within an area over time. For example, at what locations are the crop yields
showing declining trends?
11. What A GIS Can Do
Patterns (What spatial patterns exist?): This question is more
sophisticated. If occurrence of a pest is associated with a hypothesized set of
conditions of temperature, precipitation, humidity, where do those conditions
exist?
Modelling (What if … ?) Questions are posed to determine what happens.
This is a higher level application of GIS and answers questions like what
would be the nitrate distribution in groundwater over the area if fertilizer use
is doubled?
12. Components of GIS
An operational GIS also has a series of components that combine to make
the system work. These components are critical to a successful GIS.
Components of GIS
13. Components of GIS
Hardware:
Hardware is the computer system on which a GIS operates. The function of
these components is typically divided into three main categories: Input,
Storage and Output. The general hardware components of a GIS system is
the Central Processing Unit (CPU). It is linked to a disk drive storage unit,
which provide space for storing data and programs. A digitizer, scanner and
other device is use to input data from maps and documents into digital form.
A plotter or other display device is use to present the result of data
processing.
14. Components of GIS
Software:
Software are computer programs; instructions that cause the hardware to do
work. GIS software are application software. GIS software provides the
functions and tools needed to store, analyze, and display geographic
information. Some popular GIS software is: Arc Info, ArcView, ArcGIS,
QGIS, GRASS GIS,ER Mapper.
15. Components of GIS
Data:
Perhaps the most important component of a GIS is the data. Without data
GIS can do nothing. Geographic data and related tabular data can be
collected in-house, compiled to custom specifications and requirements, or
occasionally purchased from a commercial data provider. A GIS can integrate
spatial data with other existing data resources, often stored in a corporate
DBMS. The integration of spatial data and tabular data stored in a DBMS is
a key functionality afforded by GIS.
16. Components of GIS
Method:
A successful GIS operates according to a well-designed implementation plan
and business rules, which are the models and operating practices unique to
each organization. Methods include how the data will be input into the
system, storage, manage, analyzed and finally presented in a map as a final
output. The methods are the steps taken answer the question need to be
answer. Failure to implement your GIS without regard for a proper
organizational commitment will result in an unsuccessful system.
17. Components of GIS
People/ Livewire:
Livewire/people means who are expert and engaged to run GIS software.
GIS technology is of limited value without the people who manage the
system and develop plans for applying it to real world problems. GIS users
range from technical specialists who design and maintain the system to those
who use it to help them perform their everyday work. To run GIS software
and buildup meaningful and potential logics we need expert Livewire.
18. Geographic Referencing Concepts
A GIS is to be created from available maps of different thematic layers (soils,
land use, temperature, etc.). The maps are in two-dimensions whereas the
earth’s surface is a three dimensional. Every map has a projection and scale.
Geo-referencing involves two stages:
Geographic Coordinate System (GCS):
The traditional way of representing locations on
the surface of the earth is in the three
dimensional coordinate system is by its latitude
and longitude.
19. Geographic Referencing Concepts
Projected Coordinate System (PCS):
The development of GIS starts with an available map on paper (an analogue
map). This map therefore represents a projection of a Three-dimensions GCS
in Two-dimensional form. Projection is a mathematical transformation used
to project the real Three-dimensional spherical surface of the earth in Two-
dimensions on a plane sheet of paper.
21. GIS Data Types
The basic data type in a GIS reflects traditional data found on a map.
Accordingly, GIS technology utilizes two basic types of data. These are:
Spatial Data
GIS Data
Attribute Data
22. GIS Data Types
The basic data type in a GIS reflects traditional data found on a map.
Accordingly, GIS technology utilizes two basic types of data. These are:
Spatial Data
GIS Data
Attribute Data
23. Advantages and Disadvantages of Vector and Raster data
Advantages of Vector Data:
1. Data can be represented at its original resolution and form without
generalization.
2. Graphic output is usually more aesthetically pleasing (traditional
cartographic representation);
3. Since most data, e.g. hard copy maps, is in vector form no data conversion
is required.
4. Accurate geographic location of data is maintained.
5. Allows for efficient encoding of topology, and as a result more efficient
operations that require topological information, e.g. proximity, network
analysis.
24. Advantages and Disadvantages of Vector and Raster data
Disadvantages of Vector Data:
1. The location of each vertex needs to be stored explicitly.
2. For effective analysis, vector data must be converted into a topological
structure. This is often processing intensive and usually requires extensive
data cleaning. As well, topology is static, and any updating or editing of the
vector data requires re-building of the topology.
3. Algorithms for manipulative and analysis functions are complex and may
be processing intensive. Often, this inherently limits the functionality for
large data sets, e.g. a large number of features.
4. Continuous data, such as elevation data, is not effectively represented in
vector form. Usually substantial data generalization or interpolation is
required for these data layers.
5. Spatial analysis and filtering within polygons is impossible.
25. Advantages and Disadvantages of Vector and Raster data
Advantages of Raster Data:
1. The geographic location of each cell is implied by its position in the cell
matrix. Accordingly, other than an origin point, e.g. bottom left corner, no
geographic coordinates are stored.
2. Due to the nature of the data storage technique data analysis is usually easy
to program and quick to perform.
3. The inherent nature of raster maps, e.g. one attribute maps, is ideally suited
for mathematical modeling and quantitative analysis.
4. Discrete data, e.g. forestry stands, is accommodated equally well as
continuous data, e.g. elevation data, and facilitates the integrating of the two
data types.
5. Grid-cell systems are very compatible with raster-based output devices,
e.g. electrostatic plotters, graphic terminals.
26. Advantages and Disadvantages of Vector and Raster data
Disadvantages of Raster Data:
1. The cell size determines the resolution at which the data is represented.;
2. It is especially difficult to adequately represent linear features depending
on the cell resolution. Accordingly, network linkages are difficult to establish.
3. Processing of associated attribute data may be cumbersome if large
amounts of data exists. Raster maps inherently reflect only one attribute or
characteristic for an area.
4. Since most input data is in vector form, data must undergo vector-to-raster
conversion. Besides increased processing requirements this may introduce
data integrity concerns due to generalization and choice of inappropriate cell
size.
5. Most output maps from grid-cell systems do not conform to high-quality
cartographic needs.
27. Difference Between Vector and Raster data
Though Raster and Vector are the two basic data structures for GIS, these
have some basic difference. The difference of Raster and Vector data are
given below.
Victor Data Raster Data
Vector data comes in the form of points
and lines that are geometrically and
mathematically associated.
Raster data comes in the form of individual
pixels, and each spatial location or
resolution element has a pixel associated
where the pixel value indicates the
attribute.
Vector data structure produces smaller file
size.
Raster data structure produces bigger/huge
file size.
A representation of the world using points,
lines, and polygons.
A representation of the world as a surface
divided into a regular grid of cells.
It has a relatively compact data structure . It has a simple data structure.
28. Difference Between Vector and Raster data
Victor Data Raster Data
Overlay operations are difficult to
implement.
Overlay operations are easily and efficiently
implemented.
Vector data use X and Y coordinates to
define the locations of points, lines, and areas
Raster data use a matrix of square areas to
define where features are located.
Topology among graphical objects are much
easier to represent.
Topological relationship are difficult to
present.
Commonly shared edge can be easily defined
according to its left and right side polygons
Commonly shared edge is almost impossible
or very difficult to do with pixels.
Linear type analysis are easily performed Area and polygon analysis performed.
29. Geodatabase
A Geodatabase or spatial database is a database that is optimized to store and
query data that represents objects defined in a geometric space. Most spatial
databases allow representing simple geometric objects such as points, lines
and polygons. Some spatial databases handle more complex structures such
as 3D objects, topological coverage, linear networks.
Geodatabases have a comprehensive information model for representing and
managing geographic information. This comprehensive information model is
implemented as a series of tables holding feature classes, raster datasets, and
attributes. In addition, advanced GIS data objects add GIS behavior; rules
for managing spatial integrity; and tools for working with numerous spatial
relationships of the core features, raster, and attributes.
30. Buffer Analysis
Buffer analysis is used for identifying areas surrounding geographic features.
The process involves generating a buffer around existing geographic features
and then identifying or selecting features based on whether they fall inside or
outside the boundary of the buffer.
Buffering in general refers the creation of a zone of a specified width around
a point or a line or a polygon area. If is also referred to as a zone of specified
distance around coverage features.
Types of Buffer: In general there are two types of buffers.
1. Buffer with round edge
2. Buffer with Flat edge.
31. There are many advantages to using buffers in GIS.
1. Buffers can be applied to both vector and raster data, which is abnormal for
most GIS operations.
2. A buffer made in raster format is unlike one made in vector. In vector a
new object is formed in the shape of a buffer, however in raster, cells are
merely classified to whether they are inside or outside the buffer zone.
3. Using buffers in GIS is the ability to use multiple rings for varying buffer
distances.
Advantage Buffer:
Buffer Analysis
32. Geoprocessing
A set of tools and processes that can be used separately or be combined to
complete spatial tasks and analysis. Geoprocessing is a GIS operation used
to manipulate spatial data. A typical geoprocessing operation takes an input
dataset, performs an operation on that dataset, and returns the result of the
operation as an output dataset. Common geoprocessing operations include
geographic feature overlay, feature selection and analysis, topology
processing, raster processing, and data conversion. Geoprocessing allows
for definition, management, and analysis of information used to form
decisions.
Geoprocessing tools are:
1. Clip 2. Intersect
3. Union 4. Buffer
4. Multiple Ring Buffer 5. Append
6. Merge 7. Dissolve
33. Digital Elevation Model (DEM)
A set of tools and processes that can be used separately or be combined to
complete spatial tasks and analysis. Geoprocessing is a GIS operation used
to manipulate spatial data. A typical geoprocessing operation takes an input
dataset, performs an operation on that dataset, and returns the result of the
operation as an output dataset. Common geoprocessing operations include
geographic feature overlay, feature selection and analysis, topology
processing, raster processing, and data conversion. Geoprocessing allows
for definition, management, and analysis of information used to form
decisions.
Geoprocessing tools are:
1. Clip 2. Intersect
3. Union 4. Buffer
4. Multiple Ring Buffer 5. Append
6. Merge 7. Dissolve