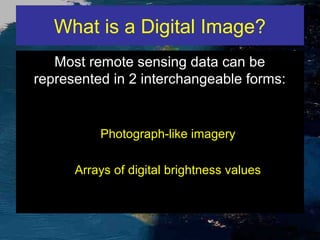
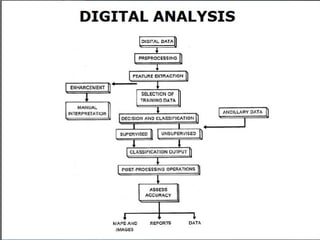
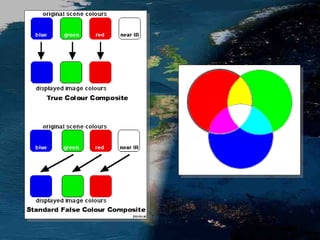
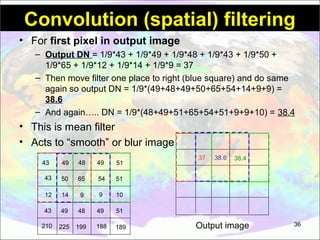
This document provides an introduction to digital image interpretation. It discusses what digital images are, how they can be displayed in color composites, and how surface features typically appear on true and false color composites. It also outlines the main steps in digital image processing, including preprocessing, enhancement, transformation, and classification. Preprocessing operations like radiometric and geometric corrections are described in detail. Methods for image registration, resampling, and spatial filtering are also explained. Spatial filters can be used for tasks like edge detection, image smoothing, and enhancing linear features. Examples demonstrate the effects of low-pass filtering for speckle removal and high-pass edge detection.
IMAGE INTERPRETATION TECHNIQUES of surveyKaran Patel
Image interpretation is the process of examining an aerial photo or digital remote sensing image and manually identifying the features in that image. This method can be highly reliable and a wide variety of features can be identified, such as riparian vegetation type and condition, and anthropogenic features
IMAGE INTERPRETATION
Act of examining images to identify objects and judge their significance.
Information extraction process from the images.
An interpreter is a specialist trained in study of photography or imagery, in addition to his own discipline.
Aerial photographs and remote Sensing images employ electro magnetic energy as the mean of detecting and measuring target characteristics.
Involves a considerable amount of subjective judgment.
Highly dependent on capability of mind to generalize.
Takes place at different levels of complexity.
This presentation is about the raster and vector data in GIS which is important and costly as well, through the presentation we will learn about both type of data.
hyperspectral remote sensing and its geological applicationsabhijeet_banerjee
this is an introductory presentation on hyperspectral remote sensing, which essential deals with the distinguishing features, imaging spectrometers and its types, and some of the geological applications of hyperspectral remote sensing.
Role of electromagnetic Radiation in Remote SensingNzar Braim
Role of electromagnetic Radiation in Remote Sensing
It should be clear by now that the electromagnetic waves are originator and
carrier of information in Earth observation. The information content of the products delivered by a given type of sensor is essentially related to the parameters, mainly frequency (or wavelength) and polarization, characterizing the observing system, including the geometry at which data are acquired. Therefore, the specifications of an EO system, which include the type of sensor, the band of operation, the observation angle, etc.
RS & GIS, Image Interpretation, Methods of Image interpretation, Types of interpretation, Factors governing image interpretation, Activities to interpret image, Sensors, Role of sensors in Image derivation, Aerial Photography, LISS-3, Image characteristics, Special characteristics, Shadow, Texture, Pattern, associated features in images
this presentation briefly describes the digital image processing and its various procedures and techniques which include image correction or rectification with remote sensing data/ images. it also contains various image classification techniques.
Radiometric corrections include correcting the data for sensor irregularities and unwanted sensor or atmospheric noise, and converting the data so they accurately represent the reflected or emitted radiation measured by the sensor.
Image reconstruction in CT is mostly a mathematical process however, this presentation tries to explain the complicated process of image reconstruction in a visual way, mainly focusing om Filtered back projection, Iterative Reconstruction and AI based image reconstruction.
Digital Image Processing is the manipulation of the digital data with the help of the computer hardware and software to produce digital maps in which specific information has been extracted and highlighted. Visual image interpretation techniques have certain disadvantages and may require extensive training and are labor intensive.
In this technique, the spectral characteristics are not always fully evaluated because of the limited ability of the eye to discern tonal value and analyze the spectral changes.
If the data are in digital mode, the remote sensing data can be analyzed using digital image processing techniques and such a data base can be used in Raster GIS.
In applications where spectral patterns are more informative, it is preferable to analyze digital data rather than pictorial data.
Satellite remote sensing data in general and digital data in particular have been used as basic inputs for the inventory and mapping of natural resources of the earth surface like forestry, soils, geology and agriculture.
Space borne remote sensing data suffer from a variety of radiometric, atmospheric and geometric errors, earth‟s rotation and so on.
These distortions would diminish the accuracy of the information extracted and reduce the utility of the data. So these errors required to be corrected.
Performance analysis of high resolution images using interpolation techniques...sipij
This paper presents various types of interpolation techniques to obtain a high quality image The difference
between the proposed algorithm and conventional algorithms (in estimation of missing pixel value) is that
if standard deviation of image is used to calculate pixel value rather than the value of nearmost neighbor,
the image gives the better result. The proposed method demonstrated higher performances in terms of
PSNR and SSIM when compared to the conventional interpolation algorithms mentioned.
At the end of this lesson, you should be able to;
describe spatial resolution
describe intensity resolution
identify the effect of aliasing
describe image interpolation
describe relationships among the pixels
Image Interpolation Techniques with Optical and Digital Zoom Concepts -semina...mmjalbiaty
full details about Spatial and Intensity Resolution , optical and digital zoom concepts and the common three interpolation algorithms for implementing zoom in image processing
Similar to Digital image processing and interpretation (20)
Nano Technology for UG students of AgricultureP.K. Mani
Brief introduction of Nano Science and Nanotechnology at UG level for the students of Agriculture. Smart delivery of Fertilizers pesticides, smart seed, nano biosensors etc dealt.
Geomorphology at a glance: Major landformsP.K. Mani
Geomorphology, Major landforms, Genetic landform classifications, Volcanic landforms, River Systems and Fluvial Landforms, Aeolian Landforms, Glacial Landforms
Geologic time scale, Uniformitarianism, Catastrophic concept, Geomorphic process-agent cause and product, Hutton's concept, Davis Concept, Darwin's concept, Gilbert's concept
COMPARATIVE ADVANTAGE OF SRI OVER TRANSPLANTED RICE IN TERMS OF YIELD A...P.K. Mani
Advantage of SRI over Conventionally Transplanted Rice are discussed on the following Parameters: Yield and Yield Attributing Characters, Water Productivity, Soil Properties, Nitrogen Use Efficiency ,Phosphorus and Potassium use efficiency, Ammonia Loss and Microbiological Properties.
Effect of minimum tillage and Mulching on nutrient Transformation in rice bas...P.K. Mani
Paper presented at PAU, LUdhiana, 2012 describing nutrient transformation in rice based cropping system following zero tillage vs conventional tillage.
The Roman Empire A Historical Colossus.pdfkaushalkr1407
The Roman Empire, a vast and enduring power, stands as one of history's most remarkable civilizations, leaving an indelible imprint on the world. It emerged from the Roman Republic, transitioning into an imperial powerhouse under the leadership of Augustus Caesar in 27 BCE. This transformation marked the beginning of an era defined by unprecedented territorial expansion, architectural marvels, and profound cultural influence.
The empire's roots lie in the city of Rome, founded, according to legend, by Romulus in 753 BCE. Over centuries, Rome evolved from a small settlement to a formidable republic, characterized by a complex political system with elected officials and checks on power. However, internal strife, class conflicts, and military ambitions paved the way for the end of the Republic. Julius Caesar’s dictatorship and subsequent assassination in 44 BCE created a power vacuum, leading to a civil war. Octavian, later Augustus, emerged victorious, heralding the Roman Empire’s birth.
Under Augustus, the empire experienced the Pax Romana, a 200-year period of relative peace and stability. Augustus reformed the military, established efficient administrative systems, and initiated grand construction projects. The empire's borders expanded, encompassing territories from Britain to Egypt and from Spain to the Euphrates. Roman legions, renowned for their discipline and engineering prowess, secured and maintained these vast territories, building roads, fortifications, and cities that facilitated control and integration.
The Roman Empire’s society was hierarchical, with a rigid class system. At the top were the patricians, wealthy elites who held significant political power. Below them were the plebeians, free citizens with limited political influence, and the vast numbers of slaves who formed the backbone of the economy. The family unit was central, governed by the paterfamilias, the male head who held absolute authority.
Culturally, the Romans were eclectic, absorbing and adapting elements from the civilizations they encountered, particularly the Greeks. Roman art, literature, and philosophy reflected this synthesis, creating a rich cultural tapestry. Latin, the Roman language, became the lingua franca of the Western world, influencing numerous modern languages.
Roman architecture and engineering achievements were monumental. They perfected the arch, vault, and dome, constructing enduring structures like the Colosseum, Pantheon, and aqueducts. These engineering marvels not only showcased Roman ingenuity but also served practical purposes, from public entertainment to water supply.
The Indian economy is classified into different sectors to simplify the analysis and understanding of economic activities. For Class 10, it's essential to grasp the sectors of the Indian economy, understand their characteristics, and recognize their importance. This guide will provide detailed notes on the Sectors of the Indian Economy Class 10, using specific long-tail keywords to enhance comprehension.
For more information, visit-www.vavaclasses.com
This is a presentation by Dada Robert in a Your Skill Boost masterclass organised by the Excellence Foundation for South Sudan (EFSS) on Saturday, the 25th and Sunday, the 26th of May 2024.
He discussed the concept of quality improvement, emphasizing its applicability to various aspects of life, including personal, project, and program improvements. He defined quality as doing the right thing at the right time in the right way to achieve the best possible results and discussed the concept of the "gap" between what we know and what we do, and how this gap represents the areas we need to improve. He explained the scientific approach to quality improvement, which involves systematic performance analysis, testing and learning, and implementing change ideas. He also highlighted the importance of client focus and a team approach to quality improvement.
How to Make a Field invisible in Odoo 17Celine George
It is possible to hide or invisible some fields in odoo. Commonly using “invisible” attribute in the field definition to invisible the fields. This slide will show how to make a field invisible in odoo 17.
We all have good and bad thoughts from time to time and situation to situation. We are bombarded daily with spiraling thoughts(both negative and positive) creating all-consuming feel , making us difficult to manage with associated suffering. Good thoughts are like our Mob Signal (Positive thought) amidst noise(negative thought) in the atmosphere. Negative thoughts like noise outweigh positive thoughts. These thoughts often create unwanted confusion, trouble, stress and frustration in our mind as well as chaos in our physical world. Negative thoughts are also known as “distorted thinking”.
Operation “Blue Star” is the only event in the history of Independent India where the state went into war with its own people. Even after about 40 years it is not clear if it was culmination of states anger over people of the region, a political game of power or start of dictatorial chapter in the democratic setup.
The people of Punjab felt alienated from main stream due to denial of their just demands during a long democratic struggle since independence. As it happen all over the word, it led to militant struggle with great loss of lives of military, police and civilian personnel. Killing of Indira Gandhi and massacre of innocent Sikhs in Delhi and other India cities was also associated with this movement.
Unit 8 - Information and Communication Technology (Paper I).pdfThiyagu K
This slides describes the basic concepts of ICT, basics of Email, Emerging Technology and Digital Initiatives in Education. This presentations aligns with the UGC Paper I syllabus.
Students, digital devices and success - Andreas Schleicher - 27 May 2024..pptxEduSkills OECD
Andreas Schleicher presents at the OECD webinar ‘Digital devices in schools: detrimental distraction or secret to success?’ on 27 May 2024. The presentation was based on findings from PISA 2022 results and the webinar helped launch the PISA in Focus ‘Managing screen time: How to protect and equip students against distraction’ https://www.oecd-ilibrary.org/education/managing-screen-time_7c225af4-en and the OECD Education Policy Perspective ‘Students, digital devices and success’ can be found here - https://oe.cd/il/5yV
How to Create Map Views in the Odoo 17 ERPCeline George
The map views are useful for providing a geographical representation of data. They allow users to visualize and analyze the data in a more intuitive manner.
2024.06.01 Introducing a competency framework for languag learning materials ...Sandy Millin
http://sandymillin.wordpress.com/iateflwebinar2024
Published classroom materials form the basis of syllabuses, drive teacher professional development, and have a potentially huge influence on learners, teachers and education systems. All teachers also create their own materials, whether a few sentences on a blackboard, a highly-structured fully-realised online course, or anything in between. Despite this, the knowledge and skills needed to create effective language learning materials are rarely part of teacher training, and are mostly learnt by trial and error.
Knowledge and skills frameworks, generally called competency frameworks, for ELT teachers, trainers and managers have existed for a few years now. However, until I created one for my MA dissertation, there wasn’t one drawing together what we need to know and do to be able to effectively produce language learning materials.
This webinar will introduce you to my framework, highlighting the key competencies I identified from my research. It will also show how anybody involved in language teaching (any language, not just English!), teacher training, managing schools or developing language learning materials can benefit from using the framework.
Model Attribute Check Company Auto PropertyCeline George
In Odoo, the multi-company feature allows you to manage multiple companies within a single Odoo database instance. Each company can have its own configurations while still sharing common resources such as products, customers, and suppliers.
2. What is a Digital Image?
Most remote sensing data can be
represented in 2 interchangeable forms:
Photograph-like imagery
Arrays of digital brightness values
3.
4.
5.
6.
7.
8.
9.
10. Colour Composite Displays
We typically create multispectral image
displays or colour composite images by
showing different image bands in varying
display combinations.
19. General Appearance of Surface Features on
Colour Composite Images
Feature
True Colour
False
Colour
trees and bushes
olive green
red
crops
medium to light green
pink to red
wetland vegetation dark green to black
dark red
water
shades of blue and green blue to black
urban areas
white to light blue
blue to grey
bare soil
white to light grey
blue to grey
Source: U.S. Department of Defense, 1995. Multispectral Users Guide.
21. Image Preprocessing
Operations aim to correct distorted or
degraded image data to create a more
faithful representation of the original
scene.
"rectification and restoration"
spatial filtering
radiometric restoration (destriping)
geometric correction
22. Preprocessing functions involve those operations that are
normally required prior to the main data analysis and
extraction of information, and are generally grouped as
radiometric corrections
geometric corrections.
Radiometric corrections include correcting the data for
sensor irregularities and unwanted sensor or atmospheric
noise, and converting the data so they accurately represent
the reflected or emitted radiation measured by the sensor.
Geometric corrections include correcting for geometric
distortions due to sensor-Earth geometry variations, and
conversion of the data to real world coordinates (e.g. latitude
and longitude) on the Earth's surface.
23. Various methods of atmospheric correction can be applied ranging
from detailed modeling of the atmospheric conditions during data
acquisition, to simple calculations based solely on the image data.
An example of the latter method is to examine the observed
brightness values (digital numbers), in an area of shadow or for a
very dark object (such as a large clear lake - A) and determine the
minimum value (B). The correction is applied by subtracting the
minimum observed value, determined for each specific band, from
all pixel values in each respective band.
24. Noise in an image may be due to irregularities or errors that
occur in the sensor response and/or data recording and
transmission. Common forms of noise include systematic
striping or banding and dropped lines.
Both of these effects should be corrected before further
enhancement or classification is performed.
25. Image Registration (Geo-referencing)
Registration is the process of superimposing an
image over a map or over another already
registered data. The method of image
registration or “geo-referencing” can be
divided into two types: “image-to-imageregistration” and “image-to-map-registration”.
Selected image data of the Khorat area was
rectified with reference to the 1:50 000 scale
topographic maps (image-to-map-registration).
image-to-map-registration
Further imagery was geo-referenced to this
already registered satellite image using the
image-to-image registration.
26.
27. The geometric registration process involves identifying the image
coordinates (i.e. row, column) of several clearly discernible points,
called ground control points (or GCPs), in the distorted image (A A1 to A4), and matching them to their true positions in ground
coordinates (e.g. latitude, longitude).
The true ground coordinates are typically measured from a map
(B - B1 to B4), either in paper or digital format. This is image-to-map
registration.
28. Geometric registration may also be performed by registering one (or more)
images to another image, instead of to geographic coordinates. This is called
image-to-image registration and is often done prior to performing various
image transformation procedures,
In order to actually geometrically correct the original distorted image, a
procedure called resampling is used to determine the digital values to
place in the new pixel locations of the corrected output image.
3 common methods for resampling:
Nearest neighbour,
Bilinear interpolation,
Cubic convolution.
Nearest neighbour resampling uses the
digital value from the pixel in the original
image which is nearest to the new pixel
location in the corrected image.
This is the simplest method and does
not alter the original values, but may
result in some pixel values being
duplicated while others are lost. This
method also tends to result in a
disjointed or blocky image appearance.
29. Bilinear interpolation
resampling takes a
weighted average of four
pixels in the original image
nearest to the new pixel
location. The averaging
process alters the original
pixel values and creates
entirely new digital values in
the output image.
This may be undesirable if further processing and analysis,
such as classification based on spectral response, is to be
done. If this is the case, resampling may best be done after the
classification process.
30. Cubic convolution
resampling goes even further
to calculate a distance
weighted average of a block
of sixteen pixels from the
original image which
surround the new output
pixel location. As with
bilinear interpolation, this
method results in completely
new pixel values.
However, these two methods both produce images which have
a much sharper appearance and avoid the blocky appearance
of the nearest neighbour method.
31. Spatial filtering
• Spatial information
– Things close together more alike than things further apart
(spatial auto-correlation)
– Many features of interest have spatial structure such as
edges, shapes, patterns (roads, rivers, coastlines,
irrigation patterns etc. etc.)
• Spatial filters divided into two broad categories
– Feature detection e.g. edges
– Image enhancement e.g. smoothing “speckly” data e.g.
RADAR
31
33. How do we exploit this?
• Spatial filters highlight or suppress specific
features based on spatial frequency
– Related to texture – rapid changes of DN value =
“rough”, slow changes (or none) = “smooth”
43
49
48
49
51
43
50
65
54
51
12
14
9
9
10
43
49
48
49
51
210
225
199
188
Smooth(ish)
189
Rough(ish)
Darker, horizontal
linear feature
Bright, horizontal
linear feature
33
34. Convolution (spatial) filtering
• Construct a “kernel” window (3x3, 5x5, 7x7 etc.) to
enhances/remove these spatial feature
• Compute weighted average of pixels in moving window,
and assigning that average value to centre pixel.
• choice of weights determines how filter affects image
34
35. Convolution (spatial) filtering
• Filter moves over all pixels in input, calculate value
of central pixel each time e.g.
43
49
48
49
51
43
50
65
54
51
12
14
9
9
10
43
49
48
49
51
210
225
199
188
189
Input image
??
1/9
1/9
1/9
1/9
1/9
1/9
??
1/9
1/9
??
1/9
filter
Output image
35
36. Convolution (spatial) filtering
• For first pixel in output image
– Output DN = 1/9*43 + 1/9*49 + 1/9*48 + 1/9*43 + 1/9*50 +
1/9*65 + 1/9*12 + 1/9*14 + 1/9*9 = 37
– Then move filter one place to right (blue square) and do same
again so output DN = 1/9*(49+48+49+50+65+54+14+9+9) =
38.6
– And again….. DN = 1/9*(48+49+51+65+54+51+9+9+10) = 38.4
• This is mean filter
• Acts to “smooth” or blur image
43
49
48
49
51
43
50
65
54
14
9
9
49
48
49
51
210
225
199
188
189
38.4
10
43
38.6
51
12
37
Output image
36
37. Convolution (spatial) filtering
• Mean filter known as low-pass filter i.e. allows low frequency
information to pass through but smooths out higher
frequency (rapidly changing DN values)
– Used to remove high frequency “speckle” from data
• Opposite is high-pass filter
– Used to enhance high frequency information such as
lines and point features while getting rid of low frequency
information
High pass
37
38. Convolution (spatial) filtering
• Can also have directional filters
– Used to enhance edge information in a given direction
– Special case of high-pass filter
Vertical edge
enhancement filter
Horizontal edge
enhancement filter
38
39. Practical
• Try out various filters of various sizes
• See what effect each has, and construct your
own filters
– High-pass filters used for edge detection
• Often used in machine vision applications (e.g. robotics
and/or industrial applications)
– Directional high-pass filters used to detect
edges of specific orientation
– Low-pass filters used to suppress high freq.
information e.g. to remove “speckle”
39