Download to read offline

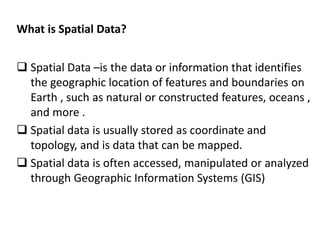
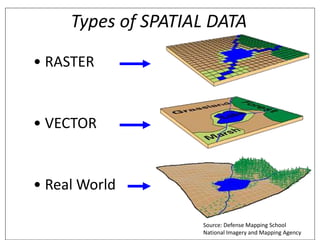
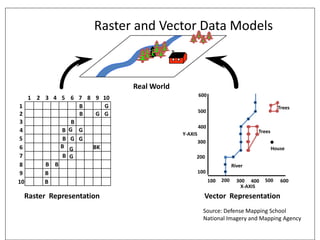
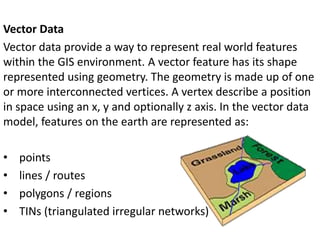
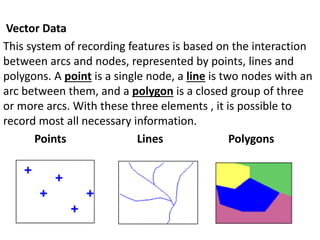
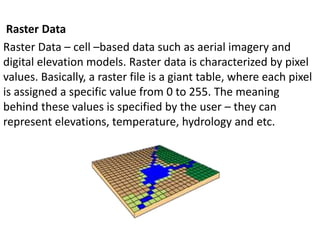
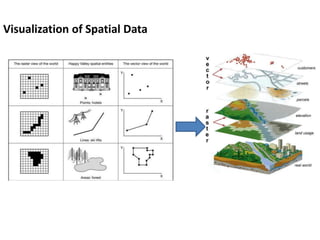
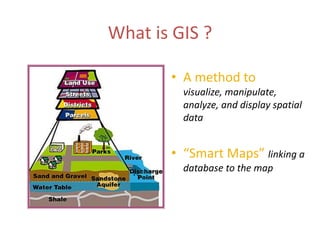

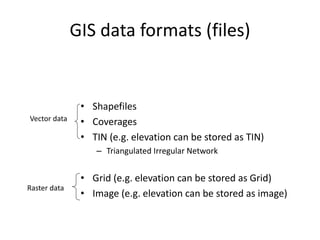
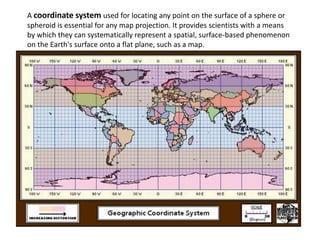

This document discusses geospatial data and its presentation in maps. It defines spatial data as data that identifies the geographic location of features on Earth, such as natural or constructed features. Spatial data is usually stored using coordinates and topology and can be accessed and analyzed using Geographic Information Systems (GIS). The document describes the two main types of spatial data - raster and vector - and how they represent real world features differently. It also discusses visualization of spatial data in maps and introduces the software QGIS for geospatial data presentation and mapping.